The Next Generation Virgo Cluster Survey. VIII. The Spatial Distribution of Globular Clusters in the Virgo Cluster
Abstract
We report on a large-scale study of the distribution of globular clusters (GCs) throughout the Virgo cluster, based on photometry from the Next Generation Virgo Cluster Survey (NGVS), a large imaging survey covering Virgo’s primary subclusters (Virgo A=M87 and Virgo B=M49) out to their virial radii. Using the , color-magnitude diagram of unresolved and marginally resolved sources within the NGVS, we have constructed 2-D maps of the (irregular) GC distribution over 100 square degrees to a depth of =24. We present the clearest evidence to date showing the difference in concentration between red and blue GCs over the full extent of the cluster, where the red (more metal-rich) GCs are largely located around the massive early-type galaxies in Virgo, while the blue (metal-poor) GCs have a much more extended spatial distribution, with significant populations still present beyond 83’ ( kpc) along the major axes of both M49 and M87. A comparison of our GC maps to the diffuse light in the outermost regions of M49 and M87 show remarkable agreement in the shape, ellipticity, and boxiness of both luminous systems. We also find evidence for spatial enhancements of GCs surrounding M87 that may be indicative of recent interactions or an ongoing merger history. We compare the GC map to that of the locations of Virgo galaxies and the X-ray intracluster gas, and find generally good agreement between these various baryonic structures. We calculate the Virgo cluster contains a total population of , of which 35% are located in M87 and M49 alone. For the first time, we compute a cluster-wide specific frequency , after correcting for Virgo’s diffuse light. We also find a GC-to-baryonic mass fraction and a GC-to-total cluster mass formation efficiency , the latter values slightly lower than, but consistent with, those derived for individual galactic halos. Taken as a whole, our results show that the production of the complex structures in the unrelaxed Virgo cluster core (including the production of the diffuse intracluster light) is an ongoing and continuing process.
Subject headings:
galaxy clusters: general – galaxies:clusters:individual(Virgo) – galaxies:star clusters:general1. Introduction
A priority in extragalactic astrophysics is to understand the hierarchical assembly of galaxy clusters, which are expected (in the CDM paradigm) to have built up over time, with the larger galaxies (especially the brightest cluster galaxies, BCGs) having grown through mergers and accretion of many smaller galaxies111The timescales over which this happens, however, is still under debate (e.g. Collins et al., 2009)(e.g. Dubinski, 1998; Springel et al., 2005; Naab et al., 2009; Ruszkowski & Springel, 2009; Oser et al., 2010; Laporte et al., 2013). Thus an understanding of the mass assembly of galaxy clusters is heavily dependent on the large number of galactic interactions that occur over the entire history of the cluster. Detailed studies of the galaxies, intracluster gas, and discrete stellar populations (i.e., stars, nebulae, star clusters) within the cluster galaxies have all provided insights into the basic framework of hierarchical evolution.
The buildup of the extended stellar halo around BCGs (and perhaps other massive cluster members) from interaction with merged/stripped galaxies also results in the formation of a much more extended envelope of stars (Dubinski, 1998; Abadi et al., 2006; Rudick et al., 2006; Cypriano et al., 2006; Murante et al., 2007; Cui et al., 2014). This is the diffuse intracluster light (ICL) that is ubiquitous in massive galaxy clusters. It is comprised of stellar populations that are not gravitationally bound to any single galaxy, but are dynamically part of the galaxy cluster environment222While some works have differentiated between the spatially diffuse light as the ICL and the kinematically distinct populations as a ’diffuse stellar component’ (DSC; e.g. Dolag et al. 2010, Cui et al. 2014), we consider them both to be closely related. The ICL, while of extremely low surface brightness, has been studied in great detail (e.g. Feldmeier et al., 2004a; Zibetti et al., 2005; Gonzalez et al., 2005; Krick et al., 2006; Krick & Bernstein, 2007; Burke et al., 2012), and is now known to contain a significant fraction of the total optical luminosity of galaxy clusters (; see references above); similar fractions are predicted in theoretical studies of galaxy cluster evolution (Murante et al., 2004; Willman et al., 2004; Sommer-Larsen et al., 2005; Monaco et al., 2006; Stanghellini et al., 2006; Purcell et al., 2007).
The detailed study of this extra stellar component provides a crucial glimpse into the dynamical evolution of cluster galaxies and the physical processes that shape them, including galaxy mergers, tidal stripping, cluster virialization, and even the initial conditions of cluster formation. The ICL is also a useful probe of the continuous evolution of the galaxy cluster in which it resides; although the central BCG appears to have formed much of its mass early on, the build-up of the surrounding ICL is likely a much more gradual process, with a significant fraction of it having formed since (e.g. Willman et al., 2004; Murante et al., 2007; Conroy et al., 2007; Burke et al., 2012). The wealth of substructure in and around nearby galaxies suggests that the process of ICL formation continues to the present time (Mihos et al., 2005; Rudick et al., 2009).
While studies of the diffuse ICL provide insight into the evolution of galaxy clusters, the study of the individual stellar populations that comprise this ‘extra’ luminosity can provide even more useful constraints on dynamical evolution. The majority of studies of the discrete stellar populations have been carried out through searches (and subsequent studies) of planetary nebulae (PNe; e.g. Feldmeier et al., 1998; Arnaboldi et al., 2004; Feldmeier et al., 2004b; Aguerri et al., 2005; Gerhard et al., 2007; Castro-Rodriguéz et al., 2009; Longobardi et al., 2013), red giant stars (Ferguson et al., 1998; Durrell et al., 2002; Williams et al., 2007a), and supernovae (Gal-Yam et al., 2003; Sand et al., 2011).
1.1. Globular Clusters
Globular clusters (GCs) provide an important tool for understanding the formation and evolution of galaxies (see the reviews by Ashman & Zepf, 1998; Harris, 2001; West et al., 2004; Brodie & Strader, 2006). They are found in galaxies of all luminosities, environments, and Hubble types (the lone exception being the lowest luminosity dwarf galaxies with , which typically do not have any GCs). GCs tend to be old ( Gyr) and have (relatively) simple stellar populations. Thus their integrated broadband optical/NIR colors can be used as a proxy for metallicity, allowing their use as tracers of the early chemical evolution of galaxies, although the form of their color–metallicity relation remains a critical issue (e.g. Puzia et al., 2002; Peng et al., 2006; Yoon et al., 2011; Blakeslee et al., 2012; Vanderbeke et al., 2014). Furthermore, GCs are the most luminous stellar systems within galaxies, allowing their visibility to greater distances than other stellar tracers – studies of GC systems extend to Mpc and well beyond (e.g. Harris et al., 2009; West et al., 2011; Alamo-Martínez et al., 2013).
GCs are so ubiquitous that they are useful probes of not only individual galaxies, but of the galactic environments in which they reside, from sparse galaxy groups to the densest galaxy clusters. Many studies of GC systems around galaxies have centered on the massive elliptical galaxies in dense galaxy clusters that have the largest GC populations (e.g. Harris, 1986; Geisler et al., 1996; Blakeslee et al., 1997; Blakeslee, 1999; Harris et al., 2009; Harris, 2009a, b; Puzia et al., 2014). However, GC systems typically are quite extended, and thus studies of complete GC systems around individual galaxies are difficult to carry out, especially for nearby galaxies where large area coverage is required. The availability of large CCD mosaics now enables more routine studies of not only the entire GC populations around nearby galaxies, but also cluster-wide GC populations.
The term ‘intergalactic tramp’ was used in the 1950’s (van den Bergh, 1956; Burbidge & Sandage, 1958; van den Bergh, 1958) to describe globular clusters at large distances from the Milky Way. However, it was the early works by Muzzio and collaborators (Forte et al., 1982; Muzzio et al., 1984; Muzzio, 1986, 1987) that began to explore the scenario of ‘GC swapping’ between galaxies in clusters. Both Muzzio (1986) and White (1987) concluded that some of these GCs would become members of the cluster itself – intracluster GCs (or IGCs). West et al. (1995) more formally developed the idea that a large IGC population could help explain the high GC specific frequency values for large ellipticals in the centers of many clusters (e.g. M87 in Virgo). N-body simulations by Yahagi & Bekki (2005) and Bekki & Yahagi (2006) suggested – consistent with studies of intracluster stars – that IGC populations in rich clusters should comprise of the total cluster GC population.
While cluster-wide GC populations are predicted to exist, their definitive detection has been elusive, largely because of the extremely low number densities expected (thousands of GCs spread out over an entire galaxy cluster). Searches for GCs using broad-band colors are necessarily statistical in nature, due to a significant ‘background’ of Milky Way stars and distant galaxies. For example, Tamura et al. (2006a, b) found that any IGC population in their study of the Virgo cluster core region would be at the arcmin-2 level, limited by background uncertainty. Bassino et al. (2003) found a spatially extended excess of objects with GC-like colors in the Fornax cluster, consistent with a cluster-wide population (also suggested by Grillmair et al., 1994; Kissler-Patig et al., 1999; Bergond et al., 2007), but follow-up spectroscopy showed that most are likely bound to NGC 1399 (Schuberth et al., 2008).
The first significant detection of a cluster-wide GC population was that by Jordán et al. (2003) in the center of Abell 1185, later confirmed with color information by West et al. (2011). Since then, small numbers of IGCs have been confirmed in the Virgo and Fornax clusters through the visual inspection of HST images (where the GCs are resolved, and some red giant stars visible; Williams et al., 2007b) or through spectroscopy (Firth et al., 2008; Schuberth et al., 2008).
The first wide-field surveys of sufficient photometric depth to detect statistically significant cluster-wide GC population were carried out in the Virgo cluster (Lee et al., 2010) and in the Coma cluster (Peng et al., 2011). Both showed a significant number of GCs outside the large galaxies of these clusters; a similar result was found with HST in the much more distant cluster Abell 1689 (Alamo-Martínez et al., 2013). Like red giant stars, GCs contain information about the metallicity and age of their parent population; like planetary nebulae, GCs are useful tracers at very low surface densities; like ultra-low surface brightness photometry, GC surveys can reach distances far beyond that possible via individual stars. Perhaps most importantly, GCs can serve as dynamical tracers throughout an entire cluster, making them an important yet virtually untapped resource for understanding the evolutionary states of galaxy clusters.
1.2. GCs in the Virgo Cluster
At a mean distance of 16.5 Mpc (Tonry et al., 2001; Mei et al., 2007), the Virgo Cluster provides the best laboratory for studying the formation and evolution of a typical galaxy cluster. The measured distance of the cD galaxy M87 is consistent with the cluster mean (Blakeslee et al., 2009). However, the cluster itself appears unrelaxed, and deep surface photometry of the core region around M87 by Mihos et al. (2005) clearly shows a wealth of low surface brightness streams and other diffuse features, indicative of a complex evolutionary history. Dynamical studies further showed the complexity of the M87 GC system itself (Cohen, 2000; Côté et al., 2001; Strader et al., 2011; Romanowsky et al., 2012; Zhu et al., 2014). The low surface brightness features and substructure are not confined to the Virgo core, but also occur around other massive galaxies and subgroups within Virgo (Janowiecki et al., 2010; Mihos et al., 2013; Paudel et al., 2013). However, the cluster’s large angular extent (the photographic survey by Binggeli et al., 1985, covered a total of square degrees), makes cluster-wide ICL studies extremely difficult, particularly at resolutions that allow detailed mapping at the galactic level.
Previous photometric and spectroscopic studies of GCs in Virgo have covered limited areas near individual galaxies, or larger areas to very shallow depths. However, hints of how the large-scale environment shapes galactic GC systems can be found in many of these studies. For instance, as part of the ACS Virgo Cluster Survey (ACSVCS; Côté et al., 2004), Peng et al. (2008) found that dwarf galaxies near M87 have richer GC populations than those farther out, suggesting biased GC formation. On the other hand, a possible increase of (also measured from ACSVCS) for giant elliptical galaxies (excluding M87) with cluster-centric radius may be a sign of tidal stripping of the outskirts of these galaxies (Coenda et al., 2009). Lee et al. (2010) used SDSS photometry to study the Virgo-wide population of GCs, but only to , at which just of the complete GC population is detectable. These authors did find a statistically significant population of GCs throughout the inner regions of the Virgo Cluster, suggesting a large number of IGCs. However, the relatively low spatial resolution (limited by the small numbers of GCs detectable at SDSS depth) did not allow for a clear segregation into galactic and intracluster GC populations.
Furthermore, Virgo is a less massive, less relaxed cluster than the Coma cluster, the only other galaxy cluster in which a large-scale ( Mpc) study of the cluster-wide GC population has been conducted (Peng et al., 2011). Thus, an accurate census of Virgo’s overall GC population would allow for useful comparisons of the intracluster stellar components in clusters of differing masses and evolutionary states. Clearly, a very deep, very wide, photometric survey of the Virgo cluster has been badly needed.
1.3. The Next Generation Virgo Cluster Survey (NGVS)
The Next Generation Virgo Cluster Survey (NGVS; Ferrarese et al., 2012) is a very deep, multi-band photometric survey covering 104 deg2 of sky in the direction of the Virgo cluster. The photometric depth of NGVS (see next section) is sufficient to reveal the majority of the GC population in Virgo. Thus, it combines the depth of some previous targeted studies (e.g. Tamura et al., 2006a, b), but at twice the spatial resolution, with the extremely wide field (albeit shallower) cluster-wide survey of Lee et al. (2010). The present work focuses on the search for GCs over the entire NGVS region, through the use of the , color-magnitude diagram for unresolved and marginally resolved sources in the vast NGVS catalog. The exquisite data quality of the NGVS allows a thorough investigation of the amount of background contamination, the primary source of uncertainty in such studies. Other papers in the NGVS series that are related to the work presented here include spatial and kinematic studies of Virgo’s ultra-compact dwarf galaxies (C.Liu et al. , in preparation, H.Zhang et al. , in preparation), spectroscopy of M87’s GCs (E.Peng et al. , in preparation), dynamical modeling of M87’s GC system (Zhu et al., 2014), and the use of imaging in the classification and detection of both stellar and galactic sources in the NGVS (Muñoz et al., 2014).
2. Observations and Data
The technical details of NGVS survey itself, including the field selection, data acquisition and data processing are presented in Ferrarese et al. (2012), so only a brief overview will be provided here. The NGVS is a large-scale survey covering the Virgo Cluster out to one virial radius, with deep images using the CFHT MegaCam wide-field optical imager and the filters, with partial coverage in the band. The MegaCam field-of-view for a single image is roughly deg2, although with the dithering strategy employed, the total field of view for each stacked NGVS field is deg2. The total NGVS survey consists of 117 separate fields, and allowing for overlap between fields, the sky coverage of the NGVS is more than deg2. This covers Virgo subclusters A and B out to their virial radii. The NGVS dataset also includes four separate control fields (hereafter labeled BKG1-4) that are located away from the NGVS footprint; these images are of similar depth and image quality as the rest of the NGVS images, and are thus useful for defining the characteristics of background contamination and assessing the variations in the Galactic foreground stellar population.
Calibration of the NGVS data is done through comparison to stars from the Sloan Digital Sky Survey (York et al., 2000) through the MegaPipe calibration pipeline (Gwyn, 2008), with rms errors of mag. Unless noted otherwise, the resulting magnitudes are on the CFHT MegaPrime photometric system. Although the MegaPrime system shares similarities with the SDSS system, there are notable differences, especially with the filter (e.g. Gwyn, 2008; Ferrarese et al., 2012); any references to the SDSS system will be explicitly stated.
2.1. Photometry
Photometry of all objects on the final, stacked NGVS images was conducted using SExtractor (Bertin & Arnouts, 1996); the details can be found in S. Gwyn et al. (in preparation). We use only the NGVS and photometry, as these were the first filters for which the entire NGVS footprint was completed. Future papers will make use of the color-color diagram (Muñoz et al., 2014) for improved globular cluster selection in the NGVS dataset. Here we use the NGVS photometry of sources based on an aperture diameter of 8 pixels. The spatially-dependent aperture corrections (due to small variations in the stellar point-spread-function [PSF] across the MegaCam field) were derived using samples of bright, unsaturated stars in each MegaCam field for each filter. The individual extinctions and values for each object were derived from the 100 dust maps from Schlegel et al. (1998). All magnitudes presented here have been corrected for these extinction values.
We have considered only those objects that lie outside regions masked by the reduction pipeline following the prescription of Gwyn (2008). Those are the regions around very bright, saturated stars that contain both saturated pixels, diffraction spikes, and elevated signal/noise in the immediate regions, rendering the photometry of objects located near such features suspect. While a survey such as the NGVS will contain many such bright stars, the small size of the individual masked regions ( arcmin2 for the larger ones) will have an insignificant effect on the spatial number densities of objects over the large area being considered here; the total area around masked regions around bright stars is deg2, or less than 2% of the total field area. For our study, we use only those objects in the NGVS catalog with ; the bright cutoff is based on the saturation level of the brightest stars, and the faint cutoff is based on the approximate location of the GC luminosity function turnover for objects in the Virgo Cluster (Jordán et al., 2007, see also Section 3.4). This choice will maximize the number of GCs present in our analysis, while reducing the (increasing) contamination from unresolved background galaxies at fainter magnitudes.
Photometric incompleteness will not be a significant issue for this study. For much of the NGVS field area, image crowding is minimal, and photometric incompleteness due to sky backgrounds will be insignificant. Our adopted faint-end cutoffs ( , ) are over 1.3 magnitudes brighter than the nominal S/N=10 point source photometry for the entire survey ( and ; Ferrarese et al., 2012), thus we expect our photometric completeness to be close to 100%. However, a pair of small regions within 2’ of the centers of M87 and M49 were not included in the SExtractor catalogs due to the high surface brightness background. For M87, a supplemental photometric catalog of sources in the central four deg2 was derived from NGVS images with the light from M87 subtracted; any objects found and measured in the M87-subtracted images were folded in to the original catalog333 A small number of objects near the center of M49 were missed in the SExtractor catalog, although a comparison of our source lists with confirmed M49 GCs show that a very small number (12) of the confirmed GCs were missed. The small number of missing objects will have no effect on the results presented in this paper, which are based on the larger-scale distribution of GCs throughout the Virgo cluster.
2.2. Point Source Selection
At the distance of the Virgo cluster, many (but not all) globular clusters are expected to be point sources in the NGVS images. At the faint photometric levels explored here, contamination by background galaxies can be significant, so the careful removal of clearly resolved objects is crucial in extracting the (comparatively) small number densities of GCs throughout the survey area. For a Virgo cluster distance of Mpc, the median seeing of for most of the NGVS images corresponds to a physical size of 48 pc. Sources are expected to be marginally resolved for sizes of at least FWHM (Harris, 2009a), or pc in our data. With typical Virgo cluster GCs having pc (e.g. Jordán et al., 2009; Strader et al., 2011; Puzia et al., 2014), we expect enough GCs to be marginally resolved such that we need to be mindful of throwing out significant numbers of bona-fide GCs through the use of strict point-source selection parameters.
Point sources were selected based on the concentration index = , the difference between the 4-pixel and 8-pixel diameter aperture-corrected magnitudes. Only the magnitudes were used, as (a) the NGVS images were taken under the best seeing conditions, and (b) the field-to-field variance in FWHM in the images was much less than that for the images. Thus non-stellar sources will be more clearly resolved in the images – tests using a similarly-defined index shows the indication alone is an effective source discriminator.
As bright stars were used to create the aperture corrections described in the previous section, all true point sources should have ; resolved sources will have progressively larger (positive) values of . This is shown in Figure 1, which illustrates values for sources in the entire NGVS catalog.
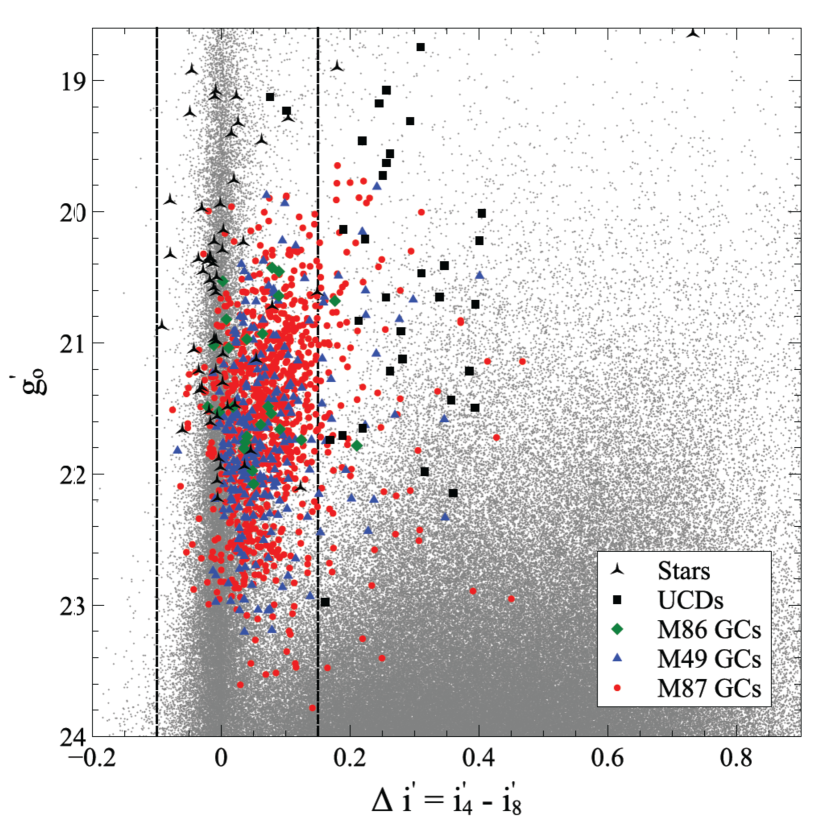
To determine the range of appropriate for Virgo GCs, we have compiled a master catalog of confirmed GCs in some of the luminous Virgo cluster galaxies. This catalog includes all GCs with spectroscopically-derived velocities consistent with Virgo cluster membership, with M87 GCs from Hanes et al. (2001) and Strader et al. (2011)444We consider all Strader et al. (2011) objects classified as GC or as transitional objects as bona-fide GCs., M49 GCs from Côté et al. (2003), and M86 GCs from Park et al. (2012). We have also included 253 velocity-confirmed M87 GCs from Peng et al. (in preparation) that are neither in the Hanes et al. nor the Strader et al. catalogs. The final list includes a total of 1242 GCs from the 3 galaxies combined, of which 1218 have photometry from the NGVS catalog (the very few missing objects are located either within masked regions or near the center of M49).
The values for the spectroscopic GC sample are also plotted in Figure 1, along with 56 confirmed stellar sources in the M87 GC catalog of Strader et al. (2011), and 32 Virgo cluster UCDs from Brodie et al. (2011). Here we see that a significant number of Virgo GCs are marginally resolved, with values systematically larger than that of the mean stellar sequence at =0 . A few GCs (and most of the cataloged UCDs) are well resolved in our data, with larger values. As our goal is to extract as many GCs from the NGVS data without allowing many resolved contaminants into our sample, we have chosen our source selection criterion as those objects with , based on visual inspection of Figure 1. This criterion contains 1094 confirmed GCs, or % of the complete sample. Hereafter, all objects that pass the criterion will be referred to as point sources, although we re-iterate that some marginally-resolved sources are included in this subsample. Our ’point source’ sample – and – for the entire NGVS region (excluding the four background fields) contains 792790 objects.
2.3. Globular Cluster Color Selection
At the magnitudes and colors expected for Virgo cluster GCs, there will be a significant contribution from both foreground Milky Way stars and from unresolved background galaxies. To select candidate GCs, we make use of specific regions within the , color-magnitude diagram (CMD).
The left-hand panel of Figure 2 shows a smoothed Hess diagram for all of the objects in our point source catalog. Each object in the CMD has been Gaussian-smoothed by the photometric errors. The Hess diagram is comprised of many different populations, but is dominated by main-sequence turnoff (MSTO) stars with from both the intervening Milky Way halo (and its substructures) and many nearby, low luminosity MW disk stars visible at . At the faintest magnitudes there are many unresolved background galaxies at all colors. The locus of point sources at is the superposition of two distinct populations – those objects with are largely red-giant-branch (RGB) stars from the Sagittarius dwarf galaxy (which passes through the center of the NGVS region; see Section 3.1.1), while fainter objects are GCs at the distance of the Virgo cluster.
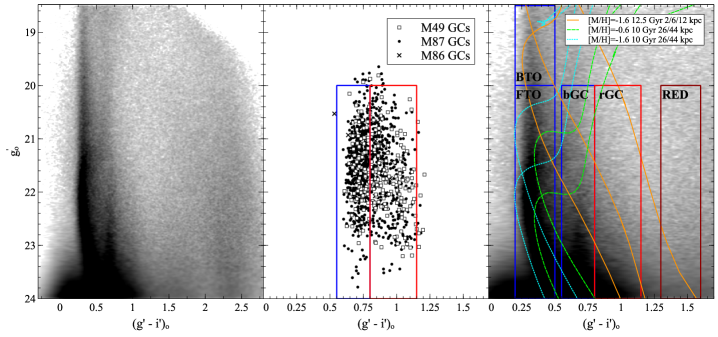
To determine the appropriate color range for Virgo GCs, the center panel of Figure 2 shows NGVS photometry of the radial velocity-confirmed GC sample (see previous section). Most GCs have and , which we adopt as our color and magnitude criteria for GC selection over the entire NGVS dataset. 1055 (or 87%) of the 1218 velocity-confirmed GCs in our sample satisfy all three criteria for selection as GCs.
As the range of colors are indicative of the range of metallicities of the (assumed old) GCs, we have further divided our color criteria into a blue metal-poor GC population (bGC) and a red metal-rich GC population (rGC), with the dividing color at . This color corresponds to a metallicity [Fe/H] based on the [Fe/H] relations from Lee et al. (2010) and Sinnott et al. (2010)555We first converted our MegaCam color to the SDSS color using the relations in Gwyn (2008).. It is important to point out that this color choice was based not on a preferred metallicity, but on the most appropriate color above which very few Sgr stars will appear, aiding in our definition of the appropriate background (control) samples, described below.
2.4. Foreground/Background Contamination
The huge areal coverage of the NGVS and the use of a single broadband color to select GCs also means a large number of contaminating stars and galaxies is present666Use of multiple colors will reduce the background contamination (e.g. Rhode & Zepf, 2004; Tamura et al., 2006a; Kim et al., 2013); future studies will make use of the multi-color NGVS data (e.g. Muñoz et al., 2014).. The presence of numerous spatially distinct halo populations at different distances along the line-of-sight to the Virgo cluster makes the stellar contamination highly spatially dependent; such features include (but are not limited to) the leading arm of the Sagittarius dwarf galaxy (Belokurov et al., 2006), the Virgo Overdensity (VOD; Jurić et al., 2008) and the related Virgo Stellar Stream (VSS; Duffau et al., 2006). The structure of these features based on NGVS observations will be discussed in future papers in this series.
To illustrate this, the right-hand panel of Figure 2 shows isochrones approximating the expected stellar populations within the NGVS data. One of the leading arms of the Sagittarius dwarf galaxy (’Stream A’ from Belokurov et al., 2006) passes through the NGVS field. Moreover, the mean heliocentric distance of this stream changes significantly over the NGVS region, from kpc for our background B3 field to kpc in our background B4 field, with a range of kpc for the NGVS science fields (Belokurov et al., 2006; Niederste-Ostholt et al., 2010). We have over-plotted isochrones that span the ranges of both distance and metallicity of Sgr stars; we used the Bressan et al. (2012) isochrones of ages 10 Gyr, with metallicities of [M/H] and 777Our results do not, however, depend strongly on the representative values used here.. Most Sgr main sequence and subgiant stars will have with colors . Similarly, any MW halo main sequence stars at kpc appear at brighter magnitudes; these are indicated by the (old; 12.5 Gyr) Bressan et al. isochrones with [M/H], consistent with the mean metallicity of MW halo stars (Ryan & Norris, 1991; An et al., 2013).
To quantify the spatially variable contamination from both halo sources and background galaxies, we have defined sections of the , CMD (shown in Figure 2) to make the cleanest possible distinction between the many different populations present in the CMD:
-
•
BTO: , ; largely contains ’bright’ turnoff stars from inner MW halo populations
-
•
FTO: , ; largely contains ’faint’ turnoff stars from both the Sgr dwarf and any MW halo stars at similar distances
-
•
bGC: , ; samples the Virgo blue GC population, as well as Sgr main sequence, subgiant and RGB stars, and inner halo main sequence stars
-
•
rGC: , ; samples the Virgo red GC population, as well as inner halo main sequence stars and faint MW disk stars
-
•
RED: , ; samples both inner halo main sequence stars, and any faint MW disk stars888We avoid the red M dwarf sequence at , which will have little predictive power as control samples for the GC populations we are considering here..
From Figure 2 we see that much of the contamination for the blue GC (bGC) region of the CMD will come from Sgr main sequence and subgiant stars, with contributions from closer halo stars (the faint turnoff [FTO] and bright turnoff [BTO] regions, respectively), while the primary contamination in the red GC (rGC) region is largely from halo stars and MW disk stars, with little contribution from the Sgr dwarf. Unresolved background galaxies contribute to all of the fainter regions.
To define the backgrounds for each of the bGC and rGC populations, we used a combination of regions both internal and external to the NGVS. These regions are shown in Figure 3, overlaid on a map of the point sources over the entire NGVS survey region (including the four background fields B1-B4). However, as the background fields sample parts of the MW halo that differ from that of the NGVS itself (indeed, one can see significant changes in stellar density in fields B1 and B2 versus B3 and B4), we have also defined 10 additional regions in the outskirts of the NGVS field (a) where no large galaxies are present and (b) far from the central regions of either of Virgo’s two dominant subclusters.
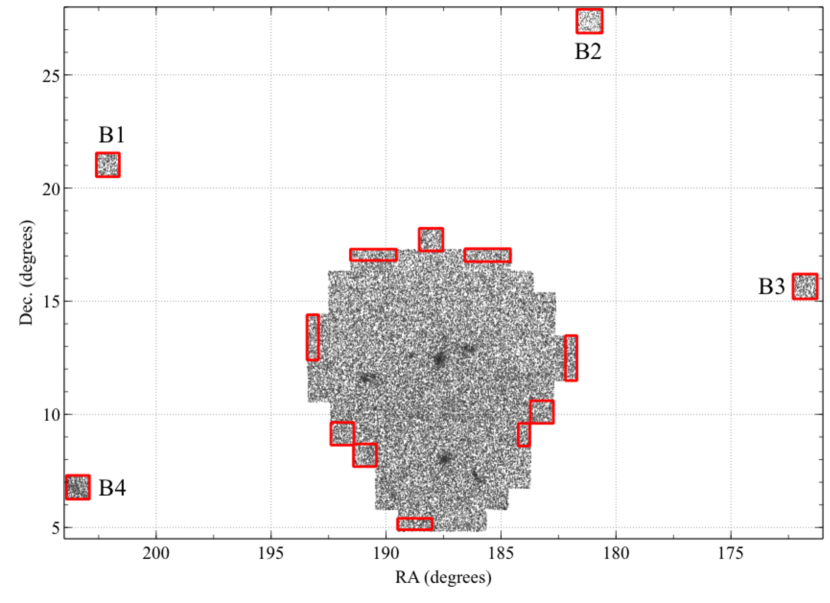
For each of the regions illustrated in Figure 3, we have derived the surface number density (in units of arcmin-2) of point sources through star counts in the CMD regions defined above. We then compare the number densities of contaminating point source objects in the bGC and rGC regions with the densities of objects sampling the other regions of the CMD; these are plotted in Figure 4. The approximately linear behavior between the number densities of GC ’contaminants’ and that of the proxy regions of the CMDs shows our simple background models are reasonable. Furthermore, that the number densities of the control fields within the NGVS region are consistent (within the errors) with the 4 background fields indicate our choice of background fields was also reasonable. Put another way, the 10 intra-NGVS regions do not show any statistically significant excess of objects (over the four background fields) in the bGC and rGC regions that could be construed as a genuine GC population in the very outskirts of the Virgo cluster.
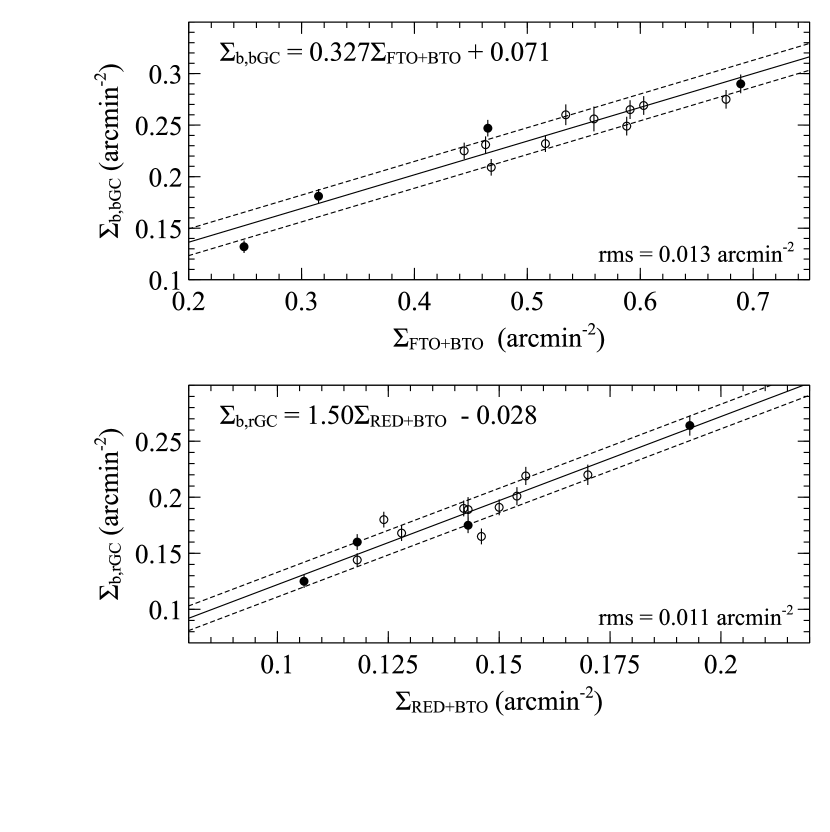
Figure 4 also includes the best-fit linear fits (using orthogonal weighted regression for points with errors in both axes; Feigelson & Babu, 1992) to the number densities from all 14 control fields. The mean rms errors in the relation is 0.013 arcmin-2, and 0.011 arcmin-2 for the relation. These values represent the minimum possible uncertainties in the estimate of the background populations, and lower limits on the number densities of GCs that could possibly be extracted from our dataset.
3. Analysis and Results
3.1. Number Density Maps
Due to the small number densities of GCs expected over such a wide area, and the significant number of ‘background’ objects, it is necessary to create smoothed 2D surface density maps of the various stellar/extragalactic/GC populations present in our data.
All spatial maps presented here were created by replacing the position (,) of each point source from the different regions of the CMD in Figure 2 with a circular Gaussian kernel with either a constant or variable FWHM (see below). The results were mapped onto a full mosaic image of the NGVS field of view with a pixel scale of . To account for the small variations in the true areal coverage of each pixel over the large field of the NGVS, a pixel-area map was constructed in order to convert the image from units of pixel-2 to units of arcmin-2. We stress that all maps presented here are based on the observed number densities of point sources with ; unless explicitly stated, conversion of our values to a total GC number density requires a correction factor of . This factor is based on the detection of the top of the GCLF (see Section 3.4), with an additional correction for the of GCs that are removed by the point source classification described above.
While such smoothing of the data will cause some information to be extended outside the NGVS boundary, such losses are small and will not significantly affect our presented results. Similarly, the number of sources removed in masked regions of the NGVS will also not affect our results in any meaningful way.
3.1.1 Adaptive Smoothing
Due to the large dynamic range of observed number densities expected in our data – from the many GCs near the M87 core to any sparse IGC population – we first applied an adaptive-smoothing approach to the data. We created four point source lists based on the various regions of the CMD shown in Figure 2: the bGC region, the rGC region, the combined BFTO and FTO regions (background for the bGC population), and the combined BTO and RED regions (background for the rGC population). The position of each source was replaced by a circular Gaussian with (Gaussian FWHM=), where is the radial distance from each point to its th nearest neighbor. To avoid any possible artifacts that might result from the addition/subtraction of images with very different smoothing values, the value of for each list was chosen such that the peak of the distribution for the lowest density regions were matched at a value (FWHM), which approximates the largest smoothing value used in the next section. We have adopted the following for each of the four maps : bGC:, rGC:, BTO+FTO: and BTO+RED:.
The resulting adaptive-smoothed maps for each of the bGC and rGC populations are shown in Figures 5 and 6, respectively. The left-hand panels of both figures show the smoothed map for all point sources with colors and magnitudes lying in the bGC/rGC regions of the CMD – the concentrations of sources around the many large galaxies in Virgo are readily visible. The center panel of both figures shows the predicted background map created through the appropriate map (BTO+FTO and BTO+RED, respectively, for the bGC and rGC maps) and applying the and relations from Figure 4. Both background maps show spatial variations, showing that adoption of a constant background value is insufficient.
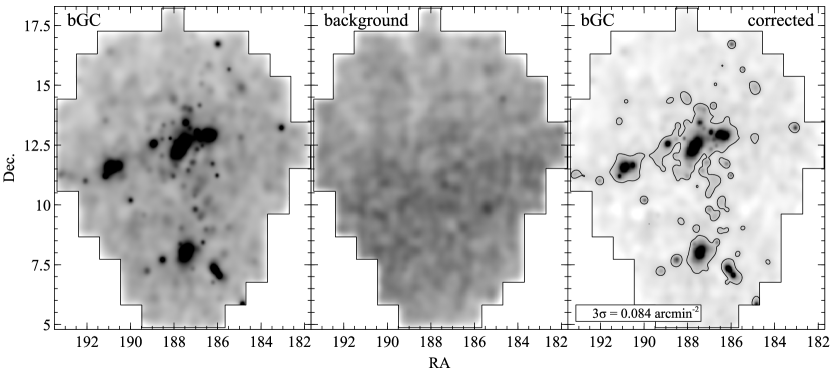
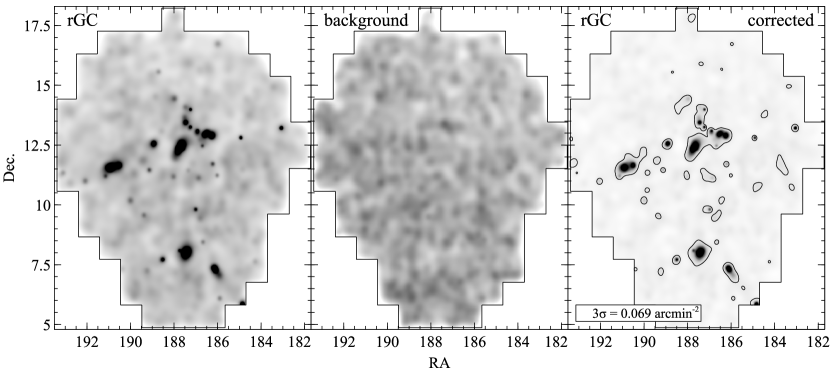
The bGC background map in Figure 5 merits special mention, as the smoothed BTO+FTO map (largely a map of main sequence turnoff stars in the Milky Way halo) shows a distinct positive density enhancement from , , through the center of the NGVS field, to , . This feature is Stream A of the leading arm of the Sgr dwarf galaxy. While a full discussion of this and other Milky Way features in the NGVS data are left for future papers in this series, it is clear that the entire width of this stream appears in our data. While density variations in the rGC background map in Figure 6 are less apparent, there is a slight increase in the number density of stellar objects towards lower . This is due to the presence of the VOD, which covers over square degrees and whose stars have distances of kpc (see Bonaca et al., 2012, and references therein). The spatial peak of the VOD is located outside the NGVS region towards the South; this feature is the dominant background for the (shallower) study of Virgo’s GC populations by Lee et al. (2010).
The right-hand panels in Figures 5 and 6 shows the resulting background-subtracted number density maps of the blue GC and red GC populations in the Virgo cluster. The single contour in these plots is the 3 level; the background noise for these maps (and others) was estimated through computing the standard deviation of the surface densities within six 300300 pixel () regions in the outer regions of the map (far from any obvious excesses). These regions are large enough that we are sampling true variations in for all smoothing values applied. The noise in each map is the combination of the median for the six regions and the background rms errors.
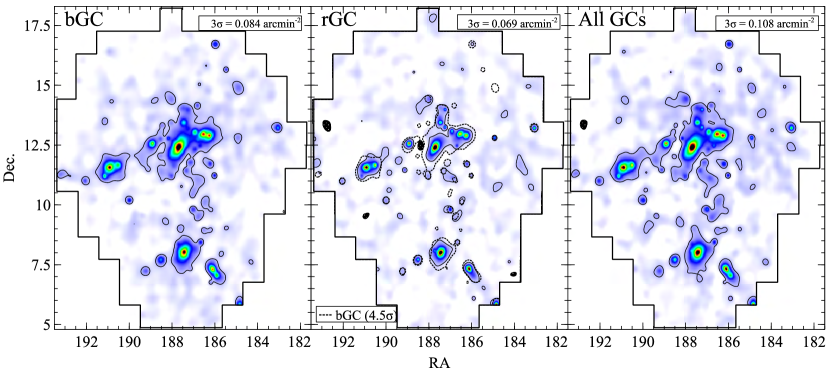
The background-subtracted rGC and bGC maps are markedly different from each other. We illustrate this in Figure 7, which shows the final, background-corrected bGC and rGC maps, as well as the combined GC map (the sum of the bGC and rGC maps). Virgo’s blue GC population appears to be more spatially extended than the red GC population (at the background level). A more extended blue GC distribution is also found for GC systems belonging to individual galaxies (e.g. Geisler et al., 1996; Lee et al., 1998; Bassino et al., 2006; Harris, 2009b; Kartha et al., 2014) and in the Virgo cluster from Lee et al. (2010).
However, it is possible that the spatial differences could be due to the fact that the contour levels shown in the figures are drawn at levels that are relative to the background, rather than to the density level of the GC population itself. To foster a more direct comparison between the two populations, in Figure 7 we plot bCG contours drawn at the same density level as the rGC contours. The level in our rGC map corresponds to a level larger than the mean observed rGC density over the entire NGVS. The same fractional level in the bGC map lies at an observed arcmin-2, or . This comparison shows that the bGC population is still more extended than that of the rGC population around the larger galaxies/subclumps in Virgo, but is particularly evident in the Virgo A=M87 region. This is the clearest demonstration to date that the difference in concentration between the red and blue GC populations is generic to all GC systems in all galaxies, being readily apparent over the entire Virgo cluster. We defer further discussion of specific features on these maps to Section 3.2.
As a test of our derived background values for each map in Figure 7, we also plotted the contours as hatched regions. There are 3 areas of the rGC map that show ’holes’, including a feature east of M87. All of these regions, however, are areas where (a) the surface densities of objects in the rGC region of the CMD show depressed values and (b) where there is an observed enhancement in the background. The negative feature near the eastern edge of the NGVS field at , coincides with the location of the galaxy cluster Abell 1627, but it is unclear if this is the reason for the enhanced background. The locations of 15 other galaxy clusters in the Abell et al. (1989) catalog that lie within the NGVS do not correspond to any features – positive or negative – in either of the background maps. That such ’holes’ exist on our map does indicate that the value may be a slight underestimate. For consistency we continue to use the derived and values, and urge the usual caution when interpreting 3 features. Similar caution is urged near the NGVS boundary in the maps, where artifacts can be introduced from the smoothing of objects outside (but not inside) the NGVS boundary.
3.1.2 Constant Smoothing
For comparison purposes, we have also created smoothed GC number density maps using circular Gaussian kernels with a fixed FWHM and FWHM, corresponding to physical scales of 48 kpc and 144 kpc, respectively. These maps were created (and the noise derived) in the same way as the adaptive-smoothed maps. The FWHM map (left-hand panel of Figure 8) puts emphasis on any smaller-scale structures in the GC maps, at the expense of a higher background noise. The center panel of Figure 8 shows the more heavily smoothed FWHM map, which is useful for probing the much lower GC number densities in the regions between the galaxies. Furthermore, as the FWHM map is similar in resolution (and background noise level) of the Lee et al. (2010) map of Virgo’s GC population, this map will be used to foster a useful comparison with that work.
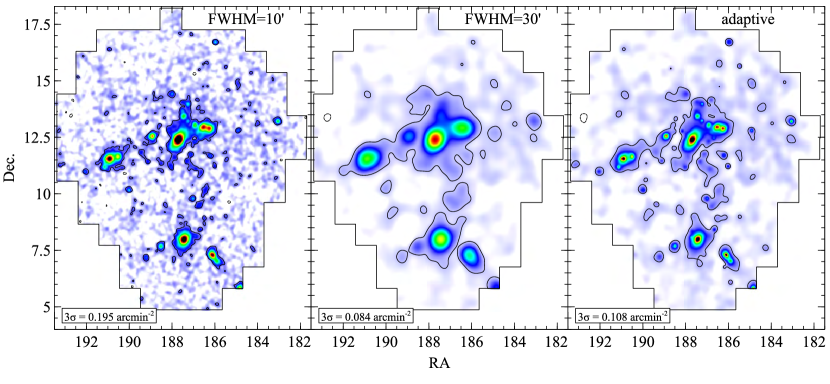
All three maps show (at different levels of depth and resolution) the cluster-wide distribution of GCs in the Virgo cluster, which shows a wealth of substructure, from the large GC populations around the luminous Virgo galaxies to the sparse outer regions. The adaptive-smoothed map will be used for much of the following analyses, as it shows both fine resolution in the cores of large galaxies (with smoothing values FWHM), to much larger smoothing values (typical FWHM) in the less dense regions of the NGVS. The constant smoothed maps will be used to test the validity of features detected in, and the number density profiles derived from, the adaptive-smoothed maps. We stress that all of the features indicated in the following sections are not artifacts of the adaptive-smoothing process – the same features are also visible in at least one of the constant FWHM maps.
3.2. The Spatial Distribution of Virgo’s GC Populations
Figure 9 shows the final, adaptive-smoothed map of Virgo’s GC (bGC+rGC) population, overlaid with the locations of the 1467 Virgo cluster member galaxies from the VCC that lie within the NGVS footprint. As expected, the majority of GC features above arcmin are spatially co-incident with Virgo galaxies. In particular, the largest/densest concentrations of GCs are located in the regions surrounding the four largest substructures of the Virgo cluster; Virgo subcluster A (centered on M87), subcluster B (centered on M49), subcluster C (centered on M60; center left), and the (infalling?) subcluster centered on M86, to the right of M87. The figure also indicates the locations of the brighter Virgo galaxies (). What may seem surprising is the large number of bright VCC galaxies that do not have GC peaks in the map. Due to the (necessarily) large smoothing values applied, any GC systems with small GC populations (many dwarf galaxies), or low density GC systems (e.g. many late-type galaxies) will be smoothed below the contour. Although the GC systems of many spirals are smoothed to below the level in the number density maps, their numbers are included when computing the total number of GCs in the Virgo cluster in Section 3.4.
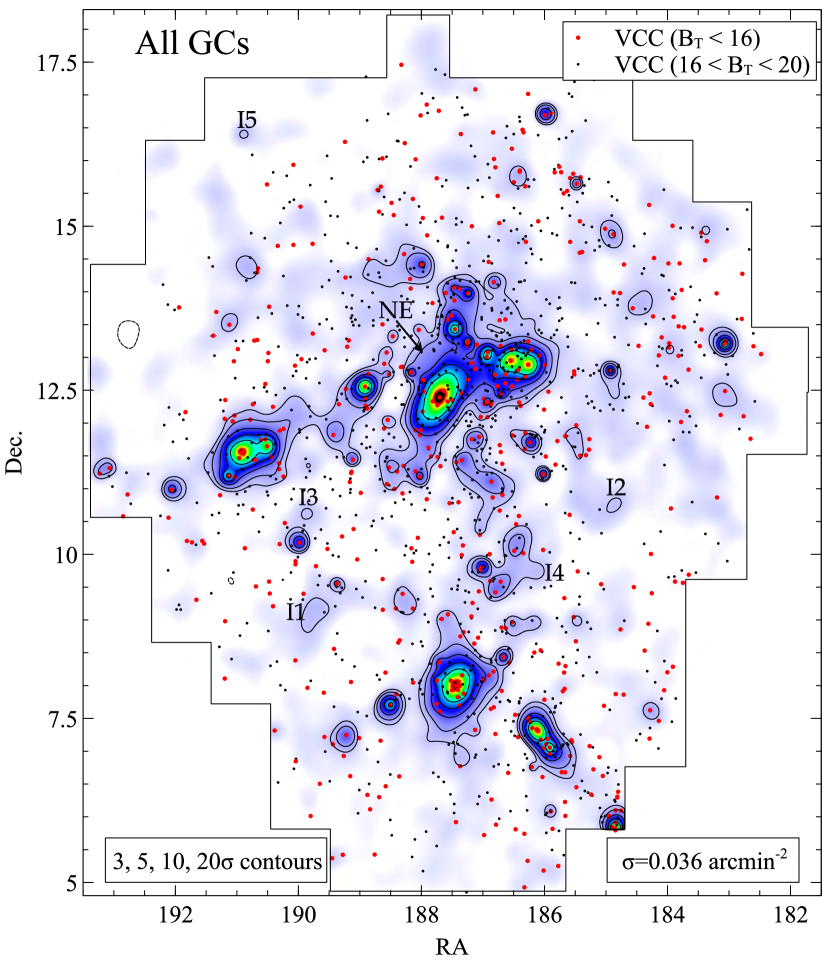
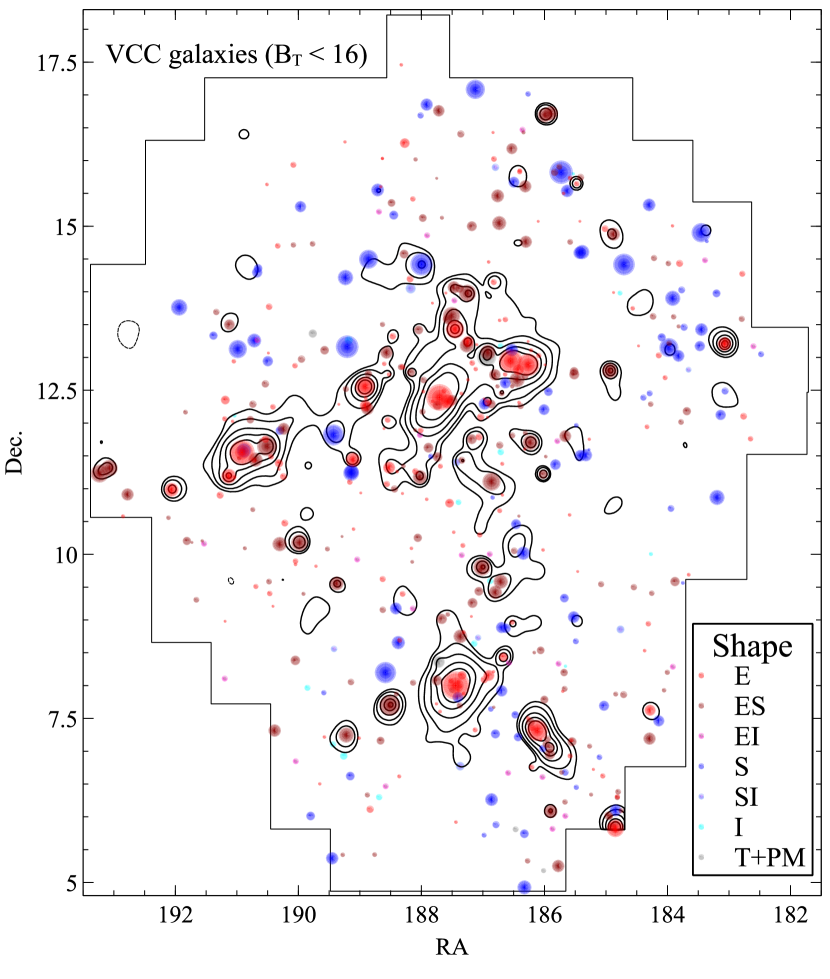
Figure 10 shows the location of all VCC galaxies, brighter than B=16, that are confirmed or probable cluster members located inside the NGVS footprint. To provide a first glimpse into the connection between the GC distribution and galaxy morphology, galaxies have been divided into seven broad categories based on their appearance (i.e., isophotal structure) at optical (NGVS) wavelengths. Full details on this scheme, including classifications for all Virgo galaxies within the NGVS, will be presented in a future paper in this series. Briefly, the seven categories — E, ES, EI, S, SI, I and T+PM — refer to the global structure of the galaxy: i.e., E galaxies have smooth and regular isophotes that are nearly elliptical in shape, S galaxies show unambiguous spiral arm patterns, and I galaxies have a more irregular appearance. The ES, EI and SI categories include (transitional) galaxies that cannot be assigned uniquely to the E, S or I categories (i.e., nearly elliptical galaxies with irregular, large-scale star formation superimposed would be classified as type EI). The seventh category, T+PM, refers to galaxies that are experiencing strong tidal distortion or show evidence for post-merger evolution.
3.2.1 GCs in Virgo Galaxies
The observed distribution of Virgo cluster GCs shown in Figures 9 and 10 largely mirrors that of the distribution of the luminous early-type (E and ES) galaxies, although the spiral galaxy M88 (above center) is a strong counter-example. This is merely the consequence of early-type galaxies tending to have more GCs per unit luminosity (the specific frequency ) than do most spirals (e.g. Harris, 1991).
The bulk of the GCs are located in the Virgo A region surrounding M87, the dynamical center of the Virgo cluster. Not only are many of the GCs around M87 distributed along the galaxy major axis (e.g. McLaughlin et al., 1994; Côté et al., 2001; Strader et al., 2011; Forte et al., 2012), but the GC distribution of the entire region appears asymmetric, where more material is seen to extend to larger distances beyond M87’s NW major axis versus the SE major axis. While some of the irregular distribution is due to GCs in the other bright galaxies in the region, we also see evidence of additional GC populations that will be discussed in Section 3.3.2.
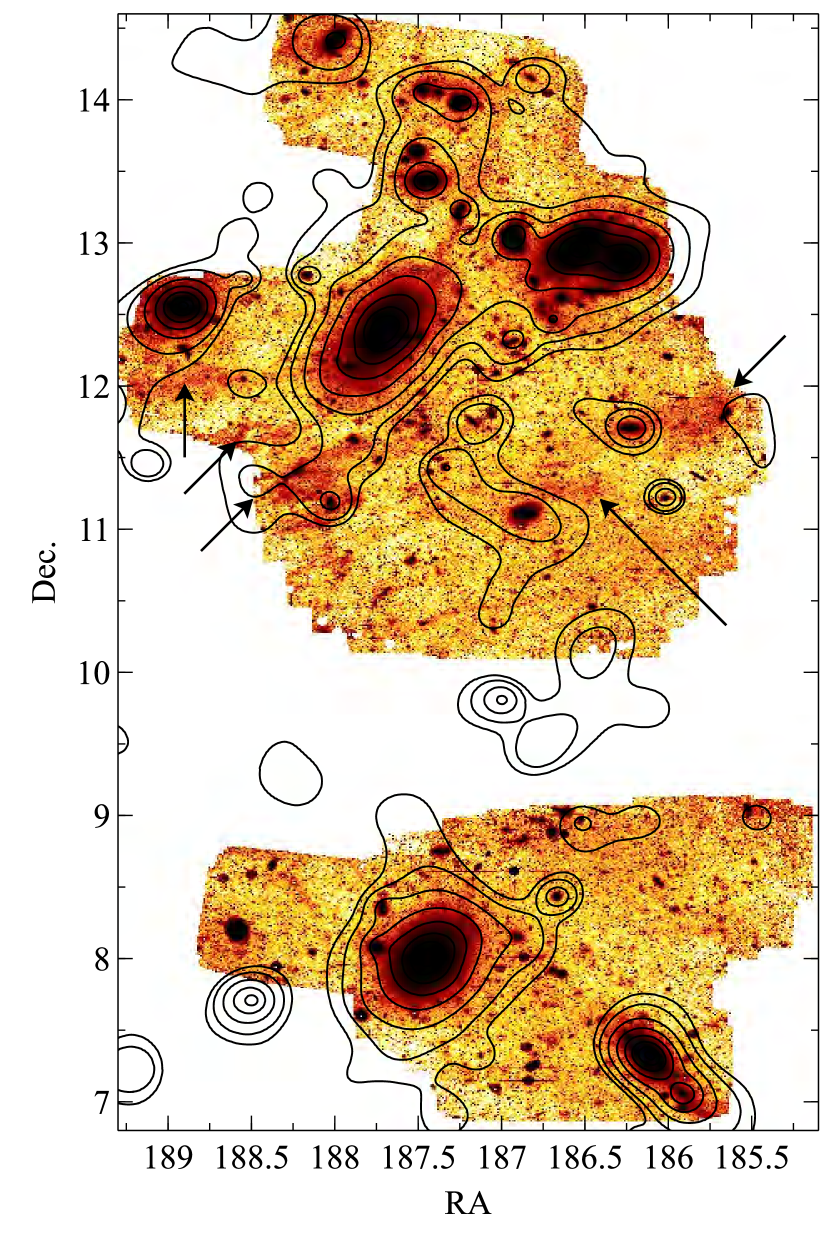
The Virgo A region around M87 shows many spatial substructures in the diffuse light (Mihos et al., 2005); our GC maps indicate this is also true for the GCs. Such substructure is not only due to the presence of the many luminous galaxies within Virgo A, but also smaller, less luminous features that are the result of a continuing and complex evolutionary history (e.g. Mihos et al., 2005; Janowiecki et al., 2010; Romanowsky et al., 2012; Zhu et al., 2014). In Figure 11 we superpose our GC contour map over the ultra-deep -band images of Virgo from Mihos et al. (2005) and Janowiecki et al. (2010), which show the distribution of diffuse light as faint as mag arcsec-2. The GC contours and the diffuse light surrounding M87 and M49 are very similar, down to levels mag arcsec-2. Such comparisons are difficult at fainter levels due the larger uncertainties in both the GC number densities and the diffuse light. The smoothing of our maps does not allow for detection of the many fine structures and stellar streams visible in Figure 11 (and described in Mihos et al., 2005; Janowiecki et al., 2010). The total luminosities of such streams in both the M87 and M49 regions are very low (typically) and would at most contain a handful of GCs, although directed spectroscopic studies might prove interesting.
Also present in the deep -band images are features due not to Virgo Cluster ICL, but to galactic cirrus (see Mihos et al., 2005; Davies et al., 2012, for more details). Comparison with these features (arrowed in Figure 11) with the GC maps show that none are related to enhancements in the GC maps. Indeed, the magnitudes in our point source catalog have already been extinction corrected according to the Schlegel et al. (1998) dust maps based on IRAS 100 maps which also show these brighter cirrus features.
3.2.2 Isolated GCs?
While most of the GCs shown in Figures 9 and 10 are coincident with known Virgo galaxies, there are a number of regions with no known cluster galaxies that lie at greater than above the background in the summed bGCrGC map that could represent regions of Virgo with a ’pure’ population of IGCs. These features are labeled I1-I5 in Figure 9. One such feature (I5) is the GC system of NGC 4651, which is not within the VCC survey area. The remaining 4 features, however, lie between and above the background. As our background maps are based solely on the spatial distributions of two rather different populations – foreground Milky Way halo stars and background galaxies – variations in the number densities of either of these populations (e.g. background galaxy clusters) could lead to a small number of spurious detections. We do find one region in the total GC map in Figure 9 that lies below the background, so it is possible that many (if not all) of these four isolated features are spurious. Analyses in future papers where the background contamination will be reduced through the additional use of and -band imaging (e.g. Muñoz et al., 2014) and/or spectroscopic followup will be required to provide any further insight on these features.
3.3. The Extended GC Populations of Virgo A (M87) and Virgo B (M49)
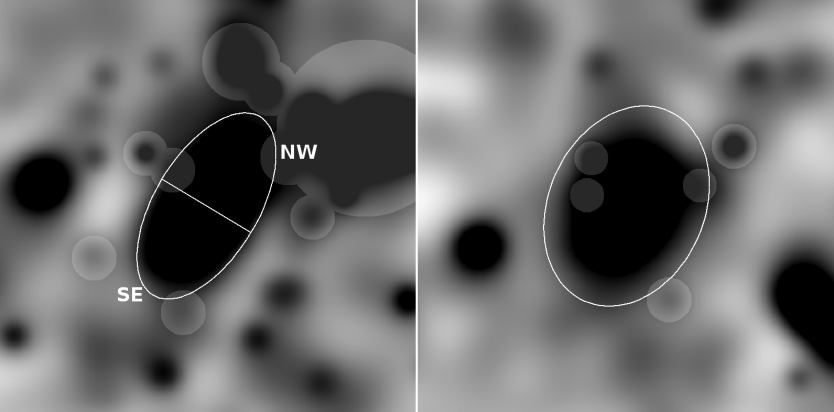
Due to the smoothing applied to create the GC surface density maps, a detailed look of the spatial distribution of globular clusters around individual Virgo cluster galaxies is beyond the scope of this paper, and are left for future papers in the series where either multiple colors are used to reduce the background noise and/or spectroscopic confirmation of cluster membership of individual GCs is done. However, it is illustrative to use our maps to look at the extent of the GC systems around the two most massive subclusters in Virgo, shown in Figure 12. The sheer complexity of the distribution of GCs in the Virgo A region is presumably a combination of GCs from M87, surrounding galaxies (including M84 and M86 to the NW), and any possible extended IGC population. The Virgo B region is also surrounded by the GC systems of many (smaller) galaxies. We can characterize the outer regions of the GC system of each galaxy through fitting ellipses to the smoothed maps.
3.3.1 Elliptical Profiles
For the ellipse fitting, we use the maps with the variable FWHM as they (a) allow for small smoothing values in regions with high (e.g. the cores of M49 and M87), and (b) have a relatively low noise to allow us to define the presence (if any) of any extended GC component around these galaxies. The use of a spatially variable FWHM, however, comes with caveats of its own, as the smoothing in the outer regions of M87 and M49 can be FWHM, and can have an adverse affect on some of the measured parameters. Where possible we make use of the constant FWHM maps (see Figure 8) to assess our results.
By fitting ellipses to both GC systems, we are making the assumption that any GCs within the ellipses are (nominally) associated with each galaxy, and any objects that deviate strongly from such a regular system would be considered non-members. Without spectroscopic confirmation of individual GC candidates, however, such a simplistic assumption is necessary. Due to spatial irregularities in the low density outer regions of each subcluster, we place strong constraints during the ellipse fitting process. We used circular masks to remove as many GCs from neighboring galaxies as possible; the masked regions are shown in Figure 12.
We used the ELLIPSE task in IRAF, where an iterative approach to modeling the elliptical isopleths is carried out for major axis radii from pixel (2) to 350 pixels () for both galaxies on the rGC, bGC and GC adaptive-smoothed maps from Figure 7. The fits continued until the number of rejected pixels exceeded 50% of each ellipse. The centers of the ellipses were fixed to the centers of each galaxy. We also fixed the position angle of the M87 GC system at PA, as tests showed the major axis of M87’s GC system to be relatively constant with radius. This value is consistent with that of M87’s light profile (Janowiecki et al., 2010). For M49 we allowed the ellipticity to vary, and fixed the PA; again, this PA range for the GC system mirrors that of the underlying light (e.g. Janowiecki et al., 2010)
The derived ellipticities for the isopleths are strongly affected by smoothing with a circular kernel. To determine outside what radii such effects are minimized, we performed ellipse fits to the FWHM map, where such effects should be minimal for FWHM (e.g. Schweizer, 1979). We cannot provide a reliable ellipticity profile of the GC systems interior to this. We found that derived from both the adaptive-smoothed and constant smoothed maps for to be similar : and . We adopt these values for defining the GC systems in the outermost regions (see Figure 12). The M87 value can be compared to previous studies that show increases with radius (McLaughlin et al., 1994; Strader et al., 2011; Forte et al., 2012), and our results suggest this trend continues to larger radii. The resulting number density profiles , and are shown in Figure 13. The uncertainties are based solely on the rms errors of the intensity around each ellipse. The adopted errors are large as the data points are not completely independent of each other, as each ellipse fit is based on the results of the previous ellipse; see Jedrzejewski (1987) and Busko (1996) for technical details of the ellipse fitting algorithm and associated uncertainties. However, the size of the error bars gives a reasonable view of the uncertainty at any one point, particularly in the outermost regions where the uncertainties due to the background are significant. Only data points outside for M87 and for M49 (corresponding to the smallest smoothing FWHM in the core region of each galaxy) are shown, as all surface densities interior to this are smoothed down. The GC systems at smaller radii around both galaxies have been previously studied in greater detail (McLaughlin et al., 1994; Harris et al., 1998; Kundu et al., 1999; Lee & Kim, 2000; Tamura et al., 2006b; Waters et al., 2009; Harris, 2009b; Forte et al., 2012). For comparison, M87’s -band light profile (from the Schmidt images of Mihos et al. , in preparation) has also been included. Previous studies have shown that the surface density profiles of the red GC systems in elliptical galaxies closely follows that of the underlying light (e.g. Geisler et al., 1996). We see this trend continue to the outer regions of both M87 and M49.
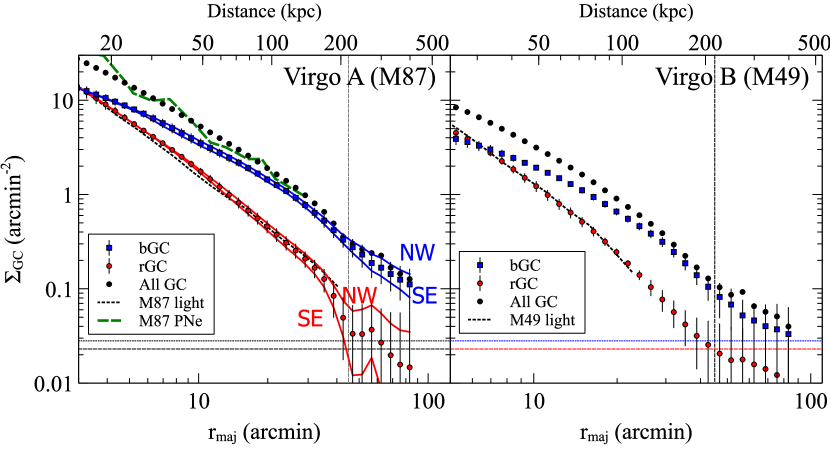
3.3.2 Virgo A (M87)
The mean M87 GC profiles in Figure 13 show the known difference in the spatial distribution of GCs around galaxies, where the blue GCs have a much more extended profile than do the red GCs (for M87, Côté et al., 2001; Tamura et al., 2006b; Strader et al., 2011; Forte et al., 2012). Due to the low surface densities we probe here (and the complete areal coverage provided by the NGVS), we are able to trace out the GC systems to much larger radii than in most previous studies. The profiles in Figures 13 show the red GC system reaches =0 (within the errors) at ( kpc) from M87. The blue GC population, however, remains statistically significant all radii, including 2 above the background at . The mean profile may change slope (to arcmin-2) at , although the uncertainties in the profiles at these radii are large. This may be an indication of a more extended population of (largely blue) GCs throughout the Virgo A region; see Section 4.3 for more details.
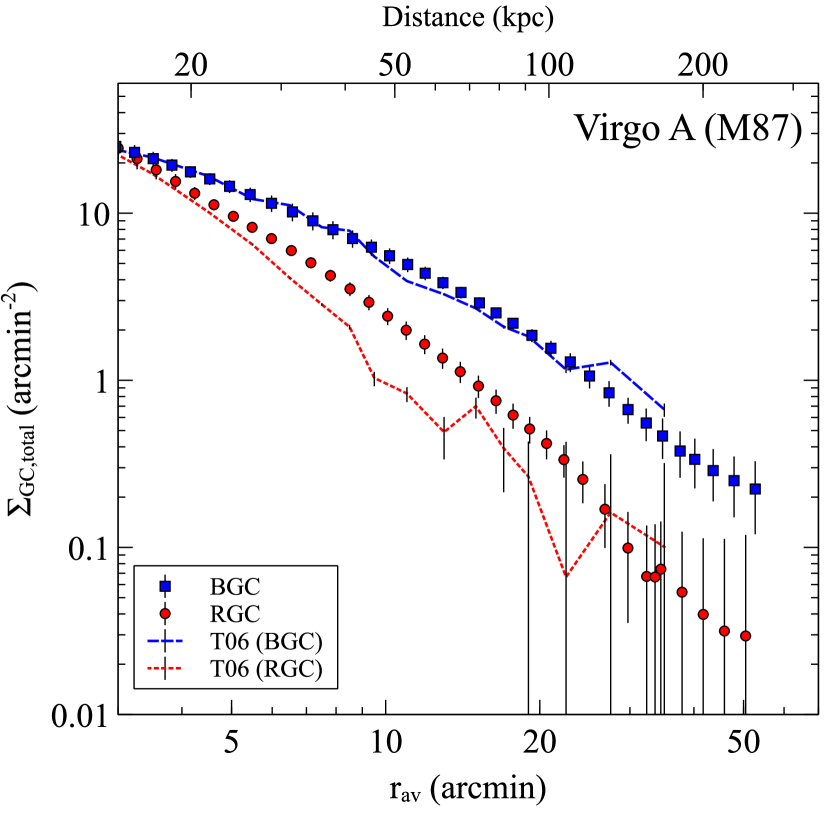
In Figure 14 we compare our total (scaled up by a factor of 2.05 to account for ’missed’ GCs; see Section 3.1) bGC and rGC number density profiles and to the red and blue GC profiles from Tamura et al. (2006b). The latter profiles were derived from a 2 deg2 rectangular region E from M87 towards M59. The bGC profiles are in excellent agreement, and the differences in the profiles are likely due to the adopted color criteria of the two studies; the cutoff used by Tamura et al. is significantly redder than our . As a result our profile contains more ’blue’ GCs as defined by Tamura et al., thus making our rGC profile shallower.
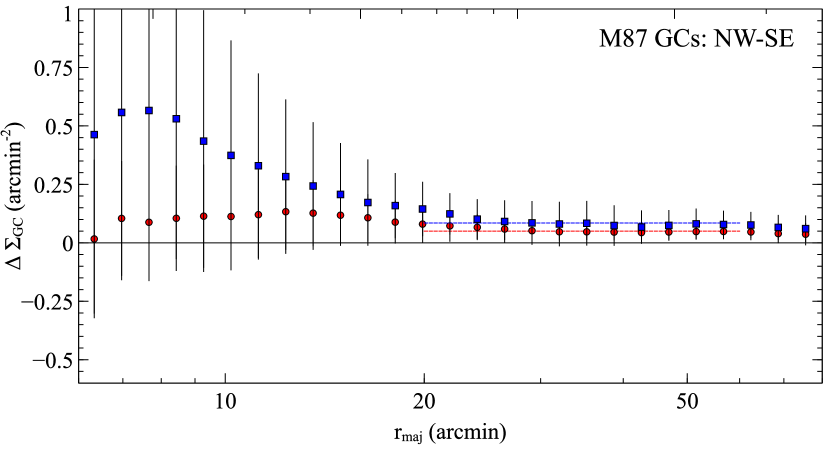
To investigate any spatial variations in the M87 GC system, we fit ellipses to two subsections (NW of M87 along the major axis, and towards the SE) of the M87 GC system in the adaptive-smoothed maps. We input the , and PA values for the mean profiles (derived above) as input to ELLIPSE, and derived the surface densities in each half-ellipse. Here, we allowed the fitting to continue until 50% of each half-ellipse was masked out; the results are plotted as solid lines in Figure 13. In both the blue and red GC profiles, we see slightly larger and values for the NW region than observed in the SE region. To quantify this further, in Figure 15 we plot the differences in the and values () as a function of radius. At most radii there is an excess of GCs in the NW region, although in the inner regions our adopted uncertainties (based on the rms errors of each of the half-ellipse fits) are large enough so that any excess is consistent with zero. The differences in both the bGC and rGC profiles are significant (and remarkably constant) at ; for we find and (internal uncertainties). While it is possible that some of this excess may be due to the presence of overlapping GC systems from neighboring galaxies (even with the aggressive masking applied before the fits), this feature is observed at smaller radii where such interlopers would be even less apparent. Furthermore, most galaxies that lie within from M87 have low luminosities, and would provide few GCs.
We also note the presence of an enhancement in the GC number density towards the NE, but outside of, the nominal Virgo A GC system described above; this will be discussed further in Section 4.4.
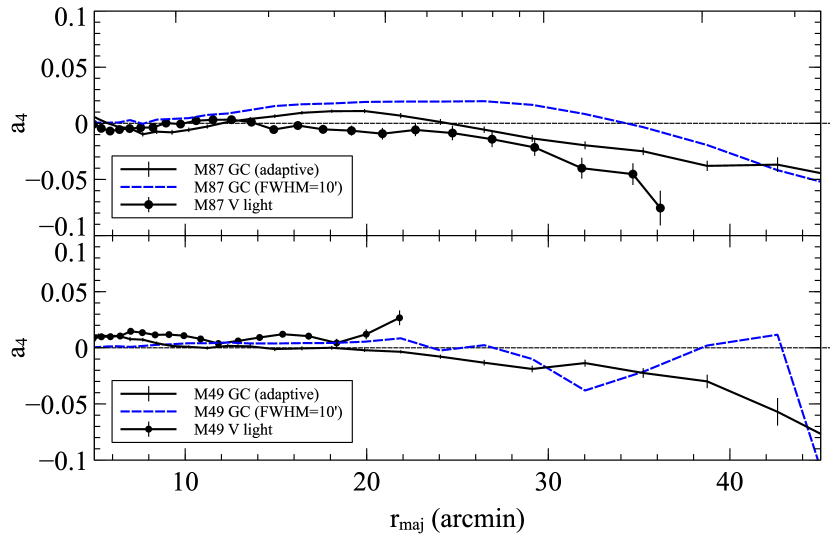
Finally, we examine the deviations from pure elliptical isopleths in the M87 system. Mihos et al. (2005) noted that M87’s diffuse envelope appears boxy in its outermost regions, and the total GC map in Figure 9 shows a similar behavior. To quantify this, in Figure 16 we plot the term (deviations from a perfect ellipse; the percentage of the amplitude of the cos term in the Fourier expansion) as a function of major axis radius derived from the ellipse fits to both the adaptive smoothed map and the FWHM map. In both maps, the profile becomes progressively more negative (boxy) beyond . For comparison, we plot the profile derived from ellipse fits to the deep -band image of Mihos et al. (2005), showing the increasing boxiness for for M87’s light. While the shapes of the M87 diffuse envelope and the surround GC systems are largely similar, we note that the apparent difference in major axis distance at which these take place. However, as noted above, the effect of circular smoothing on the profile from our maps at smaller is likely significant.
3.3.3 Virgo B (M49)
Although M49 contains a more prominent system of diffuse shells and streams in its outer regions (Janowiecki et al., 2010) than M87, there is little indication of this in the spatial distribution of GCs in Figure 12, although (as noted earlier) any small GC populations associated with these features would not appear as significant features in our maps; the six substructures identified by Janowiecki et al. (2010) have a total luminosity of , and would optimistically contribute a total of GCs brighter than . Côté et al. (2003) did, however, see hints of an accretion signature from M49’s GC kinematics.
The , and profiles for M49 are shown in Figure 13. As observed for the M87 profile, the rGC population matches the -band surface brightness profile of the galaxy light quite well, and the rGC profile becomes consistent with =0 at ( kpc). The more extended bGC population continues to much larger radii, and only in the outermost regions (beyond ) does it appear to flatten off at a level arcmin-2, or above the background. If this is due to the existence of a more extended cluster-wide GC population, the surface density of this population is lower (roughly half) than that observed around M87.
In Figure 16 we compare the profile of the Virgo B GC system with that derived from the deep -band Schmidt images from J.C. Mihos et al. (in preparation). While we also see a slight tendency for the Virgo B GC profile to become boxier in the outermost regions, we are only able to compare with the light to ; however, to this radius, the two profiles appear similar.
3.4. Total number of GCs in the Virgo Cluster
To derive the total number of GCs throughout the NGVS region, we use the adaptive-smoothed map from Figure 9. There is no statistically significant population of GCs in the outermost regions of the NGVS; the only exception is the (azimuthally non-isotropic; see D’Abrusco et al., 2013) GC system of NGC 4261, which partially lies within the NGVS region. We derive the number of globular clusters and through summing the (pixel area) and (pixel area) values. The number of observed blue GCs ( ) is , and that of the red GC population is . The uncertainties are based solely on the rms errors of and from the background fits (the largest source of error), expanded to cover the 106.5 square degree area of the NGVS999This number is larger than the 104 square degrees quoted earlier due to the inclusion of photometry from areas just outside the nominal pointings due to dithering.. Correcting for the number of GCs missed by our color, magnitude and size selection criteria (where of known GCs pass all 3 criteria), these numbers become and for . Note that we have made no correction for any faint GCs near the M49 core that may have been missed in the SExtractor source lists. We estimated the total number of missing GCs using the number of velocity-confirmed GCs (13) missing in our source catalog. Extrapolating to the entire GC luminosity function, we estimate as many as GCs (total) are unaccounted for in our estimate. As this is less than 2% of the total population, we have ignored their contribution.
To calculate the total GC population within our survey area, we need to correct for those GCs with . The peak of the GC luminosity function lies at , where we have assumed (Jordán et al., 2007) and from Mei et al. (2007). From the relations in Gwyn (2008), for colors consistent with GCs. Thus the expected peak of the Virgo GCLF is . Adopting a symmetric Gaussian of magnitudes101010While scales with galaxy luminosity (Jordán et al., 2007), this will not have a significant effect on our results due to our magnitude cutoff lying near the GCLF peak. for the GCLF, we sample of the GCLF. Correcting for this, our predicted total number of GCs in the Virgo cluster (bGC and rGC) is . As a sanity check, values derived from the (fixed kernel) maps in Figure 7 are within 5; such differences are far below the uncertainties due to the background contamination.
3.5. The M49 and M87 GC Systems
We also use the profiles from Figure 13 to determine for the individual M49 and M87 GC systems (we did not use the raw and values from the maps due to the masked regions). For each galaxy we integrated the mean and profiles out to a major-axis radius . While is difficult to define for the extended bGC population, any uncertainties in due to varying are much smaller than the uncertainties that arise from the correction for GCs below =24. The results are listed in Table 1.
| (′) | (kpc)aaassuming a Virgo distance Mpc | bbobserved number of GCs to | cctotal predicted number of GCs with the random errors (correction for the missing GCs) and systematic errors (uncertainties in the background) given. | ddtotal mass of GCs | ||
|---|---|---|---|---|---|---|
| M87 bGC | 60′ | 283 | ||||
| M87 rGC | 49′ | 206 | ||||
| M87 GC | ||||||
| M49 bGC | 59′ | 283 | ||||
| M49 rGC | 49′ | 206 | ||||
| M49 GC |
Our derived values of (random)(systematic) and (random)(systematic) are slightly larger than that found in most previously published values (e.g. Harris et al., 1998; Rhode & Zepf, 2001; Tamura et al., 2006b), although in most cases this is due to the larger extent in which we are able to trace the GC systems111111Forte et al. (2012) derive a larger value that we do. We are unsure of the reason for this discrepancy. While our values may be slightly underestimated due to a small number of GCs being smoothed to larger radii, this alone cannot explain the difference.; when we consider the total number of GCs within smaller radii, our results are consistent with previous works. Our values are consistent with and derived by Peng et al. (2008) via the integration of the best-fitting Sersic profiles to their GC profiles to larger radii.
4. Discussion
4.1. The Virgo Cluster-wide Distribution of Globular Clusters
Our results indicate that the Virgo cluster has a large GC population, spread out over a wide area of the NGVS region. The GCs are distributed, unsurprisingly, much like that of the early-type galaxies in Virgo. The lowest-resolution (FWHM) map in Figure 7 shows the extent of the (both red and blue) GCs throughout Virgo, down to a limit arcmin-2 (or a total GC number density arcmin-2), where GCs are seen to extend to large distances from the large galaxies. We see GCs (500-700 kpc) from M87; for the M49 region we see GCs extend out to at least ( kpc). The populous GC systems of M49 and M87 together comprise of the total Virgo GC population, even though those galaxies contain only of the total luminosity of the Virgo cluster. The majority of these GCs are distributed (albeit irregularly) around M87, the center of the most massive subcluster in Virgo. As a result of this, the bulk of the GCs also appear to follow the principal axis of the cluster (West & Blakeslee, 2000) from the M60 subcluster, westward through M87 to beyond M84/86.
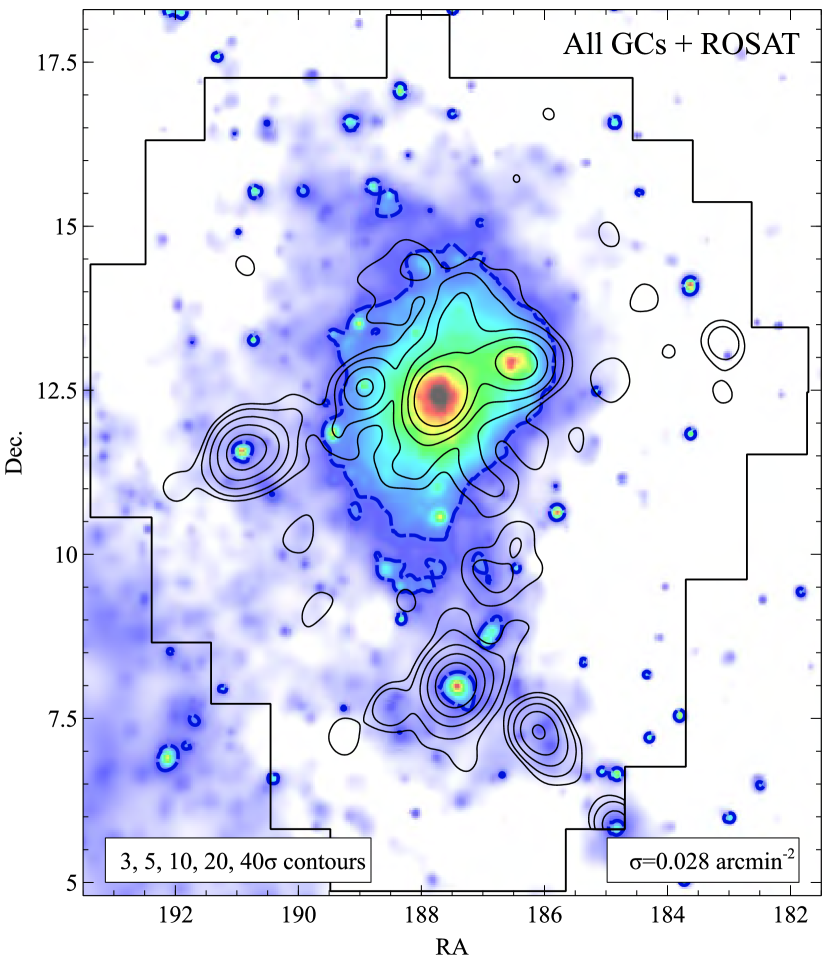
The distribution of Virgo’s GC population is not only similar to that of the diffuse light present in the cluster, but also closely matches that of the hot X-ray intracluster gas (also noted by Lee et al., 2010). In Figure 17 we compare our FWHM map contours with the X-ray image from Böhringer et al. (1994), derived from the ROSAT All-Sky Survey. The dashed X-ray contour shows the close correspondence between the X-rays and the GCs down to the level of the latter. Due to the limits in the GC number densities due to our background, we cannot effectively compare the two distributions at larger distances where there is still significant X-ray emission.
We not only confirm that the blue GCs in Virgo have a more more extended distribution than the red GCs, but that the red GC populations around both M49 and M87 largely disappear (to the limits of our data) at galactocentric distances kpc. Beyond this, the majority of the GC candidates are (metal-poor) bGCs. That we have (largely) metal-poor GCs lying several hundreds of kpc from the center of Virgo does suggest some or most of them are part of the intracluster component of Virgo. We discuss the evidence for such an extended population below. This would indicate that the bulk of the GCs at such large distances from the primary galaxies had originated either in dwarf galaxies (which have preferentially blue GCs, Peng et al., 2008, ; see also Schuberth et al. 2010), or from the outer regions of larger galaxies, where fewer red GCs are located. It is important to note a small population of rGCs could certainly exist at larger radii; an extended GC population composed of red GCs (Peng et al., 2011, found red GCs in the Coma cluster core) could still be present within the uncertainties in our maps.
4.2. Comparison with Lee et al. (2010)
Lee et al. (2010) were the first to study the cluster-wide distribution of Virgo’s GC population through the use of SDSS photometry and using an adaptive smoothing method similar to that applied here. They found that GCs are distributed over a large region of Virgo, with the densest GC regions (with both blue and red GCs) around the dominant galaxies in many Virgo subclusters, including M87, M84/86, M60, and M49. The red GCs only appear to exist around these major subgroups. The blue GCs are much more extended, and fill the region in Virgo along its principal axis.
The NGVS photometry we use probes much fainter limits to that possible in that study ( of the GCLF compared to in our study), allowing us to detect more than 4 times as many GCs. More importantly, that we use more GCs to define our maps not only allows enables us to probe scales of a few arcminutes, but also facilitates a better characterization of the background noise level.
A comparison between Figures 7 and 2(a) from Lee et al. shows generally good agreement, down to similar number densities. Their lowest contour corresponds to (after correction for different photometric depths) arcmin-2, or the level in the FWHM map, where we find a similar distribution of GCs around M84/M86/M87/M89, M49, and M60. However, there are some notable differences between the maps. We are able to trace out the GC systems for all galaxies in ’Markarian’s Chain’ (Markarian, 1961) that extend north of M87 out to NGC 4477. For this reason (and the detection of M88’s GC system) we find GCs extending over 2 degrees north of M87; this is a feature seen in the X-ray map in Figure 17, but not in L10. Similarly, a large, diffuse GC region west of M87 in the L10 map but not in the X-ray maps is not seen in our maps at all, although the prominent GC system of NGC 4168 – not a Virgo cluster member – does appear in this area.
4.3. Cluster and GC Formation Efficiency
Our value of is the first true measurement of the GC population over an entire galaxy cluster. Thus we are able to investigate the cluster specific frequency as an extension of the usual (number of GCs per unit luminosity) defined for individual galaxies (Harris & van den Bergh, 1981). To derive the total luminosity of the Virgo Cluster, we used the magnitudes for all VCC galaxies that are (a) confirmed or probable members of the Virgo cluster and (b) located within the NGVS footprint. We adopted colors for all galaxies classified E/EI/ES (from Section 3.2 and Figure 10) and for all other galaxies. These values (and their assumed errors) are based on inspection of colors from the RC3 (e.g. Corwin et al., 1994) for the brighter early and late-type galaxies. From these we derive a total , for Virgo’s galaxies. To account for any diffuse intracluster light in Virgo that is not included in any VCC magnitudes, we apply an additional (albeit very uncertain) luminosity of based on studies of Virgo’s intracluster RGB stars and PNe (e.g. Durrell et al., 2002; Feldmeier et al., 2004b; Castro-Rodriguéz et al., 2009). The total V-band luminosity of the Virgo Cluster is , or assuming . We thus derive
for the Virgo cluster, a value similar to that of elliptical galaxies. Ignoring the uncertain ICL light fraction would yield a slightly larger .
Many studies (Blakeslee et al., 1997; Blakeslee, 1999; Spitler & Forbes, 2009; Georgiev et al., 2010; Hudson et al., 2014) have shown that the ratio of the GC mass to the total (baryonic+dark matter) mass of galaxies (or GC formation efficiency ) is similar for galaxies over a wide range of morphology and luminosity, where (Spitler & Forbes, 2009; Georgiev et al., 2010; Hudson et al., 2014)121212We have changed the results from Spitler & Forbes (2009) to reflect the median GC mass we have adopted. McLaughlin (1999b) found a similar relation relating to the total baryonic mass (stars + intracluster gas) in galaxies: . These relationships may reflect the early formation of the GCs in proportion to total available mass, before feedback mechanisms become effective in shutting off future star formation. Alamo-Martínez et al. (2013) noted, however, that such formation efficiencies are (necessarily) dependent on the radius out to which the various masses are derived, and found both and to decrease with radius in the massive galaxy cluster Abell 1689.
It is interesting to see if the scaling of GCs with mass for individual galaxies holds for the Virgo cluster as a whole. Assuming an average GC mass (McLaughlin, 1999b), the total mass of GCs in Virgo is . For the baryonic mass, we combine the intracluster gas mass of the M87, M49, and M86 groups (Schindler et al., 1999) with the total stellar mass , found by assuming for old, metal-rich populations (Alamo-Martínez et al., 2013). Thus for a total Virgo baryonic mass of , we find a baryonic GC formation efficiency
This value is lower than from McLaughlin (1999a) and from Alamo-Martínez et al. (2013), although these values are derived at radii of 100 kpc and 400 kpc from the central galaxy, while our results are for the region within Virgo’s virial radius (Mpc). For the total cluster mass, we combine the dark matter halo masses of the Virgo A and B subclusters from Ferrarese et al. (2012), based on McLaughlin (1999a), and the total mass for the M86 subcluster from Schindler et al. (1999), to get . Thus we derive
where the error is based on the uncertainty in only. This result is slightly lower than previously derived galactic values of (Spitler & Forbes, 2009) and (Hudson et al., 2014), but is well within the observed spread seen in both studies, where many galaxies have . Moreover, given the decline in with radius (Alamo-Martínez et al., 2013), there should be some limited region within Virgo over which matches the mean for individual galaxies, although the global value is lower. It is important to note that our values of and are largely independent of our assumed correction for Virgo’s ICL, as Virgo’s stellar mass is a small fraction of the baryonic and total masses.
4.4. Virgo’s Extended Stellar Populations
The extended spatial extent of Virgo’s GC population and its striking similarity to the distribution of the intracluster gas suggests that some GCs must be members of the intracluster medium. Unfortunately, with spatial information alone it is difficult to distinguish between ’galactic’ GCs and IGCs; see West et al. (2011) for a cautionary discussion of IGCs in Abell 1185. A classic definition of intergalactic populations are regions where the surface brightness/number density profile of a galaxy changes slope in the outer regions, suggesting an additional stellar population. The total blue GC number densities in the outermost regions of Virgo A and B are at the arcmin-2 and arcmin-2, respectively. These values are consistent with the broad limits on any IGC population by Tamura et al. (2006b). That these values are only above our background level reduces our ability to effectively model the IGC population as merely an excess of objects above a 1-D profile of the galactic GC populations (see Figure 13); indeed, we only see possible evidence for an inflection point at (240-290 kpc) in the profiles.
Any IGCs superimposed on the large galaxies themselves would only become obvious through velocity information derived from spectroscopic follow-up studies – otherwise they appear as if they were part of the galactic GC system131313This situation is not unique to IGCs, as there have been many definitions used as to what constitutes the intracluster component in diffuse light studies (e.g. Dolag et al., 2010; Rudick et al., 2011).. As noted in section 3.3.2, it is possible to find extra components through their spatial distribution alone. Modeling (and masking) the GC systems around individual Virgo galaxies (Peng et al., 2011, for the Coma cluster) is beyond the scope of this work; and such a task will (necessarily) be left to future studies using multiple colors (e.g. Muñoz et al., 2014) and spectroscopy to significantly reduce the background contamination.
With these caveats in mind, we have found a small spatial asymmetry in the GC number densities within the M87 system (at ). We also find possible evidence for an excess in the GC surface densities NE of M87 (labeled ’NE’ in Figure 9) which lies outside the M87 GC system, but in a region with only a few low luminosity dwarf galaxies. While this latter feature lies above the nominal M87 GC system in our maps (5 above the mean background), it is something to be investigated in future studies. Both of these spatial features could plausibly be due to the presence of an extended intracluster GC population. Recent dynamical studies of GCs in the M87 region have shown additional substructures within 100 kpc from the center of M87 (Romanowsky et al., 2012; Zhu et al., 2014). While it is possible that the NW/SE asymmetry we see is related to either of these features, the GC excess we see lies further ( = 100-250 kpc) from M87 than the kinematic features. The presence of both spatial and kinematic substructure in the GC populations strengthens the case that the production of the ICL (including the liberation of the intracluster stellar populations) is an ongoing process that continues to the present time.
That most of the spatial and kinematic substructures (thus far) are located towards M87’s NW major axis may not be a coincidence. The diffuse optical light observed by Mihos et al. (2005); Janowiecki et al. (2010), the kinematics of PNe NW of M87 from Doherty et al. (2009) and the presence of GCs extending over 700 kpc NW of M87 are all suggestive of an intracluster population that is not centered on M87. Although this has been attributed to the presence of a significant diffuse light component around M86 (and not M87) by Doherty et al. (2009), the wealth of (tidal) substructure around M87 would suggest a larger extended GC population in the Virgo A region. This can only be tested by much larger spectroscopic samples in this region of the Virgo cluster.
A useful comparison can be made between the number density profiles of the GCs in the Virgo A region with that of the PNe. A spectroscopic study of a small number of PNe in the Virgo core by Doherty et al. (2009) suggests that PNe outside kpc141414We have corrected the Doherty et al. (2009) circular-averaged radius kpc to a major-axis radius assuming and using Mpc. from M87 exhibit kinematics expected for an intracluster population, rather than that of objects bound to M87’s halo. In Figure 13 we overlay the surface density profile of a photometrically selected sample of PNe from Longobardi et al. (2013) on our mean GC (bGC+rGC) profile. Although the uncertainties in the PNe profile are not explicitly given (the PNe profile is very sensitive to the background corrections applied), there is excellent agreement in the profiles between the two populations, even though the GCs and the PNe may not necessarily track the same stellar populations. While Longobardi et al. (2013) attribute their excess of PNe (compared to that of the galaxy light) to the combination of an M87 halo and an ICL stellar population (the latter of which has a more metal-poor composition) it is possible that some of their ICL component may be related to the blue GC component of M87’s halo.
4.5. Virgo’s Dynamical History
The wealth of both spatial and kinematic substructure in the galaxy population of the Virgo Cluster (e.g. Binggeli et al., 1987, 1993; Mei et al., 2007; Paudel et al., 2013) is evidence the cluster is not in a fully relaxed state. Furthermore, the observations of Virgo’s extended stellar populations (GCs, PNe, diffuse light) discussed above allow a qualitative discussion on the dynamical state(s) of the Virgo Cluster as a whole. Virgo is the first cluster where the spatial distribution of the entire GC system can be compared to both the cluster-wide intracluster gas and the galaxy population (e.g. Lee et al., 2010). The 2D distribution of Virgo s GCs over a larger scale largely follows the irregular distribution of the galaxies. This result, combined with the spatial and kinematic substructures observed in the stellar populations both within and outside Virgo galaxies (e.g. Mihos et al., 2005; Doherty et al., 2009; Janowiecki et al., 2010; Lee et al., 2010; Romanowsky et al., 2012; Zhu et al., 2014), is a clear indication of the recent (and ongoing) ICL/IGC production. Rudick et al. (2009) suggest that build-up of the ICL is through continual, though episodic processes that have occurred over a large fraction of a Hubble time. Our results are consistent with this picture. There are (related) suggestions that a large fraction of the current ICL was pre-processed by stripping from galaxies in the group environment before their eventual infall into the cluster environment (Mihos, 2004; Rudick et al., 2006). While we cannot directly test this idea here (as we are not studying the group environments at the lowest level), that the smaller subclusters in Virgo (e.g. M49, M60) show less evidence for any IGC population (based on the extent of the bGC populations around M49 and M60 in Figure 7) suggests that ICL production around these (less massive) subclusters is perhaps still in its earliest stages. Forthcoming band imaging of Virgo (e.g. the methods from Muñoz et al., 2014) promises to reduce the background contamination further and allow us to trace the GC population to lower levels than possible here, and would facilitate comparisons with the predictions of cosmological models (e.g. Moore et al., 2006). In contrast, the similarity in the spatial distributions of the intracluster gas and GCs around M87 suggests that the two components have similar dynamical histories. This would indicate that some fraction of the IGC population in Virgo s largest subcluster was liberated early on, or at least at early enough times to allow for partial virial equilibrium. It will be interesting to compare the large-scale GC and X-ray distributions in other clusters in order to determine if a similar correspondence holds in systems of different masses and/or dynamical states, and if we can directly trace the build up of the ICL component through the GCs.
5. Summary
We have used photometry for point sources from the NGVS to extract the population of globular clusters throughout the survey area. We show the following:
– Number density maps of Virgo’s GCs show a complex 2-D structure surrounding the large early-type galaxies in the cluster. Many of the GCs are located near the core of the Virgo cluster, the massive subcluster Virgo A. The Virgo cluster contains a total population of GCs, with a significant fraction () of these lying within the GC systems of M87 and M49 alone. The resulting cluster-wide specific frequency is , and we derive a GC -to-baryonic mass ratio , and a total GC mass ratio within Virgo’s virial radius.
– The GC systems of M87 and M49 are very similar in shape and extent to the diffuse light that is known to surround both galaxies. The M87 GC system, in particular, shows the same ’boxy’ isopleths as seen in the diffuse light in the outer regions of M87, indicative of a common origin.
– The GC systems in both the Virgo A (M87) and Virgo B (M49) subclusters extend to large radii. The red (metal-rich) GCs are found to follow the galaxy light and are seen to extend as far as kpc from the central galaxies; beyond this distance the red GC population is consistent with zero. The blue (metal-poor) GC population has a shallow distribution and extends to much larger distances, with significant populations of GCs still present (with total number densities arcmin-2) 400 kpc from the central galaxies. If some (or all) of the GCs at these radii are ’intracluster’ GCs, this suggests such a population is largely comprised of metal-poor objects, and is suggestive of an origin from either dwarf galaxies, or preferentially removed from the outer regions of larger galaxies. The gravitational processes that have liberated these GCs from their original galaxies continue to the present day.
– We have found a small asymmetry in the M87 GC system, where an observed excess of GCs at arcmin-2 is observed towards the NW of M87. Whether this feature is caused by a population of GCs that is offset from, but superposed on, the M87 GC system, or is partially related to kinematic substructures detected within the M87 GC system itself (Romanowsky et al., 2012; Zhu et al., 2014) cannot be clearly defined from our data. The increasing complexity of the M87 region (both spatially and kinematically) provides strong evidence of the recent and continuing processes of galactic accretion throughout the Virgo core.
– The GCs surrounding M87 have a similar spatial distribution to that of the (relaxed) intracluster gas in the region, suggesting that the build up of the extended GC population began at an epoch early enough for some of the GC population to be in a similarly relaxed state. This is consistent with the slow, gradual build up of the outer regions of BCGs, including the ICL.
References
- Abadi et al. (2006) Abadi, M. G., Navarro, J. F., & Steinmetz, M. 2006, MNRAS, 365, 747
- Abell et al. (1989) Abell, G. O., Corwin, H. G., Jr., & Olowin, R. P. 1989, ApJS, 70, 1
- Aguerri et al. (2005) Aguerri, J. A. L., Gerhard, O. E., Arnaboldi, M., et al. 2005, AJ, 129, 2585
- Alamo-Martínez et al. (2013) Alamo-Martínez, K. A., Blakeslee, J. P., Jee, M. J., et al. 2013, ApJ, 775, 20
- An et al. (2013) An, D., Beers, T. C., Johnson, J. A., et al. 2013, ApJ, 763, 65
- Arnaboldi et al. (2004) Arnaboldi, M., Gerhard, O., Aguerri, J. A. L., et al. 2004, ApJ, 614, L33
- Ashman & Zepf (1998) Ashman, K. M., & Zepf, S. E. 1998, Globular Cluster Systems, by Keith M. Ashman , Stephen E. Zepf, Cambridge, UK: Cambridge University Press, 1998
- Bassino et al. (2003) Bassino, L. P., Cellone, S. A., Forte, J. C., & Dirsch, B. 2003, A&A, 399, 489
- Bassino et al. (2006) Bassino, L. P., Faifer, F. R., Forte, J. C., et al. 2006, A&A, 451, 789
- Bertin & Arnouts (1996) Bertin, E., & Arnouts, S. 1996, A&AS, 117, 393
- Bekki & Yahagi (2006) Bekki, K., & Yahagi, H. 2006, MNRAS, 372, 1019
- Belokurov et al. (2006) Belokurov, V., Zucker, D. B., Evans, N. W., et al. 2006, ApJ, 642, L137
- Bergond et al. (2007) Bergond, G., Athanassoula, E., Leon, S., et al. 2007, A&A, 464, L21
- Binggeli et al. (1985) Binggeli, B., Sandage, A., & Tammann, G. A. 1985, AJ, 90, 1681
- Binggeli et al. (1987) Binggeli, B., Tammann, G. A., & Sandage, A. 1987, AJ, 94, 251
- Binggeli et al. (1993) Binggeli, B., Popescu, C. C., & Tammann, G. A. 1993, A&AS, 98, 275
- Blakeslee (1999) Blakeslee, J. P. 1999, AJ, 118, 1506
- Blakeslee et al. (1997) Blakeslee, J. P., Tonry, J. L., & Metzger, M. R. 1997, AJ, 114, 482
- Blakeslee et al. (2009) Blakeslee, J. P., Jordán, A., Mei, S., et al. 2009, ApJ, 694, 556
- Blakeslee et al. (2012) Blakeslee, J. P., Cho, H., Peng, E. W., et al. 2012, ApJ, 746, 88
- Böhringer et al. (1994) Böhringer, H., Briel, U. G., Schwarz, R. A., et al. 1994, Nature, 368, 828
- Bonaca et al. (2012) Bonaca, A., Jurić, M., Ivezić, Ž., et al. 2012, AJ, 143, 105
- Bressan et al. (2012) Bressan, A., Marigo, P., Girardi, L., et al. 2012, MNRAS, 427, 127
- Brodie & Strader (2006) Brodie, J. P., & Strader, J. 2006, ARA&A, 44, 193
- Brodie et al. (2011) Brodie, J. P., Romanowsky, A. J., Strader, J., & Forbes, D. A. 2011, AJ, 142, 199
- Burbidge & Sandage (1958) Burbidge, E. M., & Sandage, A. 1958, ApJ, 127, 527
- Burke et al. (2012) Burke, C., Collins, C. A., Stott, J. P., & Hilton, M. 2012, MNRAS, 425, 2058
- Busko (1996) Busko, I. C. 1996, Astronomical Data Analysis Software and Systems V, 101, 139
- Castro-Rodriguéz et al. (2009) Castro-Rodriguéz, N., Arnaboldi, M., Aguerri, J. A. L., et al. 2009, A&A, 507, 621
- Coenda et al. (2009) Coenda, V., Muriel, H., & Donzelli, C. 2009, ApJ, 700, 1382
- Cohen (2000) Cohen, J. G. 2000, AJ, 119, 162
- Corwin et al. (1994) Corwin, H. G., Jr., Buta, R. J., & de Vaucouleurs, G. 1994, AJ, 108, 2128
- Collins et al. (2009) Collins, C. A., Stott, J. P., Hilton, M., et al. 2009, Nature, 458, 603
- Conroy et al. (2007) Conroy, C., Wechsler, R. H., & Kravtsov, A. V. 2007, ApJ, 668, 826
- Côté et al. (2004) Côté, P., Blakeslee, J. P., Ferrarese, L., et al. 2004, ApJS, 153, 223
- Côté et al. (2001) Côté, P., McLaughlin, D. E., Hanes, D. A., et al. 2001, ApJ, 559, 828
- Côté et al. (2003) Côté, P., McLaughlin, D. E., Cohen, J. G., & Blakeslee, J. P. 2003, ApJ, 591, 850
- Cui et al. (2014) Cui, W., Murante, G., Monaco, P., et al. 2014, MNRAS, 437, 816
- Cypriano et al. (2006) Cypriano, E. S., Sodré, L., Jr., Campusano, L. E., Dale, D. A., & Hardy, E. 2006, AJ, 131, 2417
- D’Abrusco et al. (2013) D’Abrusco, R., Fabbiano, G., Strader, J., et al. 2013, ApJ, 773, 87
- Davies et al. (2012) Davies, J. I., Bianchi, S., Cortese, L., et al. 2012, MNRAS, 419, 3505
- Doherty et al. (2009) Doherty, M., Arnaboldi, M., Das, P., et al. 2009, A&A, 502, 771
- Dolag et al. (2010) Dolag, K., Murante, G., & Borgani, S. 2010, MNRAS, 405, 1544
- Dubinski (1998) Dubinski, J. 1998, ApJ, 502, 141
- Duffau et al. (2006) Duffau, S., Zinn, R., Vivas, A. K., et al. 2006, ApJ, 636, L97
- Durrell et al. (2002) Durrell, P. R., Ciardullo, R., Feldmeier, J. J., Jacoby, G. H., & Sigurdsson, S. 2002, ApJ, 570, 119
- Feigelson & Babu (1992) Feigelson, E. D., & Babu, G. J. 1992, ApJ, 397, 55
- Feldmeier et al. (1998) Feldmeier, J. J., Ciardullo, R., & Jacoby, G. H. 1998, ApJ, 503, 109
- Feldmeier et al. (2004a) Feldmeier, J. J., Mihos, J. C., Morrison, H. L., et al. 2004, ApJ, 609, 617
- Feldmeier et al. (2004b) Feldmeier, J. J., Ciardullo, R., Jacoby, G. H., & Durrell, P. R. 2004, ApJ, 615, 196
- Ferguson et al. (1998) Ferguson, H. C., Tanvir, N. R., & von Hippel, T. 1998, Nature, 391, 461
- Ferrarese et al. (2012) Ferrarese, L., Côté, P., Cuillandre, J.-C., et al. 2012, ApJS, 200, 4
- Firth et al. (2008) Firth, P., Drinkwater, M. J., & Karick, A. M. 2008, MNRAS, 389, 1539
- Forte et al. (1982) Forte, J. C., Martinez, R. E., & Muzzio, J. C. 1982, AJ, 87, 1465
- Forte et al. (2012) Forte, J. C., Vega, E. I., & Faifer, F. 2012, MNRAS, 421, 635
- Gal-Yam et al. (2003) Gal-Yam, A., Maoz, D., Guhathakurta, P., & Filippenko, A. V. 2003, AJ, 125, 1087
- Geisler et al. (1996) Geisler, D., Lee, M. G., & Kim, E. 1996, AJ, 111, 1529
- Georgiev et al. (2010) Georgiev, I. Y., Puzia, T. H., Goudfrooij, P., & Hilker, M. 2010, MNRAS, 406, 1967
- Gerhard et al. (2007) Gerhard, O., Arnaboldi, M., Freeman, K. C., et al. 2007, A&A, 468, 815
- Gnedin (2003) Gnedin, O. Y. 2003, ApJ, 589, 752
- Grillmair et al. (1994) Grillmair, C. J., Freeman, K. C., Bicknell, G. V., et al. 1994, ApJ, 422, L9
- Gonzalez et al. (2005) Gonzalez, A. H., Zabludoff, A. I., & Zaritsky, D. 2005, ApJ, 618, 195
- Gregg et al. (2009) Gregg, M. D., Drinkwater, M. J., Evstigneeva, E., et al. 2009, AJ, 137, 498
- Gwyn (2008) Gwyn, S. D. J. 2008, PASP, 120, 212
- Hanes et al. (2001) Hanes, D. A., Côté, P., Bridges, T. J., et al. 2001, ApJ, 559, 812
- Harris (1986) Harris, W. E. 1986, AJ, 91, 822
- Harris (1991) Harris, W. E. 1991, ARA&A, 29, 543
- Harris (2001) Harris, W. E. 2001, Star Clusters, Saas-Fee Advanced Course,Volume 28, Springer-Verlag Berlin Heidelberg, p. 223
- Harris (2009a) Harris, W. E. 2009, ApJ, 699, 254
- Harris (2009b) Harris, W. E. 2009, ApJ, 703, 939
- Harris & van den Bergh (1981) Harris, W. E., & van den Bergh, S. 1981, AJ, 86, 1627
- Harris et al. (1998) Harris, W. E., Harris, G. L. H., & McLaughlin, D. E. 1998, AJ, 115, 1801
- Harris et al. (2009) Harris, W. E., Kavelaars, J. J., Hanes, D. A., Pritchet, C. J., & Baum, W. A. 2009, AJ, 137, 3314
- Hudson et al. (2014) Hudson, M. J., Harris, G. L., & Harris, W. E. 2014, ApJ, 787, L5
- Janowiecki et al. (2010) Janowiecki, S., Mihos, J. C., Harding, P., et al. 2010, ApJ, 715, 972
- Jedrzejewski (1987) Jedrzejewski, R. I. 1987, MNRAS, 226, 747
- Jordán et al. (2003) Jordán, A., West, M. J., Côté, P., & Marzke, R. O. 2003, AJ, 125, 1642
- Jordán et al. (2007) Jordán, A., McLaughlin, D. E., Côté, P., et al. 2007, ApJS, 171, 101
- Jordán et al. (2009) Jordán, A., Peng, E. W., Blakeslee, J. P., et al. 2009, ApJS, 180, 54
- Jurić et al. (2008) Jurić, M., Ivezić, Ž., Brooks, A., et al. 2008, ApJ, 673, 864
- Kartha et al. (2014) Kartha, S. S., Forbes, D. A., Spitler, L. R., et al. 2014, MNRAS, 437, 273
- Kim et al. (2013) Kim, H.-S., Yoon, S.-J., Sohn, S. T., et al. 2013, ApJ, 763, 40
- Kissler-Patig et al. (1999) Kissler-Patig, M., Grillmair, C. J., Meylan, G., et al. 1999, AJ, 117, 1206
- Krick et al. (2006) Krick, J. E., Bernstein, R. A., & Pimbblet, K. A. 2006, AJ, 131, 168
- Krick & Bernstein (2007) Krick, J. E., & Bernstein, R. A. 2007, AJ, 134, 466
- Kundu et al. (1999) Kundu, A., Whitmore, B. C., Sparks, W. B., et al. 1999, ApJ, 513, 733
- Laporte et al. (2013) Laporte, C. F. P., White, S. D. M., Naab, T., & Gao, L. 2013, MNRAS, 435, 901
- Lee & Kim (2000) Lee, M. G., & Kim, E. 2000, AJ, 120, 260
- Lee et al. (1998) Lee, M. G., Kim, E., & Geisler, D. 1998, AJ, 115, 947
- Lee et al. (2010) Lee, M. G., Park, H. S., & Hwang, H. S. 2010, Science, 328, 334
- Longobardi et al. (2013) Longobardi, A., Arnaboldi, M., Gerhard, O., et al. 2013, A&A, 558, A42
- Marigo et al. (2008) Marigo, P., Girardi, L., Bressan, A., et al. 2008, A&A, 482, 883
- Markarian (1961) Markarian, B. E. 1961, AJ, 66, 555
- McLaughlin (1999a) McLaughlin, D. E. 1999, ApJ, 512, L9
- McLaughlin (1999b) McLaughlin, D. E. 1999, AJ, 117, 2398
- McLaughlin et al. (1994) McLaughlin, D. E., Harris, W. E., & Hanes, D. A. 1994, ApJ, 422, 486
- Mei et al. (2007) Mei, S., Blakeslee, J. P., Côté, P., et al. 2007, ApJ, 655, 144
- Mihos (2004) Mihos, J. C. 2004, Recycling Intergalactic and Interstellar Matter (IAU Symp. 217), ed. P.-A. Duc, J.Braine & E. Brinks (San Francisco, CA:ASP), 390
- Mihos et al. (2005) Mihos, J. C., Harding, P., Feldmeier, J., & Morrison, H. 2005, ApJ, 631, L41
- Mihos et al. (2013) Mihos, J. C., Harding, P., Rudick, C. S., & Feldmeier, J. J. 2013, ApJ, 764, L20
- Monaco et al. (2006) Monaco, P., Murante, G., Borgani, S., & Fontanot, F. 2006, ApJ, 652, L89
- Moore et al. (2006) Moore, B., Diemand, J., Madau, P., Zemp, M., & Stadel, J. 2006, MNRAS, 368, 563
- Muñoz et al. (2014) Muñoz, R. P., Puzia, T. H., Lançon, A., et al. 2014, ApJS, 210, 4
- Murante et al. (2004) Murante, G., Arnaboldi, M., Gerhard, O., et al. 2004, ApJ, 607, L83
- Murante et al. (2007) Murante, G., Giovalli, M., Gerhard, O., et al. 2007, MNRAS, 377, 2
- Muzzio (1986) Muzzio, J. C. 1986, ApJ, 301, 23
- Muzzio (1987) Muzzio, J. C. 1987, PASP, 99, 245
- Muzzio et al. (1984) Muzzio, J. C., Martinez, R. E., & Rabolli, M. 1984, ApJ, 285, 7
- Naab et al. (2009) Naab, T., Johansson, P. H., & Ostriker, J. P. 2009, ApJ, 699, L178
- Niederste-Ostholt et al. (2010) Niederste-Ostholt, M., Belokurov, V., Evans, N. W., & Peñarrubia, J. 2010, ApJ, 712, 516
- Oser et al. (2010) Oser, L., Ostriker, J. P., Naab, T., Johansson, P. H., & Burkert, A. 2010, ApJ, 725, 2312
- Park et al. (2012) Park, H. S., Lee, M. G., & Hwang, H. S. 2012, ApJ, 757, 184
- Paudel et al. (2013) Paudel, S., Duc, P.-A., Côté, P., et al. 2013, ApJ, 767, 133
- Peng et al. (2006) Peng, E. W., Jordán, A., Côté, P., et al. 2006, ApJ, 639, 95
- Peng et al. (2008) Peng, E. W., Jordán, A., Côté, P., et al. 2008, ApJ, 681, 197
- Peng et al. (2011) Peng, E. W., Ferguson, H. C., Goudfrooij, P., et al. 2011, ApJ, 730, 23
- Purcell et al. (2007) Purcell, C. W., Bullock, J. S., & Zentner, A. R. 2007, ApJ, 666, 20
- Puzia et al. (2002) Puzia, T. H., Zepf, S. E., Kissler-Patig, M., et al. 2002, A&A, 391, 453
- Puzia et al. (2014) Puzia, T. H., Paolillo, M., Goudfrooij, P., et al. 2014, ApJ, 786, 78
- Rhode & Zepf (2001) Rhode, K. L., & Zepf, S. E. 2001, AJ, 121, 210
- Rhode & Zepf (2004) Rhode, K. L., & Zepf, S. E. 2004, AJ, 127, 302
- Romanowsky et al. (2012) Romanowsky, A. J., Strader, J., Brodie, J. P., et al. 2012, ApJ, 748, 29
- Rudick et al. (2006) Rudick, C. S., Mihos, J. C., & McBride, C. 2006, ApJ, 648, 936
- Rudick et al. (2009) Rudick, C. S., Mihos, J. C., Frey, L. H., & McBride, C. K. 2009, ApJ, 699, 1518
- Rudick et al. (2011) Rudick, C. S., Mihos, J. C., & McBride, C. K. 2011, ApJ, 732, 48
- Ruszkowski & Springel (2009) Ruszkowski, M., & Springel, V. 2009, ApJ, 696, 1094
- Ryan & Norris (1991) Ryan, S. G., & Norris, J. E. 1991, AJ, 101, 1865
- Sand et al. (2011) Sand, D. J., Graham, M. L., Bildfell, C., et al. 2011, ApJ, 729, 142
- Schindler et al. (1999) Schindler, S., Binggeli, B., Böhringer, H. 1999, A&A, 343, 420
- Schlegel et al. (1998) Schlegel, D. J., Finkbeiner, D. P., & Davis, M. 1998, ApJ, 500, 525
- Schuberth et al. (2008) Schuberth, Y., Richtler, T., Bassino, L., & Hilker, M. 2008, A&A, 477, L9
- Schuberth et al. (2010) Schuberth, Y., Richtler, T., Hilker, M., et al. 2010, A&A, 513, A52
- Schweizer (1979) Schweizer, F. 1979, ApJ, 233, 23
- Sinnott et al. (2010) Sinnott, B., Hou, A., Anderson, R., Harris, W. E., & Woodley, K. A. 2010, AJ, 140, 2101
- Sommer-Larsen et al. (2005) Sommer-Larsen, J., Romeo, A. D., & Portinari, L. 2005, MNRAS, 357, 478
- Spitler & Forbes (2009) Spitler, L. R., & Forbes, D. A. 2009, MNRAS, 392, L1
- Springel et al. (2005) Springel, V., White, S. D. M., Jenkins, A., et al. 2005, Nature, 435, 629
- Stanghellini et al. (2006) Stanghellini, L., González-García, A. C., & Manchado, A. 2006, ApJ, 644, 843
- Strader et al. (2011) Strader, J., Romanowsky, A. J., Brodie, J. P., et al. 2011, ApJS, 197, 33
- Tamura et al. (2006a) Tamura, N., Sharples, R. M., Arimoto, N., et al. 2006, MNRAS, 373, 588
- Tamura et al. (2006b) Tamura, N., Sharples, R. M., Arimoto, N., et al. 2006, MNRAS, 373, 601
- Tonry et al. (2001) Tonry, J. L., Dressler, A., Blakeslee, J. P., et al. 2001, ApJ, 546, 681
- van den Bergh (1956) van den Bergh, S. 1956, PASP, 68, 449
- van den Bergh (1958) van den Bergh, S. 1958, The Observatory, 78, 85
- Vanderbeke et al. (2014) Vanderbeke, J., West, M. J., De Propris, R., et al. 2014, MNRAS, 437, 1734
- Waters et al. (2009) Waters, C. Z., Zepf, S. E., Lauer, T. R., & Baltz, E. A. 2009, ApJ, 693, 463
- West & Blakeslee (2000) West, M. J., & Blakeslee, J. P. 2000, ApJ, 543, L27
- West et al. (1995) West, M. J., Cote, P., Jones, C., Forman, W., & Marzke, R. O. 1995, ApJ, 453, L77
- West et al. (2004) West, M. J., Côté, P., Marzke, R. O., & Jordán, A. 2004, Nature, 427, 31
- West et al. (2011) West, M. J., Jordán, A., Blakeslee, J. P., et al. 2011, A&A, 528, A115
- White (1987) White, R. E., III 1987, MNRAS, 227, 185
- Williams et al. (2007a) Williams, B. F., Ciardullo, R., Durrell, P. R., et al. 2007, ApJ, 656, 756
- Williams et al. (2007b) Williams, B. F., Ciardullo, R., Durrell, P. R., et al. 2007, ApJ, 654, 835
- Willman et al. (2004) Willman, B., Governato, F., Wadsley, J., & Quinn, T. 2004, MNRAS, 355, 159
- Yahagi & Bekki (2005) Yahagi, H., & Bekki, K. 2005, MNRAS, 364, L86
- Yoon et al. (2011) Yoon, S.-J., Lee, S.-Y., Blakeslee, J. P., et al. 2011, ApJ, 743, 150
- York et al. (2000) York, D. G., Adelman, J., Anderson, J. E., Jr., et al. 2000, AJ, 120, 157
- Zhu et al. (2014) Zhu, L., Long, R. J., Mao, S., et al. 2014, arXiv:1407.2263
- Zibetti et al. (2005) Zibetti, S., White, S. D. M., Schneider, D. P., & Brinkmann, J. 2005, MNRAS, 358, 949