The Debris Disk of Solar Analogue Ceti: Herschel Observations and Dynamical Simulations of the Proposed Multiplanet System
Abstract
Ceti is a nearby, mature G-type star very similar to our Sun, with a massive Kuiper Belt analogue (Greaves et al., 2004) and possible multiplanet system (Tuomi et al., 2013) that has been compared to our Solar System. We present Herschel Space Observatory images of the debris disk, finding the disk is resolved at 70 m and 160 m, and marginally resolved at 250 m. The Herschel images and infrared photometry from the literature are best modelled using a wide dust annulus with an inner edge between 1-10 AU and an outer edge at 55 AU, inclined from face-on by , and with no significant azimuthal structure. We model the proposed tightly-packed planetary system of five super-Earths and find that the innermost dynamically stable disk orbits are consistent with the inner edge found by the observations. The photometric modelling, however, cannot rule out a disk inner edge as close to the star as 1 AU, though larger distances produce a better fit to the data. Dynamical modelling shows that the 5 planet system is stable with the addition of a Neptune or smaller mass planet on an orbit outside 5 AU, where the Tuomi et al. analysis would not have detected a planet of this mass.
keywords:
circumstellar matter planet-disc interactions planets and satellites: dynamical evolution and stability stars: individual: Ceti1 Introduction
Although hundreds of planetary systems are now known, we are still trying to understand whether or not our Solar System is typical. The distributions of known planetary system parameters are strongly affected by observational biases that are not easy to disentangle from the true distributions. Moreover, our Solar System’s architecture (small rocky inner planets, large gaseous outer planets, and an outer debris disk) has not yet been found in other systems, most likely due to these same biases. For example, long time baselines are required to discover planets at greater than a few AU by either the transit or radial velocity (RV) techniques, and directly imaging planets around mature stars like Ceti (5.8 Gyr; Mamajek & Hillenbrand, 2008), is difficult due to the low fluxes of planets after they lose most of their initial heat from formation (e.g. Spiegel & Burrows, 2012).
Fortunately, structures in debris disks can indicate the presence of additional planets. Indeed, one planet so far has been predicted based on disk morphology and then later discovered by direct imaging or another technique, ( Pic b Mouillet et al., 1997; Lagrange et al., 2010). In this paper, we use the debris disk to probe the planetary system around Ceti.
Ceti is a solar-type analogue located only 3.65 pc from the Sun. The infrared excess toward Ceti has been known for nearly three decades, first discovered by IRAS (Aumann, 1985) and later confirmed by ISO (Habing et al., 2001).
Greaves et al. (2004), using the Submillimeter Common-User Bolometer Array (SCUBA; Holland et al., 1999) instrument on the James Clerk Maxwell Telescope (JCMT), found Ceti to have a significant excess and moderately resolved disk at 850 m, extending 55 AU from the star, and inferred to be misaligned with the rotational axis of the star. They fit the observed excess between 60 m and 850 m with a single temperature blackbody at 60 K, and obtained a disk mass of 1.2 , about an order of magnitude higher than our Kuiper Belt.
Here, we revisit the Ceti disk with higher-resolution far-IR images taken by the Herschel Space Observatory111Herschel is an ESA space observatory with science instruments provided by European-led Principal Investigator consortia and with important participation from NASA., attempting to better constrain the properties of the disk. Additionally, we find the observed disk probably does not overlap with the orbits of the proposed multiplanet system (Tuomi et al., 2013), though we cannot rule out a disk inner edge inside the orbit of the outermost planet.
In Section 2, we present the Herschel observations. Section 3 discusses the constraints these observations place on the properties of the Ceti debris disk. In Section 4, we show that the disk inner edge inferred from the modelling is compatible with the proposed compact multiplanet system, and we use dynamical simulations to investigate system stability and the possible presence of additional planets. In Section 5 we discuss the Ceti disk-planet system in the context of other known solar systems, and a summary of our conclusions is given in Section 6.
2 Herschel Observations
| ObsID | Date | Instrument | Duration (s) |
|---|---|---|---|
| 1342199389 | 2010 June 29 | SPIRE 250/350/500 | 2906 |
| 1342213575 | 2011 January 31 | PACS 70/160 | 5478 |
| 1342213576 | 2011 January 31 | PACS 70/160 | 5478 |
Ceti and its surroundings were observed with the Herschel Space Observatory (Pilbratt et al., 2010) using both the Photodetector Array Camera and Spectrometer (PACS; Poglitsch et al., 2010) and the Spectral and Photometric Imaging Receiver (SPIRE; Griffin et al., 2010) as part of the Guaranteed Time Key Programme “Stellar Disk Evolution” to study the six most well-known debris disks (PI: G. Olofsson; Proposal ID: KPGT_golofs01_1). Data at 70 m and 160 m were obtained simultaneously using the PACS large scan-map mode on 31 January 2011 over a successive scan and a cross-scan each lasting 91.3 minutes (ObsIDs: 1342213575 and 1342213576). The PACS scan speed was 20′′ s-1. Data at 250 m, 350 m, and 500 m were obtained simultaneously in the SPIRE large photometric scanning observing mode (“SpirePhotoLargeScan”) on 29 June 2010 over one pass lasting 48.4 minutes (ObsID: 1342199389). The SPIRE scan speed was 30′′ s-1 (the medium scan rate). Table 1 summarizes the Herschel observations.
The PACS and SPIRE data were reduced separately following standard procedures in HIPE version 13 (Ott, 2010) using calibration set 65. Table 2 lists the measured fluxes or upper limits for each band. PACS aperture photometry is measured using 12′′ and 22′′ apertures for the 70 and 160 m bands, respectively. Uncertainties for the PACS photometry values are computed using several apertures on the background. All uncertainties are 1 . Table 2 also lists the beam sizes for each band (Vandenbussche et al., 2010).
| Flux | Unc. | Beam size | |
|---|---|---|---|
| (m) | (mJy) | (mJy) | (′′) |
| 70 | 303 | 6 | 5.6 |
| 160 | 111 | 8 | 11.3 |
| 250 | 35 | 10 | 18.1 |
| 350 | 28 | - | 25.2 |
| 500 | 20 | - | 36.9 |
The SPIRE data provide mainly upper limits, as the disk grows fainter and the resolution grows larger as we proceed to longer wavelengths. At 250 m, assuming the disk is not resolved, the flux comes from the peak pixel, which has 24 6 mJy, with the uncertainty coming from confusion. Using the modelling described in Section 3.1.1, we find 35 10 mJy. This is more reliable since the disk may be marginally resolved at 250 m. At 350 m there is some emission where Ceti is expected to be, which added to the confusion limit gives 28 mJy. At 500 m, only confusion is visible, giving a limit of 20 mJy.
Photometric calibration uncertainties are expected to be within 3% at 70 m, 5% at 160 m, and 15% at 250 m, 350 m, and 500 m (Poglitsch et al., 2010; Swinyard et al., 2010; Müller et al., 2011).
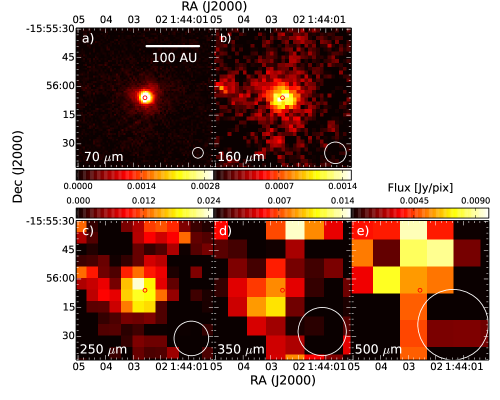
Figure 2 shows a composite of cropped Herschel maps at 70 m, 160 m, 250 m, 350 m, and 500 m, centered at a position of 01:44:02.6, -15:56:05.8 (J2000), the position of peak emission at 70 m. This position is within 1′′ of the expected position of Ceti, given both its ICRS coordinates (i.e., 01:44:04.08,-15:56:14.9) and proper motion ( = -1.72105 ′′ yr-1, = 0.85416 ′′ yr-1) from the Hipparcos Catalogue (van Leeuwen, 2007).
Ceti at 70 m in Figure 2a is bright and quite compact; the three “lobes” located in the NNW, SSW, and ENE directions are artifacts of the PACS beam at 70 m. Given these secondary beam features, it is not possible to tell by eye if any 70 m emission is extended. The source at 160 m in Figure 2b is less bright but still compact. At 250 m (see Figure 2c), the source is less significant but the star-centered emission is associated with Ceti. At 350 m and 500 m (Figures 2d and 2e respectively), any emission at the Ceti position is hard to distinguish from the background confusion.
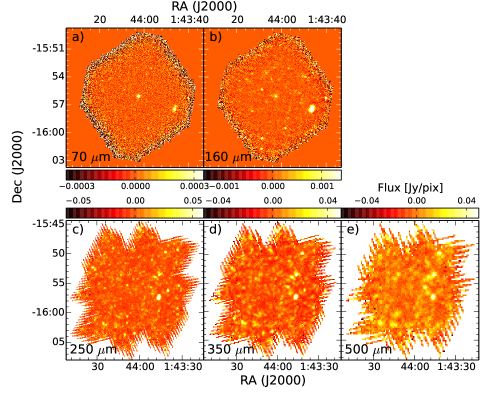
Figure 2 shows the uncropped Herschel maps at each wavelength, stretched in colour to emphasize faint background sources. At 70 m (Figure 2a), Ceti dominates the image but a few other background sources are seen. Most notably, the extended galaxy MCG-03-05-018 located to the WSW at 01:43:46.8,-15:57:29 (J2000) is also detected. Moving to 160 m (Figure 2b), Ceti is no longer the brightest object seen; MCG-03-05-018 and many other background objects are brighter. Also, more faint background sources are seen. At 250 m, 350 m, and 500 m (Figures 2c, d, and e, respectively), though some emission may be associated with Ceti (particularly at 250 m), it is barely distinguishable from emission of background objects. Note that MCG-03-05-018 is clearly detected in all five Herschel bands.
3 Ceti’s Debris Disk
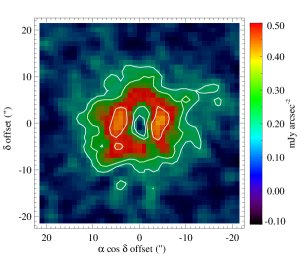
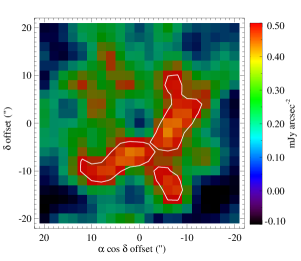
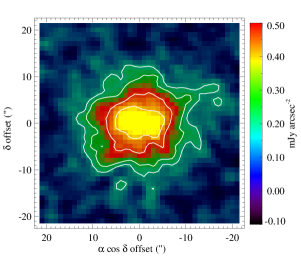
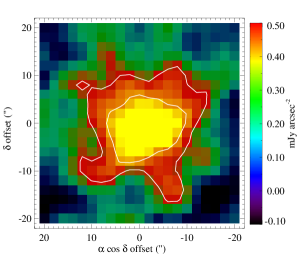
It is not obvious from Figure 2 that a disk is present due to large contrast with the star. Therefore, we present peak- and star-subtracted images to highlight the extended disk structure. Figure 4 shows the images of the flux toward Ceti at 70 and 160 m, where the point-spread function (PSF) has been scaled to the value of the peak pixel and subtracted. This makes it clear that there is extended structure around Ceti, visible at both 70 and 160 m. For comparison, Figure 4 shows the star-subtracted images at the same wavelengths, where the PSF has been scaled to Ceti’s photosphere and subtracted; contours give significance of the remaining flux.
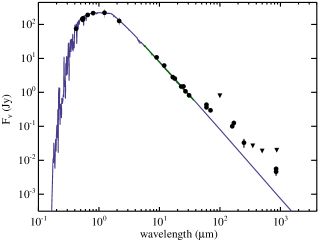
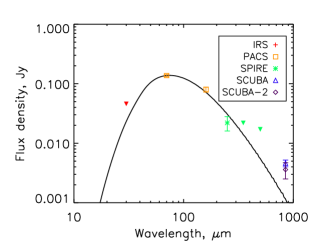
Figure 5 shows the observed flux density distribution (hereafter referred to as spectral energy distribution; SED) of Ceti, using data obtained from the literature and Herschel (see caption and Table 3 for specific references). Figure 5 also shows a stellar photosphere model fit to the data. As can be easily seen, the stellar model fits the data from optical to mid-infrared wavelengths (24 m). At longer (PACS) wavelengths, however, the observed fluxes are significantly higher than those expected from the photosphere alone. For example, the observed 160 m flux is 111 8 mJy while the expected 160 m flux from the photosphere is 31.1 0.4 mJy.
| Band | Obs. Flux | Uncertainty | Citation | |
| (m) | (Jy) | (Jy) | ||
| 0.364 | 146.6 | 3.2 | Mermilliod (2006) | |
| 0.42 | 74.7 | 1.1 | Høg et al. (2000) | |
| 0.442 | 146.4 | 3.2 | Mermilliod (2006) | |
| 0.532 | 145.7 | 1.4 | Høg et al. (2000) | |
| 0.541 | 136.7 | 0.68 | Perryman & ESA (1997) | |
| 0.547 | 151.9 | 3.2 | Mermilliod (2006) | |
| 0.653 | 190.2 | 3.5 | Bessel (1990) | |
| 0.803 | 214.9 | 3.9 | Bessel (1990) | |
| 1.24 | 220.6 | 63 | Cutri et al. (2003) | |
| 2.16 | 126.4 | 32 | Cutri et al. (2003) | |
| IRS1a | 6.5 | 18.15 | 0.65 | Chen et al. (2006) |
| IRS2a | 8.69 | 10.19 | 0.24 | Chen et al. (2006) |
| AKARI9 | 9 | 10.71 | 0.17 | Ishihara et al. (2010) |
| IRS3a | 11.4 | 5.885 | 0.13 | Chen et al. (2006) |
| IRAS12 | 12 | 6.158 | 0.42 | Moshir (1990) |
| IRS4a | 16.6 | 2.801 | 0.073 | Chen et al. (2006) |
| AKARI18 | 18 | 2.544 | 0.071 | Ishihara et al. (2010) |
| IRS5a | 22.9 | 1.509 | 0.039 | Chen et al. (2006) |
| IRAS25 | 25 | 1.503 | 0.14 | Moshir (1990) |
| IRS6a | 27 | 1.094 | 0.025 | Chen et al. (2006) |
| IRS7a | 31 | 0.8393 | 0.021 | Chen et al. (2006) |
| ISO60 | 60 | 0.433 | 0.037 | Habing et al. (2001) |
| IRAS60 | 60 | 0.3978 | 0.048 | Moshir (1990) |
| IRAS100 | 100 | 0.8253 | 0.27 | Moshir (1990) |
| ISO170 | 170 | 0.125 | 0.021 | Habing et al. (2001) |
| SCUBA | 850 | 0.0058 | 0.0006 | Greaves et al. (2004) |
| SCUBA-2 | 850 | 0.005 | 0.001 | Greaves et al. (in prep.) |
| HHT870 | 870 | 0.0198 | - | Holmes et al. (2003) |
| a IRS values are binned from spectral data in Chen et al. (2006). | ||||
The appearance of excess emission in the SED suggests that Ceti is indeed surrounded by cooler dust. The narrow wavelength range of the detected excess and the lack of widely extended PACS emission, however, put constraints on the location of this dust. On one hand, the fact that the excess is seen only at wavelengths longer than 24 m suggests the dust is cold and thus situated at relatively large distances from the star. On the other hand, the small scale of the emission in the PACS images suggests the dust also cannot be too far from the star. In the following, we describe a simple debris disk model that remains consistent with the observed optical to mid-infrared emission, and that also can reproduce well the fluxes and extents of the observed far-infrared (PACS) emission.
3.1 Modelling the Disk
We modelled the Ceti disk images and spectrum in a two-step process. The images provide all-important constraints on the spatial structure, which we obtain first by reproducing the PACS and SPIRE 250 m images using a simple dust disk model (Section 3.1.1). This process does not yield definitive results because the PACS image resolutions limit what can be inferred about the disk inner edge. Using the results from the spatial modelling and an additional assumption of specific grain properties to model the disk spectrum (Section 3.1.2) yields further constraints on the disk inner edge.
3.1.1 Image-Based Disk Model
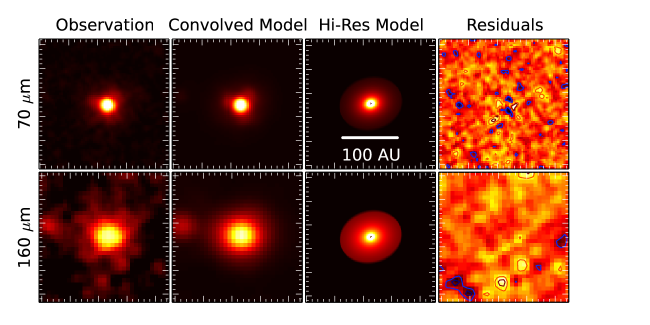
We first use the PACS and SPIRE 250 m images to fit a physical model for the disk structure. The 250 m image has little spatial information, but we can measure the model flux as a check on the above photometry (finding 35 10 mJy, larger than the 24 mJy estimated above if the disk were unresolved at 250 m). Our spatial model has been used previously to model Herschel-resolved debris disks (e.g. Kennedy et al., 2012, 2013), and generates a high-resolution image of an azimuthally symmetric dust distribution with a small opening angle, as viewed from a specific direction. These models are then convolved with a point spread function model (observations of calibration star Tau) for comparison with the observed disk (Figure 6). The best-fitting model is found using by-eye approximation followed by least-squares minimization. As the entire multi-dimensional parameter space was not searched, the model presented is not necessarily unique, but provides a good indication of the probable disk structure. By checking the fit of different parameter combinations, we were able to get a good feel for how well-constrained the different parameters are and feel we have converged on a good model, within observational errors.
Due to the limited resolution of the images of Ceti, our model disk is a simple power-law in radial surface density (), which extends from to . This approach allows us to test whether or not the disk is radially extended. We use the simple assumption of a blackbody temperature law (, with being the disk temperature at 1 AU and radius in AU). Given that the disk temperature and surface density are degenerate without multiple well-resolved images, neither nor is well constrained. Physically, should be greater than about 230 K, because this is the temperature that grains with blackbody absorption and emission would have at 1 AU from Ceti. Temperatures up to factors of 3-4 greater are possible if the emission comes primarily from small grains, which emit inefficiently at long wavelengths and have higher temperatures to maintain energy equilibrium (e.g. Booth et al., 2013).
The model also includes a background source to the east that is only visible in the 160 m image. This does not significantly affect any of the parameters of the fit, but does allow us to better estimate the 250 m disk flux.
To model the Herschel images of Ceti, we initially tried a simple narrow ring. We found that this model failed to reproduce the observed images and conclude that the emission is radially extended. We therefore allowed and , and , the surface density power-law exponent, to vary independently. The low surface brightness of the disk in the Herschel images limits our ability to constrain the disk model parameters. Primarily, a degeneracy between disk surface density profile, the inner edge location, and the dust temperature allowed a range of models to reproduce the data. For a model, the disk is centrally concentrated and the best fitting inner edge is at about 10 AU with K. For a flat profile () the disk is less centrally concentrated and the inner edge is closer, around 2 AU (and is the same). For a radially increasing surface density (), the inner edge is around 3 AU and K. We return to this issue when considering SED models that make assumptions about grain properties in section 3.1.2 below.
The low surface brightness of the disk in the Herschel images limits our ability to constrain the disk model parameters. However, despite the degeneracies between , and , the best fitting models have similar inner radii of 2-3 AU (with large uncertainty, acceptable fits range from roughly 1-10 AU), and outer radii of 55 AU 5 AU. The disk may however extend to larger radii at a level undetectable by these observations. The disk geometry is constant across different models, with a disk inclination (i.e., from face-on) of 35∘ and position angle (East of North) of 105∘. Using brute-force grid calculations we estimate that the 1 uncertainty in these angles is about 10∘.
Figure 6 shows an example of a well fitting model with . Some residual structure is seen near the star at 70 m, and very similar structure is seen for different models. We suspect it arises due to the brightness of Ceti itself; the high signal-to-noise ratio of the stellar emission means that the PSF model used ( Tau) must be a very good match to the PSF for the Ceti observation. Kennedy et al. (2012) showed that the PACS 70 m PSF varies at the 10% level, which is a probable reason for the non-zero residuals near the star.
3.1.2 SED-Based Disk Model
Though in general the shape of a modified blackbody provides a good approximation to the emission profile of dust grains, it cannot tell us much about the properties of the grains. A better approximation of the dust grains can be found by taking into account their optical properties and the size distribution of dust in the disk. Accordingly, we follow the model described in Wyatt & Dent (2002) and similarly assume non-porous, amorphous silicate grains with an organic refractory mantle. The silicate core makes up 1/3 of the grains, which have an amorphous carbon coating. Grains are assumed to be spherical, and absorption efficiencies are calculated using Mie theory, Rayleigh-Gans theory, or geometric optics in the appropriate limits (see also Li & Greenberg, 1997). We assume these grains follow a size distribution power law of from a minimum grain size, , to an arbitrarily large grain size (Dohnanyi, 1969). Many of the properties of the grain model are degenerate. For instance, a shallower size distribution has the same effect as increasing the minimum grain size, and the exact composition of the grains cannot easily be determined without spectral features. For this reason, we only varied and the inner edge of the disk (since this was poorly constrained from the image-based modelling). We also tested two values of the surface density power law, equal to 0 and 1 since this quantity is also poorly constrained from the image-based modelling.
No SED model can be found that fits both the SCUBA and PACS 160 m photometry, suggesting that a separate, cooler disk component may be required to fully explain the sub-mm observations, since a slope that fits both these points is too shallow to even be fit by a perfect blackbody. Further investigation of the multi-epoch SCUBA and SCUBA-2 data is left to Greaves et al. (in prep).
For the following we therefore focus on fitting the model to the PACS data, the SPIRE data and the upper limit from the Spitzer IRS spectral data. We find the best fitting model to have a flat surface density profile (), a minimum grain diameter of m and an inner radius of 6 AU (parameter uncertainties calculated using a cut). The best fit is shown in Figure 7. There is some anti-correlation between the minimum diameter and inner radius such that models with a larger inner radius require a smaller minimum grain size. Models with a rising surface density of can still plausibly fit the photometry with a minimum grain size of 8 m and an inner radius between 1 AU and 17 AU, although this provides a poorer fit to the data.
Unfortunately, these SED models were not very sensitive to different disk inner edges, and the results of this modeling technique, while agreeing with the results of the image-based model, did not provide any stronger constraints on the inner edge of the disk.
3.1.3 Disk Properties Inferred from Both Models
To summarize the findings of both models, Ceti’s disk extends from a radius similar to the inner Solar System (1-10 AU) to just outside the distances inhabited by the main classical Kuiper Belt.
The image-based model’s uncertainty in the inner edge locations arises from the variations in the 70 m beam shape and the resolution limits in both PACS wavelengths. The uncertainty in the inner edge as predicted by the SED-based model can be attributed to the calibration uncertainties in the Spitzer IRS spectrum and a small number of photometric measurements of the excess, while the outer edge uncertainty is mainly due to the low surface brightness in the PACS 160 m image.
We do not give a mass estimate for our dust models, as the uncertainties due to assumptions about the grains give disk masses that vary by orders of magnitude. The most accurate disk masses come from submillimeter fluxes, temperatures, and opacities, thus we leave calculation of the disk mass in the Ceti system to the forthcoming SCUBA and SCUBA-2 analysis (Greaves et al. in prep.)
In the next section, we will use the (limited) constraints imposed by the disk to investigate the validity of a proposed planetary system.
4 Ceti’s Possible Planetary System
Though previous studies failed to find planets around Ceti using the radial velocity technique (e.g. Pepe et al., 2011), Tuomi et al. (2013) report evidence for a five planet system after extensive modelling and Bayesian statistical analysis using combined radial velocity data from three different planet surveys.
The most likely system found by Tuomi et al. consists of five super-Earths, ranging in mass () from 2.0-6.6 , with small-to-moderate eccentricities (0-0.2), in a tightly-packed configuration with semimajor axes ranging from 0.105-1.35 AU. Tuomi et al. (2013) show that their system is stable based on Lagrange stability thresholds, but do not perform detailed numerical integrations.
We note that the periodic RV signals detected by Tuomi et al. (2013) were only interpreted as planets by these authors with caution; it is possible that the signals are from another source, such as stellar activity or instrumental bias, although there is no direct evidence in favour of these alternative interpretations either. In this section we investigate the stability of the proposed planet system, and assuming that the planetary system is real, use it to place constraints on the inner disk edge using dynamical simulations.
4.1 System Inclination
Since the planets’ existence was surmised using RV data, we have no direct information on the inclination of the planetary system. In addition to the coplanar precedent of our own Solar System, several recent studies find evidence that star-planet-disk systems without hot Jupiters should be well-aligned. For example, Kennedy et al. (2013) discuss the HD 82943 system, where the star, planets, and debris disk have well-measured inclinations, and are all coplanar within 10∘. Furthermore, Greaves et al. (2014) find that, out of 11 systems with Herschel-resolved disks and well-measured stellar inclinations, all are consistent with being coplanar. Watson et al. (2011) measure the rotational axes of stars with resolved debris disks, and reach the same conclusion. Studies of Kepler-discovered multiplanet systems (Sanchis-Ojeda et al., 2012; Hirano et al., 2012; Albrecht et al., 2013; Chaplin et al., 2013) also have found that the orbital planes of the planetary systems tend to be well-aligned with the equators of the host stars. We believe these studies provide ample evidence that compact, low-mass planetary systems like Ceti are usually well-aligned systems.
| planet | |||
|---|---|---|---|
| () | (AU) | ||
| a | 4.0 | 0.105 | 0.16 |
| b | 6.2 | 0.195 | 0.03 |
| c | 7.2 | 0.374 | 0.08 |
| d | 8.6 | 0.552 | 0.05 |
| e | 13.2 | 1.35 | 0.03 |
| a Planet masses are given assuming | |||
Greaves et al. (2004) used the low rotational velocity measured by Saar & Osten (1997) as evidence that we are viewing Ceti within 40∘ of pole-on, which was inconsistent with their measurements of the disk inclination. However, at the SCUBA resolution and wavelength, background confusion made it difficult to measure the disk inclination. The analysis of the Herschel images presented here has made it clear that the disk is close to face-on, consistent with being aligned with the equatorial plane of Ceti.
Assuming the best-fitting inclination for the disk (30∘) equals the inclination for Ceti and its planetary system, the best-fit values of given in Tuomi et al. (2013) should be doubled. As found in Section 4.2.1 below, such masses still allow a dynamically stable configuration for the planets. Table 4 gives the masses, semimajor axes, and eccentricities for this system. We note that, however, this is only one possible configuration of planets that satisfies both the requirement of long-term stability and the Bayesian analysis of Tuomi et al. (2013).
4.2 Dynamical Simulations
We perform numerical simulations using swift-rmvs4 (Levison & Duncan, 1994), with a timestep of 0.002 years (0.73 days). This allows 15 timesteps per orbit for accurate calculation of the positions of all five planets, including the innermost planet, with an orbital period of only 14 days. All of our simulations were carried out on the Canadian Advanced Network for Astronomical Research (CANFAR; Gaudet et al., 2009).
For our dynamical simulations, we ignore the mass of the disk since the largest reasonable estimate of Ceti’s disk mass is about 10% of the mass of the outermost planet (; Greaves et al., 2004). While Moore & Quillen (2013) find that a disk mass this high relative to the planet masses can affect the dynamical stability lifetime of a planetary system, the system they modelled (HR 8799) extends to much larger separations from the star than that of Ceti. HR 8799b, the outermost planet in the system, has a semimajor axis of 68 AU (Marois et al., 2008) and the planetesimal disk extends from 100-310 AU (Matthews et al., 2014). If the HR 8799 system is scaled down so that the orbit of HR 8799b matches the outermost planet in the Ceti system, HR 8799’s entire debris disk would extend to only 3-6 AU, while in reality, Ceti’s disk mass is actually spread out to 55 AU. Given the small semimajor axes of all the planets in the Ceti system, we therefore believe the contribution of the disk mass to the stability of the system is negligible.
We performed two types of simulations: planetary system stability and disk orbit stability. Planet stability simulations were run for 100 Myr, corresponding to over two billion orbits of the innermost planet, while disk simulations were run for 10 Myr with many massless test particles included in addition to the five planets to diagnose stable orbits for small bodies. Planetary systems were deemed unstable if any planet’s semimajor axis changes by over the course of an integration. The same change in semimajor axis is used to diagnose stable versus unstable disk particle orbits.
Given the infinite range of possible starting conditions for this multiplanet system, we chose a few representative possibilities and investigated the stability of those before proceeding to disk simulations. We found the highest eccentricities allowed by the statistical analysis of Tuomi et al. (2013) yielded unstable planetary systems. The more moderate (best-fit) eccentricities and very low eccentricities result in planetary systems stable on timescales of 100 Myr, even when planet masses are increased by a factor of 1/, up to inclinations out of the sky plane as low as 5∘, nearly perpendicular to our line-of-sight.
4.2.1 Disk Simulations
After confirming that the planetary system is stable over a reasonable range of possible orbital configurations, we use one stable planetary system (Table 4) as part of another set of simulations. Here we quantify the stability of small body orbits near planets in order to find where the debris disk would be stable over long timescales. The small bodies are represented by massless test particles in these simulations.
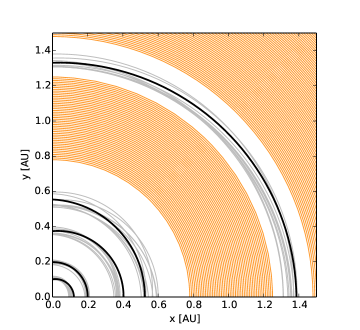
The fairly small planets of the Ceti system are on close-to-circular orbits and so they do not clear large annuli. Using just the best-fit parameters of the five planets from Tuomi et al. (2013) results in stable disk particle orbits all the way down to 0.1 AU separation from the orbit of the outermost planet (at 1.35 AU). Figure 8 shows that stable disk orbits also exist in the gap between the outermost two planets.
4.2.2 Simulations with an Additional Planet
One way to constrain the inner disk edge at greater distances from the star is to assume that there is an additional planet in the system further from the host star and to estimate the properties of this hypothetical companion based on the available data. Although this scenario was not specifically tested in the work of Tuomi et al. (2013), the radial velocity data sets could not be expected to be very sensitive to planets with masses of roughly that of Neptune on longer period (5 yr) orbits.
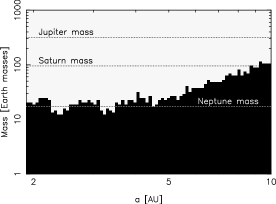
In Figure 9, we show the estimated detection threshold of additional planets orbiting the star based on the radial velocity data analysis of Tuomi et al. (2013). The area in the mass-period space where additional planet candidates are ruled out (white area) has been estimated by assuming there is an additional planet with a semi-major axis in excess of those of the previously proposed candidates. This estimation was performed by drawing a sample from the posterior probability density of the parameters of the sixth planet in a model that extends in the semi-major axis space from a minimum of 1.8 AU to a maximum value that we have chosen to be 10 AU, the outermost bound of the inner disk edge consistent with the Herschel data. The computations are performed as in Tuomi et al. (2014), and we have assumed that the planetary eccentricity has a prior probability density that penalizes high eccentricities as they approach unity, because the eccentricities of low-mass planets appear to follow such a distribution (Tuomi & Anglada-Escudé, 2013).
It is worth noting that Jupiter-mass planets within 10 AU would have already been detected by previous RV studies (e.g. Pepe et al. 2011, see also analysis by Cumming et al. 2008). Using the analysis described above, Figure 9 shows that we can push to lower planetary masses, ruling out the existence of planets of Neptune-mass or larger within orbital distances of 5 AU, and excluding the possibility that Saturn-mass or larger planets exist in the system inside 10 AU.
We ran simulations with a sixth planet having twice Neptune’s mass on circular orbits at 5-10 AU, and find that these systems are stable on long timescales (100 Myr).
While the disk could be cleared to large semimajor axes by a more eccentric outer planet orbit, this situation would destabilize the inner five planets within millions of years at most. Using a circular orbit for the outermost planet constrains the stable disk particle orbits to just outside a few times the planet’s Hill radius, as expected. While it is exciting to consider the possibility of additional planets in the system, an additional planet with less than a Saturn mass (outside 5 AU) or less than a Neptune mass (inside 5 AU) would constrain the inner edge of the disk to larger distances from the star. With the large uncertainties on inner edge of the disk, however, this additional layer of complexity is unwarranted. Future high-resolution images of the inner edge of Ceti’s disk will provide much-needed constraints on the actual location of the inner disk edge, and continued radial velocity observations may detect additional, more distant planets.
5 Discussion
5.1 Properties of the Ceti Disk
Herschel observations have confirmed the existence of the resolved debris disk originally imaged by Greaves et al. (2004), though the inclination we measure is 30∘ from face-on, which is different than the nearly edge-on alignment first reported from analysis of the SCUBA images. Modelling the disk gives some weak constraints on the extent of the disk, which extends roughly 2-55 AU from Ceti. There is no significant structure observed in the disk, and using a realistic dust grain spectrum (as opposed to blackbody) provided only moderately better constraints on the inner edge of the disk. Additional photometric or spectral data at far-IR wavelengths would be valuable for constraining dust grain properties in this system.
5.2 Disk Inner Edge
The current data do not constrain the inner disk edge very strongly. While an inner edge at 2-3 AU is consistent with both the SED- and image-based models, neither can formally rule out a disk extending as close to the star as 1 AU, well into the realm which may be populated by planets, or as far from the star as 10 AU, allowing dynamical room for one or more additional planets.
We note that interferometric near-IR measurements have been made of the Ceti system using the CHARA array (di Folco et al., 2007). They found they could reproduce the near-IR excess using a population of small (1 m) dust grains extending from the limits of their observation field to extremely close to the star (3 AU to 0.1 AU), which overlaps with the region where the planets may exist. However, the mass in dust grains is extremely small (10-9 ), comparable to the mass of zodiacal (asteroidal) dust in our Solar System (Hahn et al., 2002). Models show that dust produced by collisions at larger distances can inspiral (due to Poynting-Robertson drag) past planets in the inner solar system with little disruption other than longer time spent inside planetary mean-motion resonances (Nesvorný et al., 2011). For this reason, the presence of this tenuous dust in the inner portions of the Ceti system does not rule out the planets.
The exquisite resolving power of ALMA should be able to image the inner edge of the main dust belt easily, and that will clarify which of three possibilities is true:
-
1)
The disk extends well into the planetary regime (1.35 AU), which would be serious evidence against the planets proposed by Tuomi et al. (2013).
-
2)
The disk edge is close to the orbit of the outermost planet (1.35 AU and 2.0 AU) and the proposed five planet system is enough to constrain the disk edge.
-
3)
The disk edge ends significantly far away from the outermost planet (2.0 AU), in which case another process must be invoked to explain the edge (e.g., another planet, or possibly collisional processes).
ALMA will also be more sensitive to larger dust grains that more closely trace the positions of the parent bodies that are collisionally grinding to make the smaller dust grains observed at mid- and far-IR wavelengths. The high-resolution of ALMA will also illuminate whether the dust in the Ceti debris annulus is produced by a narrow “birth ring” as has been observed in other debris disk systems (e.g. AU Mic; Wilner et al., 2012; MacGregor et al., 2013).
5.3 The Disk-Planet Relationship
If confirmed, Ceti’s low-mass multiplanet system would fit with the results of simulations by Raymond et al. (2011) and extend the trend observed by Wyatt et al. (2012): the presence of exclusively low-mass planetary systems () and far-IR excess (70 m) is strongly correlated for mature host stars.
These models hint that systems with planets of mass are inherently unstable in their early days (e.g. Raymond et al., 2012). We know from the structure of the Kuiper Belt that the four giant planets in our own Solar System have migrated, and that a much more massive primordial Kuiper Belt is required to fuel this migration (e.g. Gomes et al., 2005). It may be that the debris disk around solar analogue Ceti is brighter and more massive than the Kuiper Belt because there are no giant planets in the system to migrate and disrupt the primordial planetesimal disk.
Unfortunately, the Herschel images do not provide very tight constraints on the presence of gaps or clumps in the disk that may be due to perturbations by massive planets.
Resonant and secular perturbations by a planet on a disk can produce telltale clumps and gaps in the dust disk, but the grain sizes that are most visible at 70 m and 160 m will be smeared out by radiation forces relative to the larger (millimeter-sized) dust grains and parent planetesimals, making these clumps much harder or even impossible to detect (Wyatt, 2006). In addition, predicting clumps that may be present in the Ceti disk via numerical modelling of secular perturbations and mean-motion resonances in the planetesimal disk by the planets is not currently feasible. These perturbations are quite sensitive to the masses and exact orbits of the planets, which have very large uncertainties or are even completely unconstrained, as in the case of the angular orbital elements.
As shown in Section 3.1.1, the Herschel images are best reproduced using a smooth disk model, with no structure. However, because of the large beam size, this is not a very strong constraint on the smoothness of the disk. A several AU-wide gap could easily be missed due to the Herschel resolution. In order for a clump in the disk to be detectable, it would have to contain more than 10% of the total disk flux, based the sensitivities quoted in Table 2.
In order to rule out clumps or gaps in the disk with any degree of certainty, high-resolution, long wavelength observations are required in order to probe the distribution of large dust grains that are relatively unaffected by radiation forces. Within the next few months, ALMA observations will be used to probe the inner portions of the Ceti disk and provide some constraints both on the location of the inner edge of the disk and on the smoothness of the disk, which in turn will provide limits on the mass and orbital properties of undetected massive planets in the system, independent of the RV data.
6 Summary and Conclusions
Ceti hosts a bright debris disk that has been resolved by Herschel. The disk is uniform and symmetric, with a most likely inner edge at 2-3 AU (though inner edges 1-10 AU are not ruled out by the Herschel data) and an outer edge at 55 10 AU. It is inclined from face-on by and can be fit by a surface density distribution of dust that increases linearly with distance from the star.
The proposed five planet system is not ruled out by the disk model, and our dynamical simulations show that this system is stable for moderate planetary eccentricities. If the outermost planet is what constrains the inner edge of the disk, the inner edge should be at 1.5 AU. If there is an additional, as-yet undetected planet (which is possible if its mass is below that of Neptune), it could be constraining the inner disk radius farther away from the star.
It appears that there are no Jupiter-mass planets inside 10 AU in the Ceti system, so the comparison to our Solar System may not be so appropriate. If the proposed planets are real, the Ceti system is composed of small rocky planets close to the star with a disk extending from the inner solar system out to Kuiper Belt-like distances from the star, perhaps resembling our Solar System if the giant planets had failed to form and the primordial planetesmial disk had not been disrupted by planet migration. Future high resolution observations are required to constrain the edges of the disk, and to confirm the planetary system.
Acknowledgements
The authors thank an anonymous referee for providing helpful comments on this paper. S.M.L. and B.C.M. acknowledge an NSERC Discovery Accelerator Supplement which funded this work. This work was also supported by the European Union through ERC grant number 279973 (G.M.K.) M.B. acknowledges support from a FONDECYT Postdoctral Fellowship, project no. 3140479.
References
- Albrecht et al. (2013) Albrecht S., Winn J. N., Marcy G. W., Howard A. W., Isaacson H., Johnson J. A., 2013, ApJ, 771, 11
- Aumann (1985) Aumann H. H., 1985, PASP, 97, 885
- Bessel (1990) Bessel M. S., 1990, A&AS, 83, 357
- Booth et al. (2013) Booth M. et al., 2013, MNRAS, 428, 1263
- Chaplin et al. (2013) Chaplin W. J. et al., 2013, ApJ, 766, 101
- Chen et al. (2006) Chen C. H. et al., 2006, ApJS, 166, 351
- Cumming et al. (2008) Cumming, A., et al. 2008, PASP, 120, 531
- Cutri et al. (2003) Cutri R. M. et al., 2003, 2MASS All Sky Catalog of point sources.
- di Folco et al. (2007) di Folco E. et al., 2007, A&A, 475, 243
- Dohnanyi (1969) Dohnanyi J. S., 1969, J. Geophys. Res., 74, 2531
- Gaudet et al. (2009) Gaudet S., Dowler P., Goliath S., Hill N., Kavelaars J. J., Peddle M., Pritchet C., Schade D., 2009, in D.A. Bohlender, D. Durand, P. Dowler, eds, Astronomical Data Analysis Software and Systems XVIII. Astronomical Society of the Pacific Conference Series, Vol. 411, p. 185
- Gomes et al. (2005) Gomes R., Levison H. F., Tsiganis K., Morbidelli A., 2005, Nature, 435, 466
- Greaves et al. (2004) Greaves J. S., Wyatt M. C., Holland W. S., Dent W. R. F., 2004, MNRAS, 351, L54
- Greaves et al. (2014) Greaves J. S. et al., 2014, MNRAS, 438, L31
- Griffin et al. (2010) Griffin M. J. et al., 2010, A&A, 518, L3
- Habing et al. (2001) Habing H. J. et al., 2001, A&A, 365, 545
- Hahn et al. (2002) Hahn J. M., Zook H. A., Cooper B., Sunkara B., 2002, Icarus, 158, 360
- Hauck & Mermilliod (1998) Hauck B., Mermilliod M., 1998, A&AS, 129, 431
- Hirano et al. (2012) Hirano T. et al., 2012, ApJ, 759, L36
- Høg et al. (2000) Høg E. et al., 2000, A&A, 355, L27
- Holland et al. (1999) Holland W. S. et al., 1999, MNRAS, 303, 659
- Holmes et al. (2003) Holmes E. K., Butner H. M., Fajardo-Acosta S. B., Rebull L. M., 2003, AJ, 125, 3334
- Ishihara et al. (2010) Ishihara D. et al., 2010, A&A, 514, A1
- Kennedy et al. (2012) Kennedy G. M., Wyatt M. C., Sibthorpe B., Phillips N. M., Matthews B. C., Greaves J. S., 2012, MNRAS, 426, 2115
- Kennedy et al. (2013) Kennedy G. M., Wyatt M. C., Bryden G., Wittenmyer R., Sibthorpe B., 2013, MNRAS, 436, 898
- Lagrange et al. (2010) Lagrange A. M. et al., 2010, Science, 329, 57
- Levison & Duncan (1994) Levison H. F., Duncan M. J., 1994, Icarus, 108, 18
- Li & Greenberg (1997) Li A., Greenberg J. M., 1997, A&A, 323, 566
- MacGregor et al. (2013) MacGregor M. A. et al., 2013, ApJ, 762, L21
- Mamajek & Hillenbrand (2008) Mamajek E. E., Hillenbrand L. A., 2008, ApJ, 687, 1264
- Marois et al. (2008) Marois C., Macintosh B., Barman T., Zuckerman B., Song I., Patience J., Lafrenière D., Doyon R., 2008, Science, 322, 1348
- Matthews et al. (2014) Matthews B., Kennedy G., Sibthorpe B., Booth M., Wyatt M., Broekhoven-Fiene H., Macintosh B., Marois C., 2014, ApJ, 780, 97
- Mermilliod (2006) Mermilliod J. C., 2006, VizieR Online Data Catalog, 2168, 0
- Moore & Quillen (2013) Moore A., Quillen A. C., 2013, MNRAS, 430, 320
- Moshir (1990) Moshir M. e., 1990, in IRAS Faint Source Catalogue, version 2.0 (1990). p. 0
- Mouillet et al. (1997) Mouillet D., Larwood J. D., Papaloizou J. C. B., Lagrange A. M., 1997, MNRAS, 292, 896
- Müller et al. (2011) Müller T., Nielbock M., Balog Z., Klaas U., Vilenius E., 2011, PACS Observers Manual, 708, 1728
- Nesvorný et al. (2011) Nesvorný D., Janches D., Vokrouhlický D., Pokorný P., Bottke W. F., Jenniskens P., 2011, ApJ, 743, 129
- Ott (2010) Ott S., 2010, in Y. Mizumoto, K.I. Morita, M. Ohishi, eds, Astronomical Data Analysis Software and Systems XIX. Astronomical Society of the Pacific Conference Series, Vol. 434, p. 139
- Pepe et al. (2011) Pepe F. et al., 2011, A&A, 534, A58
- Perryman & ESA (1997) Perryman M. A. C., ESA, eds, 1997, The HIPPARCOS and TYCHO catalogues. Astrometric and photometric star catalogues derived from the ESA HIPPARCOS Space Astrometry Mission, ESA Special Publication, Vol. 1200
- Pilbratt et al. (2010) Pilbratt G. L. et al., 2010, A&A, 518, L1
- Poglitsch et al. (2010) Poglitsch A. et al., 2010, A&A, 518, L2
- Raymond et al. (2011) Raymond S. N. et al., 2011, A&A, 530, A62
- Raymond et al. (2012) Raymond S. N. et al., 2012, ArXiv e-prints
- Saar & Osten (1997) Saar S. H., Osten R. A., 1997, MNRAS, 284, 803
- Sanchis-Ojeda et al. (2012) Sanchis-Ojeda R. et al., 2012, Nature, 487, 449
- Skrutskie et al. (2006) Skrutskie M. F. et al., 2006, AJ, 131, 1163
- Spiegel & Burrows (2012) Spiegel D. S., Burrows A., 2012, ApJ, 745, 174
- Swinyard et al. (2010) Swinyard B. M. et al., 2010, A&A, 518, L4
- Tuomi & Anglada-Escudé (2013) Tuomi M., Anglada-Escudé G., 2013, A&A, 556, A111
- Tuomi et al. (2014) Tuomi M., Jones H. R. A., Barnes J. R., Anglada-Escudé G., Jenkins J. S., 2014, ArXiv e-prints
- Tuomi et al. (2013) Tuomi M. et al., 2013, A&A, 551, A79
- van Leeuwen (2007) van Leeuwen F., 2007, A&A, 474, 653
- Vandenbussche et al. (2010) Vandenbussche B. et al., 2010, A&A, 518, L133
- Watson et al. (2011) Watson C. A., Littlefair S. P., Diamond C., Collier Cameron A., Fitzsimmons A., Simpson E., Moulds V., Pollacco D., 2011, MNRAS, 413, L71
- Wilner et al. (2012) Wilner D. J., Andrews S. M., MacGregor M. A., Hughes A. M., 2012, ApJ, 749, L27
- Wyatt & Dent (2002) Wyatt M. C., Dent W. R. F., 2002, MNRAS, 334, 589
- Wyatt (2006) Wyatt, M. C. 2006, ApJ, 639, 1153
- Wyatt et al. (2012) Wyatt M. C. et al., 2012, MNRAS, 424, 1206