Molecular Dependence of the Large Seebeck Effect in -type Organic Conductors
Abstract
We study the Seebeck effect in the -type organic conductors, -(EDO-S,S-DMEDT-TTF)2(AuBr2)1+y and -(P-S,S-DMEDT-TTF)2(AuBr2)1+y, where EDO-S,S-DMEDT-TTF and P-S,S-DMEDT-TTF are abbreviated as OOSS and NNSS, respectively, both experimentally and theoretically. Theoretically in particular, we perform first-principles band calculation for the two materials and construct a two-orbital model, on the basis of which we calculate the Seebeck coefficient. We show that the calculated temperature dependence of the Seebeck coefficient is semi-quantitatively consistent with the experimental observation. In both materials, the absolute value of the Seebeck coefficient is maximum at a certain temperature, and this temperature is lower for NNSS than for OOSS. From a band structure viewpoint, we find that this can be traced back to the narrowness of the band gap between the upper and the lower pudding-mold type bands. On the other hand, the Seebeck coefficient of NNSS in the low temperature regime steeply increases with increasing temperature, which is due to the narrowness of the upper band. These differences in thermoelectric properties demonstrate the effectiveness of controlling the band structure through molecular modification.
1 Introduction
The electronic band structure plays an important role in the transport properties of materials. For the Seebeck effect in particular, the electron-hole asymmetry in the band structure is an important factor, as has been shown in previous studies [1, 2, 3, 4, 5, 6, 7, 8], so that tuning the band structure into ideal forms can be a promising way of obtaining good thermoelectric properties. From this viewpoint, organic molecular materials are particularly interesting in the sense that the overlap between the neighboring molecular orbitals can be changed by either varying the lattice structure or modifying the molecules themselves, which in turn should affect the band structure. In this kind of approach, first-principles band calculations are expected to be effective since such studies can guide us toward better band structures for thermoelectricity.
In the present paper, we focus on -type organic conductors, in which a large Seebeck effect has been found [9, 10]. In fact, in our previous paper [11], we studied the origin of the large Seebeck effect observed in -(EDO-S,S-DMEDT-TTF)2(AuBr2)1+y, and showed that the pudding-mold type band [4], introduced to understand the large Seebeck coefficient of NaxCoO2 [12], plays an important role. There, it was also revealed that the suppression of the Seebeck coefficient at high temperature is due to the existence of a band sitting right below the band that intersects the Fermi level, separated by a small gap. The temperature dependence of the Seebeck coefficient may depend on the gap, which in turn may be tuned by the variation of the donor molecule.
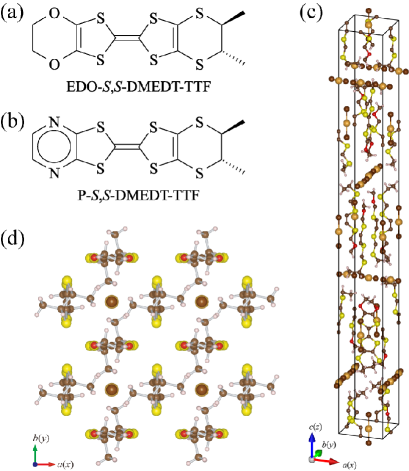
Here we investigate such a possibility by studying two materials based on different molecules, i.e., -(EDO-S,S-DMEDT-TTF)2(AuBr2)1+y and -(P-S,S-DMEDT-TTF)2(AuBr2)1+y, where EDO-S,S-DMEDT-TTF is an abbreviation of ethylenedioxy-S,S-dimethyl(ethylenedithio)tetrathiafulvalene shown in Fig. 1(a), and P-S,S-DMEDT-TTF is for pyrazino-S,S-dimethyl(ethylenedithio)tetrathiafulvalene shown in Fig. 1(b). They will be abbreviated as OOSS and NNSS, respectively, hereafter. The side view of the crystal structure of -(AuBr2)1+y, where is the OOSS or NNSS donor molecule, is shown in Fig. 1(c). The content of the anion AuBr is randomly distributed between the conducting layers of -AuBr2 shown in Fig. 1(d), where the horizontal donor molecules are related to the vertical one turning one upside down.
We study the above two materials both experimentally and theoretically, and analyze the commonalities and differences between them. Theoretically, we particularly compare the electronic band structure and calculate the Seebeck coefficient using the Boltzmann’s equation approach. The calculated results are semi-quantitatively in agreement with the experimental results. The present study shows the possibility of controlling thermoelectric properties by tuning the band structure through the modification of molecules in organic conductors.
2 Experimental Result for the Seebeck Coefficient
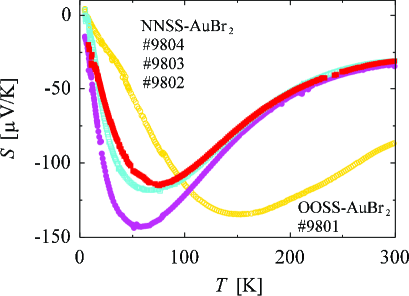
The thermoelectric powers of -(NNSS)2(AuBr2)1+y and -(OOSS)2(AuBr2)1+y along their 2D layer () were measured against Cu between 4.2 K and 300 K. The maximum temperature difference between two contacts of each sample and two Cu leads was typically about 0.5 K below 20 K and about 1.5 K below 300 K. The temperature of one of the contacts and the temperature difference were determined by combining two Chromel-Au+0.07%Fe thermocouples and a resistance thermometer while the temperature difference was changed in a stepwise manner. Seebeck coefficient was determined as the slope of a line fit to a plot of vs . Finally, the absolute value of of the sample was obtained by adding that of Cu at each temperature. The experimental methods are described in detail in literatures [13, 14].
In Fig. 2, we show the experimental results for the temperature dependence of of -(NNSS)2(AuBr2)1+y and -(OOSS)2(AuBr2)1+y. We measured of -(NNSS)2(AuBr2)1+y for three samples (#9802, #9803, and #9804) since its showed a larger sample dependence below 200 K. This is probably attributed to the change in the composition from sample to sample. In both materials, the absolute value of the Seebeck coefficient first increases with increasing temperature, reaches a maximum at a certain temperature, and then decreases at higher temperature. The temperature at which is maximized is significantly lower for the NNSS salt than for the OOSS one. The maximum value of itself is about the same between the two materials.
3 Theoretical Method
We perform first-principles band structure calculation using all-electron full potential linearized augmented plane-wave (LAPW) + local orbitals (lo) method to solve the Kohn-Sham equation using density functional theory (DFT) within the framework of WIEN2k [15]. The exchange correlation potential is calculated using the generalized gradient approximation (GGA). In the actual material, the content of the anion is randomly distributed between the conducting layers of the -AuBr2, as shown in Fig. 1(c). Here, we ignore this effect for simplicity in the band structure calculation, but adopt the experimentally determined lattice parameters of -(AuBr2)1+y.
The single-particle wave functions in the interstitial region are expanded by plane waves with a cut-off of , where denotes the smallest muffin tin radius and is the maximum value of the wave vector in the plane wave expansion. In -(OOSS)2AuBr2, the muffin-tin radii are assumed to be 2.38, 2.11, 1.61, 1.27, 1.18, and 0.64 atomic units (au) for Au, Br, S, O, C, and H, respectively. In -(NNSS)2AuBr2, the muffin-tin radii are assumed to be 2.38, 2.11, 1.62, 1.24, 1.12, and 0.60 au for Au, Br, S, N, C, and H, respectively. is taken as 4.7, and the plane wave cutoff energy is 298.8 eV for -(OOSS)2AuBr2. In -(NNSS)2AuBr2, is taken as 5.0, and the plane wave cutoff energy is 340.0 eV. The wave functions in the muffin tin spheres are expanded up to , while the charge density was Fourier expanded up to . Calculations are performed using 888 -points in the irreducible Brillouin zone.
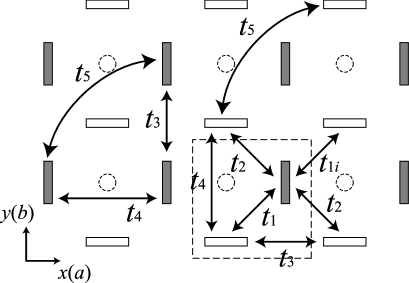
Since there are two donor molecules having different orientations, as shown in Fig. 1(d), we obtain the tight binding model with two sites in a unit cell by fitting the first-principles band structure. The tight binding model shown in Fig. 3 is
| (1) |
where and are indices of the unit cells, and are indices of the molecules (=sites) in a unit cell, denotes the creation operator of electrons with spin at the molecule in the -th unit cell, and is the transfer energy between sites and . Here, holds by symmetry for the actual -AuBr2, but we assign different notations to consider the effect of tuning the band structure through chemical modification later. Eq. (1) can be Fourier transformed as
| (2) |
where are
| (3) | |||||
| (4) | |||||
| (5) |
and is satisfied.
Using the Boltzmann’s equation approach, the Seebeck coefficient is given as
| (6) |
where is the electron charge and is the temperature. and are tensors given by
| (7) |
where is the quasiparticle lifetime, is the band dispersion, is the group velocity, is the Fermi distribution function, and is the chemical potential. Although the quasiparticle lifetime is generally a function of k, in the present study, we take it as a constant, so that it cancels out between the denominator and the numerator in Eq. (6). In the actual calculation, we use the band dispersion of the obtained tight binding model.
4 Calculation Results
4.1 Band structure
The calculated band structures of -(OOSS)2AuBr2 and -(NNSS)2AuBr2 are shown in Fig. 4. The two bands near the Fermi level are isolated from the other bands, so that extracting them using a tight binding model can be considered as appropriate.
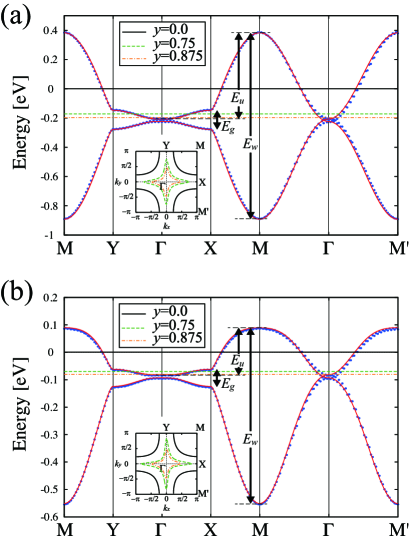
The upper and lower bands near the Fermi level are separated by a small band gap. Although the band-width of the upper band is comparable to that of the lower band in -(OOSS)2AuBr2, the upper band is narrower than the lower band in -(NNSS)2AuBr2. The total band-width from the top of the upper band to the bottom of the lower band () is estimated as 1.28 eV for -(OOSS)2AuBr2, which is larger than that of -(NNSS)2AuBr2, 0.65 eV. The upper band width () is estimated as 0.59 eV for -(OOSS)2AuBr2, which is approximately three times larger than that of -(NNSS)2AuBr2, 0.17 eV. As for the maximum band gap between the bottom of the upper band and the top of the lower band (), it is estimated as 0.13 eV for -(OOSS)2AuBr2, which is larger than that for -(NNSS)2AuBr2, estimated as 0.06 eV.
Note that the first-principles calculation results of the bands near the Fermi level are basically similar to the result of the extended Hckel calculation method, but the band gap between the bottom of the upper band and the top of the lower band is somewhat dispersive compared with that of the extended Hckel result [16].
The red solid curves in Fig. 4 indicate the band structure of the tight binding model (Fig. 3) fit to the first-principles band. We list the transfer and important energies in Table 1. We can see that the original first-principles band structures are well reproduced by adopting these transfer energies.
| [eV] | OOSS | NNSS |
|---|---|---|
| 0.1616 | 0.0817 | |
| -0.1573 | -0.0787 | |
| -0.0114 | 0.0258 | |
| 0.0213 | 0.0101 | |
| -0.0028 | -0.0083 | |
| 1.28 | 0.65 | |
| 0.59 | 0.17 | |
| 0.13 | 0.06 |
4.2 Seebeck coefficient
Figures 5(a) and 5(b) show the calculated Seebeck coefficient for -(OOSS)2(AuBr2)1+y and -(NNSS)2(AuBr2)1+y, respectively, for several band fillings. The relation between the electron band filling and is represented as . Although the precise anion content of the actual materials is not known, it is actually finite so that becomes smaller than 1.5 [17]. In both materials, the maximum absolute value of the Seebeck coefficient becomes larger as is increased ( is decreased), and the temperature at which takes its maximum becomes lower. As for the comparison between the two materials, the temperature at which is maximized is lower for NNSS than for OOSS, which is semi-quantitatively consistent with the experimental observation.
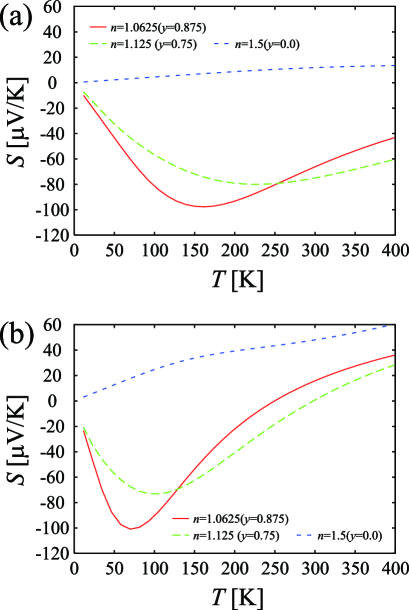
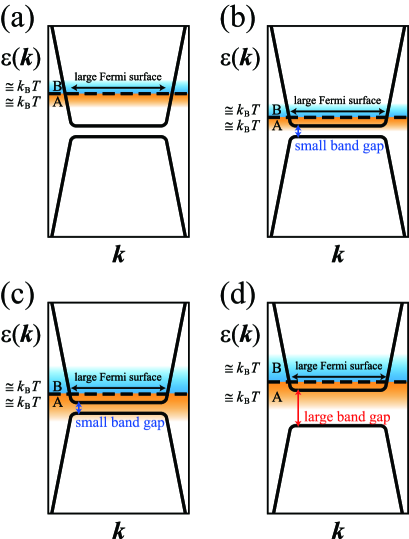
These calculation results can be understood as follows on the basis of the band structure. As mentioned in our previous study[11], the band structure of -type organic conductors can be considered as a combination of two oppositely placed pudding-mold type bands composed of flat and dispersive portions, as schematically shown in Fig. 6. In region A (B), holes (electrons) are excited at finite temperature. When the anion content is small and the band filling is large, the Fermi level is located far above the band bottom of the upper band, so that the typical group velocities of holes and electrons are almost similar as shown in Fig. 6(a). Then the Seebeck coefficient becomes small. When the anion content is increased, as shown in Fig. 6(b), the typical group velocities of holes and electrons are largely different in the pudding-mold type band, which gives a large Seebeck coefficient in the low-temperature regime. On the other hand, as the temperature increases, the holes in the lower band begin to contribute to the Seebeck coefficient, as shown in Fig. 6(c). This suppresses the Seebeck coefficient, so that there is a temperature at which is maximized. This temperature is lower for (i) a larger (smaller band filling), as can be understood from Figs. 6(a)-(c), and also for (ii) materials with a smaller band gap, as can be understood from the comparison between Figs. 6(c) and (d). Since the maximum band gap is smaller for NNSS, the temperature at which is maximized is lower when compared at the same anion content . Although the anion content of the actual materials is not well known, the comparison between the experiment (Fig. 2) and the theoretical calculation (Fig. 5) tells us that (i) the anion content of the actual OOSS and NNSS is close since the experimentally observed maximum values are about the same between the two materials, and (ii) there is a slight variance of the anion content among different samples of NNSS because the maximum is reduced as the temperature at which is maximized becomes higher.
The above argument shows that the absolute value of the Seebeck coefficient takes its maximum at a lower temperature in NNSS because of the narrowness of the band gap in Table 1, which is a flaw of this material from the viewpoint of thermoelectric properties. On the other hand, the steep increase in the Seebeck coefficient for NNSS with increasing at low temperatures, as compared with that for OOSS, is due to the narrowness of the upper band in this material.
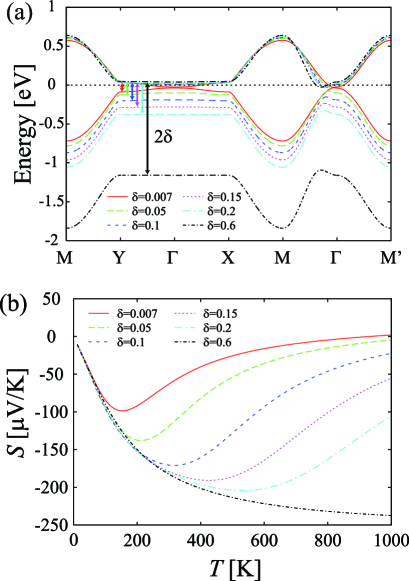
Therefore, if the band gap can be increased without affecting the band width of the upper band, the maximum Seebeck coefficient is expected to be larger. Within the present model, this can be accomplished by modifying the transfer energies as , , , , , and eV. Figure 7(a) shows the variance of the band structure with increasing . Increasing enlarges the band gap (), while keeping the shape and width of each band essentially unchanged. The Seebeck coefficient calculated for this model is shown in Fig. 7(b). As expected, the maximum value of increases as is increased. At present, we do not know a specific way of introducing this kind of modulation in the transfer energies. A finite is naturally introduced by removing the two-fold symmetry of the donor molecule around its long axis. For example, changing the configuration of the two methyl groups from (, ) to (, ) meets the purpose as long as the -type structure is intact. This issue remains as an interesting subject for a future study.
5 Conclusions
We have studied the Seebeck effect in -type organic conductors both experimentally and theoretically. We have shown that the calculated temperature dependence of the Seebeck coefficient is semi-quantitatively consistent with the experimental observation. In both materials, the absolute value of the Seebeck coefficient takes its maximum at a certain temperature, and this temperature is lower for NNSS than for OOSS. On the basis of band structure, this can be traced back to the narrowness of the band gap between the upper and lower pudding-mold type bands. On the other hand, the Seebeck coefficient of NNSS in the low-temperature regime steeply increases with increasing temperature, which is due to the narrowness of the upper band.
These differences in the thermoelectric properties demonstrate the effectiveness of controlling the band structure through molecular modification. If the transfer energies between the molecules can be modified in a manner that affects only the band gap, even better thermoelectric properties are expected.
In the present study, electron correlation effects beyond GGA are not taken into account. On the other hand, it has been known that electron correlation effects can in general affect the transport properties [18, 4]. Specifically for the present material, a weak ferromagnetism has in fact been experimentally suggested in the -type organic conductors of the OOSS molecule [19, 20, 21]. A theoretical work on the single-band Hubbard model of this material has shown that ferromagnetism can appear originating from a flat-bottomed band dispersion and a dilute band filling [22]. Also, recent theoretical work on the spin and charge susceptibilities of the two-band model has shown that both susceptibilities are maximized at the nesting vector such as , which may be related to some uniform ordering state [23]. On the other hand, the fact that the present calculation result of the Seebeck coefficient is semi-quantitatively consistent with the experiment suggests that the above-mentioned electron correlation effects do not play a significant role as far as the Seebeck effect of the -type organic conductors is concerned. Still, the calculated result is somewhat smaller than the experimental result, which may be due to the correlation effects that are not taken into account, or to the constant approximation adopted here.
Acknowledgments
This work was supported by Grants-in-Aid for Scientific Research from the Ministry of Education, Culture, Sports, Science and Technology of Japan, and from the Japan Society for the Promotion of Science (Nos.20110007 and 26610101).
References
- [1] For a general review of the theoretical aspects as well as experimental observations of thermopower, see G. D. Mahan, Solid State Phys. 51, 81 (1997).
- [2] D. J. Singh, Phys. Rev. B 61, 13397 (2000).
- [3] G. B. Wilson-Short, D. J. Singh, M. Fornari, and M. Suewattana, Phys. Rev. B 75, 035121 (2007).
- [4] K. Kuroki and R. Arita, J. Phys. Soc. Jpn. 76, 083707 (2007).
- [5] R. Arita, K. Kuroki, K. Held, A. V. Lukoyanov, S. Skornyakov, and V. I. Anisimov, Phys. Rev. B 78, 115121 (2008).
- [6] H. Usui, R. Arita, and K. Kuroki, J. Phys.: Condens. Matter 21, 064223 (2009).
- [7] H. Usui, K. Suzuki, K. Kuroki, S. Nakano, K. Kudo, and M. Nohara, Phys. Rev. B 88, 075140 (2013).
- [8] K. Mori, H. Usui, H. Sakakibara, and K. Kuroki, J. Phys. Soc. Jpn. 83, 023706 (2014).
- [9] H. Yoshino, G. C. Papavassiliou, and K. Murata, J. Therm. Anal. Cal. 92, 457 (2008).
- [10] H. Yoshino, H. Aizawa, K. Kuroki, G. C. Anyfantis, G. C. Papavassiliou, and K. Murata, Physica B: Condens. Matt. 405, S79 (2010).
- [11] H. Aizawa, K. Kuroki, H. Yoshino, and K. Murata, Physica B: Condens. Matt. 405, S27 (2010).
- [12] I. Terasaki, Y. Sasago, and K. Uchinokura, Phys. Rev. B 56, R12685 (1997).
- [13] K. Saito, H. Kamio, Y. Honda, K. Kikuchi, K. Kobayashi, and I. Ikemoto, J. Phys. Soc. Jpn. 58, 4093 (1989).
- [14] K. Saito, H. Yoshino, K. Kikuchi, K. Kobayashi, and I. Ikemoto, J. Phys. Soc. Jpn. 62, 1001 (1993).
- [15] P. Blaha, K. Schwarz, G. K. H. Madsen, D. Kvasnicka, and J. Luitz, In WIEN2k, An Augmented Plane Wave + Local Orbitals Program for Calculating Crystal Properties, (Karlheinz Schwarz/ Techn. Universitt Wien, Wien, Austria, 2001).
- [16] G. C. Papavassiliou, D. J. Lagouvardos, J. S. Zambounis, A. Terzis, C. P. Raptopoulou, K. Murata, N. Shirakawa, L. Ducasse, and P. Delhaes, Mol. Cryst. Liq. Cryst. 285, 83 (1996).
- [17] H. Yoshino, K. Murata, T. Nakanishi, L. Li, E. S. Choi, D. Graf, J. S. Brooks, Y. Nogami, and G. C. Papavassiliou, J. Phys. Soc. Jpn. 74, 417 (2005).
- [18] H. Kontani, K. Kanki, and K. Ueda, Phys. Rev. B 59, 14723 (1999).
- [19] H. Yoshino, K. Iimura, T. Sasaki, A. Oda, G. C. Papavassiliou, and K. Murata, J. Phys. Soc. Jpn. 68, 177 (1999).
- [20] T. Konoike, A. Oda, K. Iwashita, T. Yamamoto, H. Tajima, H. Yoshino, K. Ueda, T. Sugimoto, K. Hiraki, T. Takahashi, T. Sasaki, Y. Nishio, K. Kajita, G. C. Papavassiliou, G. A. Mousdis, and K. Murata, Synth. Met. 120, 801 (2001).
- [21] T. Nakanishi, S. Yasuzuka, M. Teramura, L. Li, T. Fujimoto, T. Sasaki, T. Konoike, T. Terashima, S. Uji, Y. Nogami, G. C. Anyfantis, G. C. Papavassiliou, and K. Murata, J. Low Temp. Phys. 142, 247 (2006).
- [22] R. Arita, K. Kuroki, and H. Aoki, Phys. Rev. B 61, 3207 (2000).
- [23] H. Aizawa and K. Kuroki, Phys. Status Solidi C 9, 1196 (2012).