DIRECT OBSERVATIONS OF MAGNETIC FLUX ROPE FORMATION DURING A SOLAR CORONAL MASS EJECTION
Abstract
Coronal mass ejections (CMEs) are the most spectacular eruptive phenomena in the solar atmosphere. It is generally accepted that CMEs are results of eruptions of magnetic flux ropes (MFRs). However, a heated debate is on whether MFRs pre-exist before the eruptions or they are formed during the eruptions. Several coronal signatures, e.g., filaments, coronal cavities, sigmoid structures and hot channels (or hot blobs), are proposed as MFRs and observed before the eruption, which support the pre-existing MFR scenario. There is almost no reported observation about MFR formation during the eruption. In this letter, we present an intriguing observation of a solar eruptive event occurred on 2013 November 21 with the Atmospheric Imaging Assembly on board the Solar Dynamic Observatory, which shows a detailed formation process of the MFR during the eruption. The process started with the expansion of a low-lying coronal arcade, possibly caused by the flare magnetic reconnection underneath. The newly-formed ascending loops from below further pushed the arcade upward, stretching the surrounding magnetic field. The arcade and stretched magnetic field lines then curved-in just below the arcade vertex, forming an X-point. The field lines near the X-point continued to approach each other and a second magnetic reconnection was induced. It is this high-lying magnetic reconnection that led to the formation and eruption of a hot blob ( 10 MK), presumably a MFR, producing a CME. We suggest that two spatially-separated magnetic reconnections occurred in this event, responsible for producing the flare and the hot blob (CME), respectively.
1 INTRODUCTION
Magnetic flux rope (MFR), a volumetric current channel with helical magnetic field winding around its center axial field lines, plays a key role in solar eruptions manifested as coronal mass ejections (CMEs) and/or flares. The first direct observational evidence of the presence of an outstanding MFR in the sun-Earth system is from the near-Earth in-situ solar wind observation of the so called magnetic cloud (Burlaga et al. 1981). According to a statistical study (Vourlidas et al. 2013), at least 40 % coronagraphic observations of CMEs show an apparent flux-rope geometry in the outer corona. However, the direct detection of MFRs in the lower corona prior to and during the eruption has been elusive. Therefore, there has been a heated debate over whether the MFR exists before the onset of CME eruption or it is formed during the CME eruption (e.g., Forbes 2000; Klimchuk 2001). Many CME models require a pre-existing MFR and have suggested a variety of initiation processes, including direct flux injection (e.g,. Chen 1996), the catastrophic loss of equilibrium (Forbes & Isenberg. 1991; Isenberg et al. 1993; Hu et al. 2003; Chen et al. 2006, 2007), kink (Török et al. 2004) or torus (Kliem & Török 2006; Olmedo & Zhang 2010) instability. On the other hand, some theoretical models suggest that an MFR be formed during the CME eruption process through the magnetic reconnection of coronal arcade (e.g., Mikić & Linker 1994; Antiochos et al. 1999).
Several lines of observations in the lower corona indicate the presence of MFRs, e.g., filaments/prominences (Rust & Kumar 1994), coronal cavities (Wang & Stenborg 2010), sigmoids (Titov & Démoulin 1999; McKenzie & Canfield 2008), hot channels (Zhang et al. 2012; Cheng et al. 2012, 2013b; Li & Zhang 2013) and/or hot blobs (Cheng et al. 2011; Su et al. 2012; Patsourakos et al. 2013; Song et al. 2014). The term“blob” originates from a 2-dimension description of plasmoids either in numerical simulations or observations. However, it could also describe the 2-D appearance projected onto the plane of the sky of an intrinsically 3-D MFR structure when observed along the central axis. All of the features mentioned above can be observed before the CME onset, thus supporting the pre-existing-MFR scenario. To the best of our knowledge, direct observations of the MFR formation from a non-MFR structure have been rare. Cheng et al. (2011) observed an MFR (hot blob) growth process during the impulsive phase of a solar eruption. The hot blob was observed rising from the source active region, stretching the background magnetic field lines upward. The stretched field lines then approached toward the center below the blob resulting in magnetic reconnection. Above the reconnection site, poloidal magnetic fluxes were injected into the erupting blob, leading to its growth.
Different from Cheng et al. (2011), we report in this letter a formation process of a hot blob from an apparently non-MFR magnetic arcade, instead of the growth from a pre-existing progenitor blob. The observation was made by the AIA on board Solar Dynamic Observatory (SDO). The differential emission measure (DEM) analysis shows its temperature around 10 MK. The eruption of the hot blob led to a CME, which was recorded by the Large Angle Spectroscopic Coronagraph (LASCO) (Brueckner et al. 1995) on board Solar Heliospheric Observatory (SOHO) and the Sun Earth Connection Coronal and Heliospheric Investigation (SECCHI) (Howard et al. 2008) on board Solar Terrestrial Relations Observatory (STEREO). Further, the eruption was driven by magnetic reconnections occurred in two spatially different places, which are found to play different roles: causing the arcade expansion and producing the blob, respectively. In Section 2, the instruments are described. We present the observations and make discussions in Section 3, which are followed by a summary in Section 4.
2 INSTRUMENTS
The AIA on board SDO can image the solar atmosphere in 10 narrow UV and EUV passbands with a cadence of 12 seconds, spatial resolution of 1.2 arcseconds and FOV of 1.3 R⊙. The temperature response functions of these passbands cover a temperature range from 0.6 to 20 MK (O’Dwyer et al. 2010; Del Zanna et al. 2011; Lemen et al. 2012). During an eruption, the 131 Å and 94 Å passbands are sensitive to the hot plasma from flare regions and erupting flux ropes, while other passbands are better for viewing dimming regions and cooler leading fronts (LFs) of eruptions (e.g., Zhang et al. 2012; Cheng et al. 2011; Song et al. 2014). AIA’s high cadence and broad temperature coverage provide us the opportunity of observing the MFR formation process during an eruption, and make it possible for constructing DEM models of corona plasma. Recently, a DEM-based temperature analysis method has been used successfully to analyze hot blob temperatures (Cheng et al. 2012, 2014; Song et al. 2014). In this letter, we continue to use the same method to study the heating process of the arcades and hot blob. In addition, the SECCHI on board STEREO and LASCO on board SOHO provide CME images in the outer corona from different perspectives. The Reuven Ramaty High Energy Solar Spectroscopic Imager (RHESSI; Lin et al. 2002) provides the hard X-ray (HXR) spectrum and imaging of flares.
3 OBSERVATIONS AND DISCUSSIONS
3.1 The Flare – CME Event
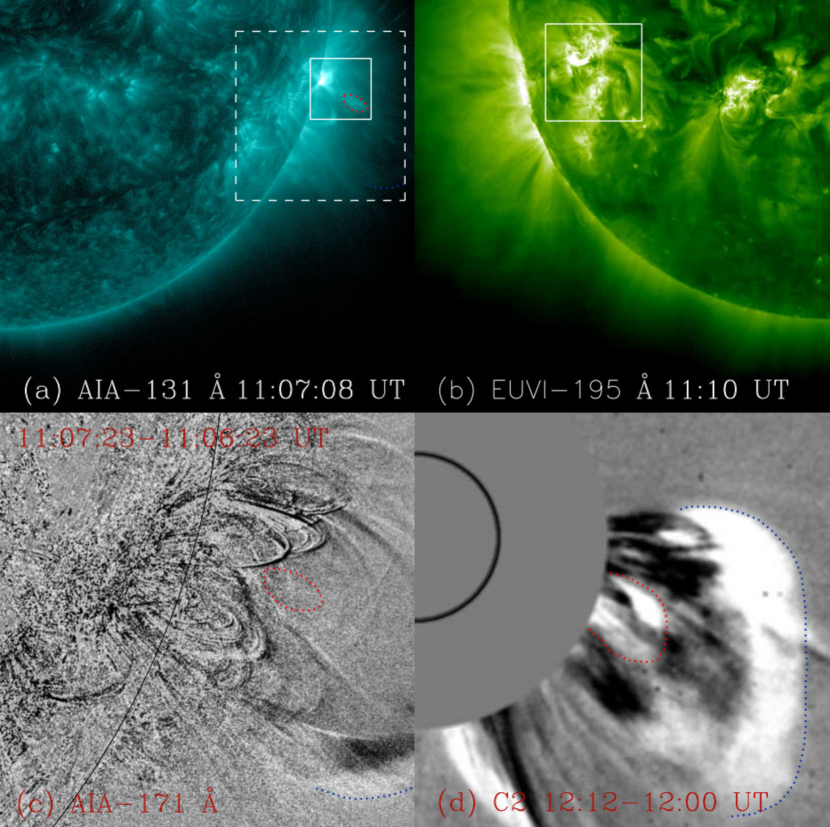
On 2013 November 21, an M1.2 class soft X-ray (SXR) flare was recorded by Geostationary Operational Environmental Satellite (GOES), which started at 10:52 UT and peaked at 11:11 UT. At this time, the separation angle of SDO and STEREO-A is 149∘. The flare location was at S14W89 (NOAA 11893) from the perspective of SDO as shown in AIA 131 Å image of Figure 1(a). The subregions depicted with dashed and solid squares show the FOV of Figure 1(c) and Figures 3(b)-(i), respectively. A hot blob was observed and depicted with the red dotted line. In the STEREO-A EUVI 195 Å image (Figure 1(b)), the flare region was shown on the disk as a solid square (also the FOV of Figures 2(c)-(d)). During the process of the hot blob formation and eruption, a cool LF, best seen in AIA 171 Å in Figure 1(c) (indicated by the blue dotted line), was formed, likely through the compression of the plasma surrounding the hot blob. Note that the LF only formed at a later time in the fast acceleration phase, similar to the formation sequence of the hot channel and its associated LF reported in Zhang et al. (2012). The hot blob is completely absent in the cool 171 Å image, as demonstrated in Figure 1(c) where the red dotted circle indicates the same location of the hot blob shown in 131 Å image in Figure 1(a). LASCO observed the corresponding CME from 2.2 to 24 R⊙ with a linear speed of 668 km s-1; the CME had a three-part structure: a bright loop-like LF (blue dotted), a dark cavity, and an embedded bright core (red dotted), as shown in Figure 1(d). Through inspecting the AIA and LASCO movies carefully, we conclude that the bright core and LF in LASCO correspond to the hot blob in 131 Å and LF in 171 Å, respectively.
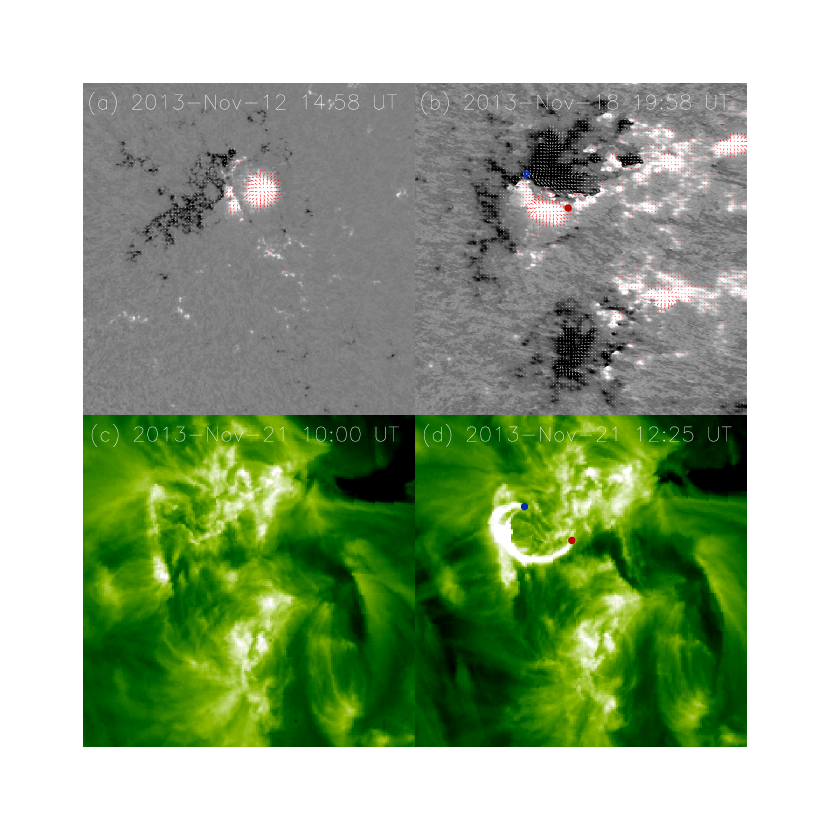
Using magnetic field observations from Helioseismic and Magnetic Imager (HMI) on board SDO, we find that the magnetic configuration of NOAA 11983 experienced an obvious emergence process for several days before the eruption (see supplementary HMI movie online). On November 12, it is classified as Hale Class (Figure 2(a)), and on November 18, classified as (Figure 2(b)). Figures 2(c) and (d) present the EUVI observations before and after the eruption, respectively (also see EUVI movie online). The location of the bright post-flare arcade and its two footpoints (depicted with red and blue dots in Figure 2(d)) indicate where the eruption took place. As shown in Figure 2(b) where the two footpoints are mapped onto the magnetogram images, the flare and the eruption occurred along the polarity inversion line (PIL). The evolution of the magnetogram indicates that there existed a slow shearing motion along the PIL. Such motion can lead to the arcade expansion upward as discussed later.
3.2 Formation of The Hot Blob
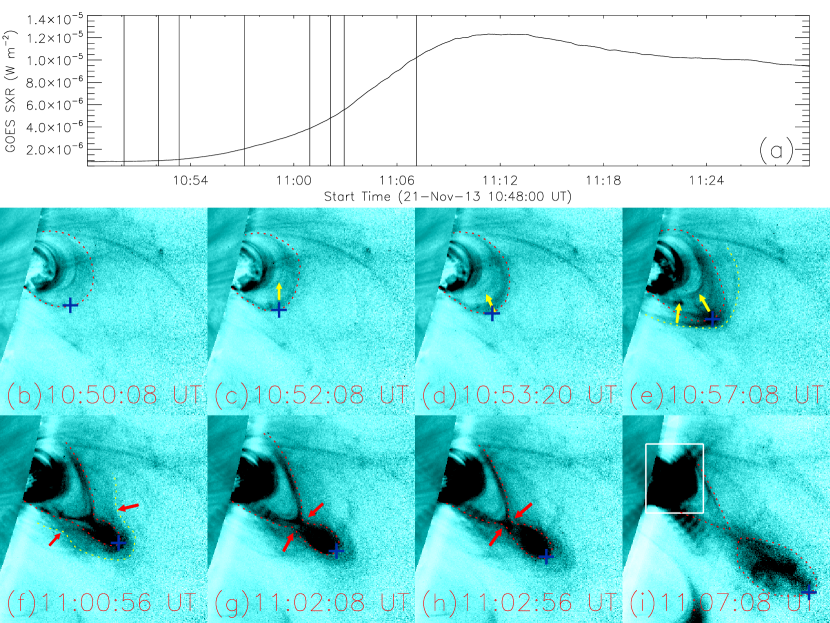
The most interesting aspect of this event is that the hot blob is formed from a rising loop arcade at the early stage of the eruption. The sequence of snapshots of the formation process are presented in Figure 3. Figure 3(a) shows the GOES 1-8 Å SXR flux, with eight vertical lines indicating the times of the images in the panels below. The AIA 131 Å images are processed with an improved radial filter technique (Ma et al. 2011).
At 10:50:08 UT (panel b), the lower coronal loops were observed clearly with AIA 131 Å , which likely corresponded to the arcade in Figure 2(d), but the higher arcade (denoted with red dotted line) overlying the loops were not obvious. Immediately after the flare onset, the arcade became visible (panel c, 10:52:08 UT). The arcade should have existed before the flare onset and the appearance is due to the heating through the underneath flare reconnection. The reconnection induced the arcade to expand outward. In the mean time, new hot loops (depicted with yellow arrows in panels c-e) were observed to ascend continuously (See AIA movie online for a better view), further pushing the arcade upward (panels c-e). The rising arcade then stretched the overlying restraining magnetic field lines (denoted with yellow dotted lines in panels e and f). Underneath the arcade apex, the arcade legs and the stretched field lines started to approach each other (denoted with red arrows in panels f-h), forming a classical X-point configuration (panel i). We believe that a second magnetic reconnection took place at the X-point, different in the location and time from the earlier flare reconnection that drove the expansion of the arcade. This second reconnection led to the formation of a hot blob. The hot blob separated completely from the arcade between 11:06 and 11:07 UT, following which the hot blob faded quickly and became difficult to identify with the AIA 131 Å images. Before and during this high-lying blob-forming magnetic reconnection, the continuous rise of the arcade stretched itself into to a cusp-like geometry, as shown in panel i with red dotted line near the solar limb. During the reconnection, we observed the shrinkage of the arcade below the X-point, returning the cusp shape to a loop-shape (see AIA Movie online for the whole process). Therefore, we suggest that in this event there exist two reconnections taking place at different coronal heights and playing different roles in the development of the blob formation and eruption. One is the low-lying flare reconnection, inducing the heating and expansion of the arcades; the other is the high-lying reconnection, forming and releasing the hot blob.
Existing magnetohydrodynamic (MHD) simulations in spherical coordinates (Mikić & Linker, 1994; Antiochos et al. 1999) have shown that, subject to the localized shearing motion in the photosphere, the magnetic arcade in the corona expands outward in a process that stretches the field lines and produces a current sheet underneath between the arcade and photospheric PIL. Magnetic reconnection occurs in the current sheet, leading to the formation and ejection of a blob (magnetic flux rope). Such scenario shown in these simulations is supported by our observations, at least qualitatively. Through carefully inspecting observations of AIA and EUVI, which provide images from different wavelengths and perspectives, we conclude that there are no any pre-existing or dormant MFR features before the eruption, i.e., filament, sigmoid, blob or hot channel as mentioned in the introduction section. What we observed is that the arcade evolved into a hot blob (flux rope), which is consistent with the MHD models mentioned above. The expansion of the arcade is possibly caused by the flare magnetic reconnection and/or new rising loops from below. Nevertheless, we want to point out that the arcade-to-flux rope scenario observed in this particular event may not occur in other events, in which MFR may exist before the eruption (e.g., Zhang et al. 2012; Cheng et al. 2011). Therefore, there is no single model that can explain the diversity of eruptive flares in real observations at present.
3.3 Heating Mechanism of The Arcades And Blob
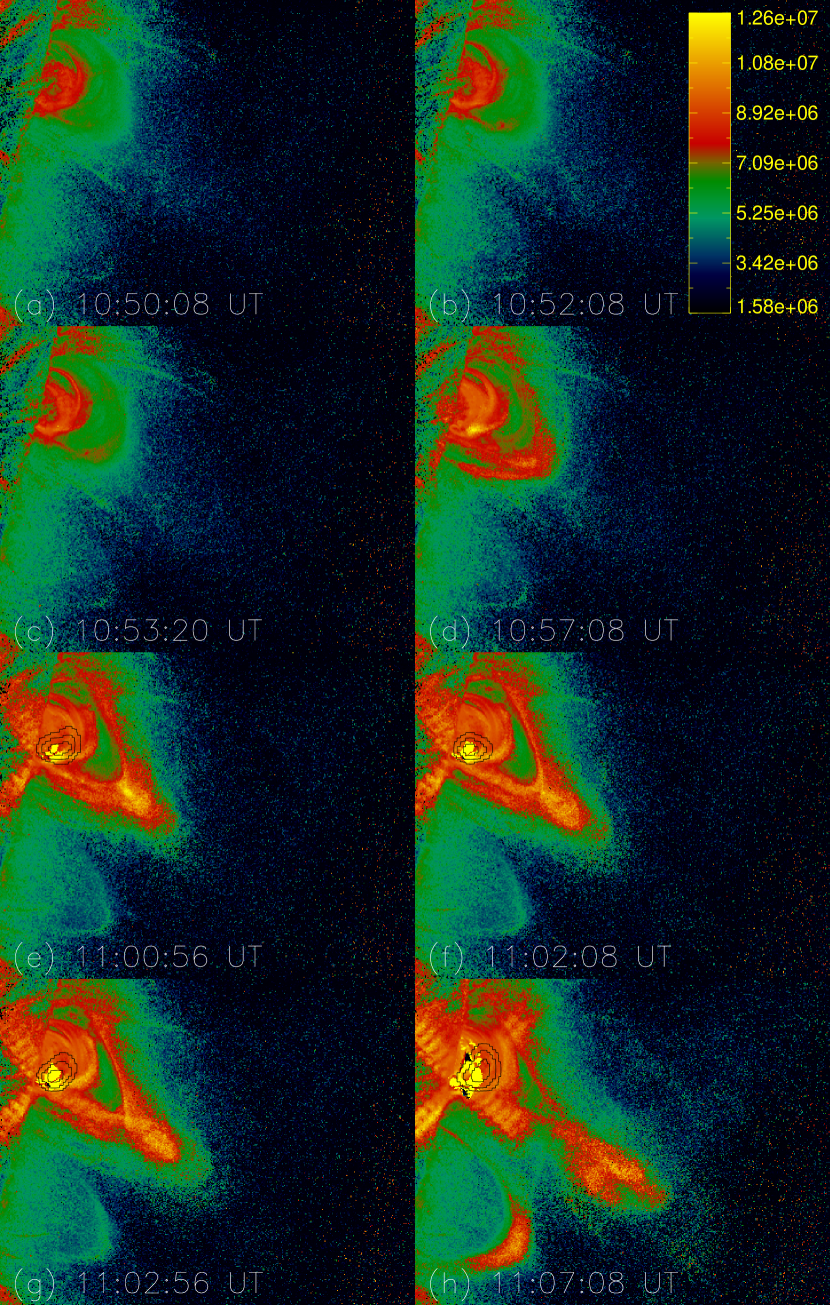
With the DEM method mentioned above (see Song et al. 2014 for details), we further illustrate the blob formation process using temperature maps (Figure 4), which show the details of the temperature distribution and evolution of the arcades and the blob. The temperature maps show that the arcade was heated from about 5 MK to 7 MK in the first 3 minutes (panels a-c). This is why the arcade appeared in the AIA 131 Å passband (in Figure 3) after the flare onset. The temperature continued to increase and approached to around 10 MK (panels e-h). Following the onset of the second magnetic reconnection at the high-lying X-point, the hot blob was formed (see DEM Movie online). To further elucidate the relation between the magnetic reconnection and the heating, we investigated the location of the HXR sources using RHESSI data, which had effective observations between 11:00 and 11:15 UT for our event. RHESSI observations are shown as black contours at 50%, 70%, and 90% of the maximum in the 12-25 keV band (panels e-h). The X-ray source appeared only in the lower loops, and no source was observed in the higher arcade and the blob. It has been shown for some events that the magnetic reconnection region should be between double X-ray sources (e.g., Liu et al. 2008; Song et al. 2014). Therefore, we suggest that the flux-rope-forming reconnection was weak in this event and didn’t have obvious contributions to the heating. The flare region and the arcade should be heated mainly by the flare magnetic reconnection, which is consistent with Song et al. (2014).
3.4 The Driver of The CME
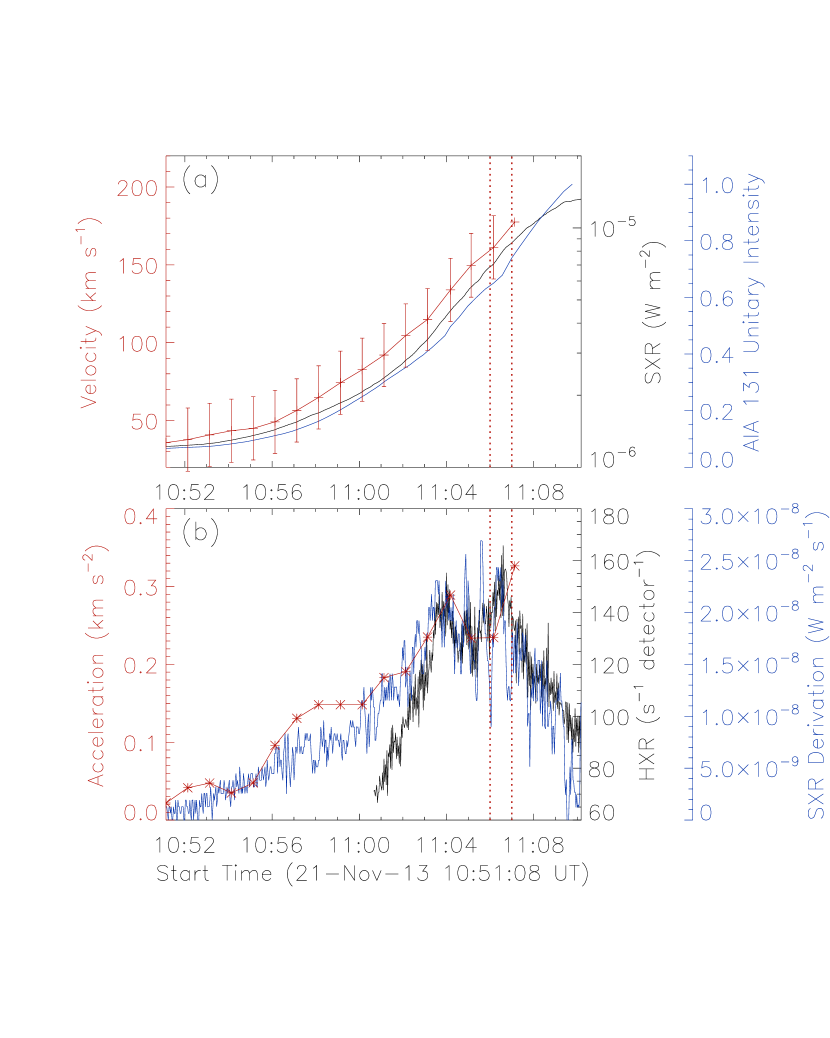
Was the hot blob a driver of the observed CME? For this event, the arcade began to rise around 10:52 UT, and the hot blob started to form at about 10:57 UT, while the appearance of the cool LF was around 11:06 UT as shown in Figure 1(c). This time sequence of different features supports that the blob is the driver. However, we did not compare the velocities between the hot blob and the cool LF, because it became difficult to track the blob after 11:06 UT, at which time the LF started to appear. To further address the issue of the cause of the CME, we studied the kinematic evolution of the rising arcades and the hot blob. The heights of the arcade and later the hot blob apex (red plus symbols shown in the middle and bottom panels of Figure 3) are tracked in the AIA images. Note that all heights refer to the top of the arcades (or the apex of the hot blob at later times) from the solar surface. Their velocities are plotted in Figure 5(a) (red solid line), along with the GOES SXR 1-8 Å profile shown by the black solid line. We calculated these velocities from the numerical differentiation by using the three-point Lagrangian interpolation of the height-time data. Note that the velocity uncertainties come mainly from the uncertainties in the height measurement. The measurement errors are estimated to be four pixels, i.e., 1700 km, which are propagated to estimate the velocity errors in the standard way. Figure 5(a) shows that the velocities increased from 40 km s-1 to 180 km s-1 continuously. The velocity variation trend is tightly coinciding with the emission variation of the associated flare. The temporal profile of the emission intensity integrated over the flare region (depicted with the white box in Figure 3(i)) in AIA 131 Å is also plotted in this panel. The EUV profile is very similar to that of the SXR. The two vertical dotted lines in Figure 5 denote the time range when the dominant hot-blob-forming magnetic reconnection took place. We further study the relation between the reconnection energy release and blob acceleration. In Figure 5(b) we plot the acceleration, RHESSI 12-25 kev HXR count rates, and derivation of SXR versus time. The close temporal correlation between HXR flux and the blob acceleration supports the idea that flares and CMEs are two strongly coupled phenomena, possibly through a mutual positive feedback process between magnetic reconnection and MFR acceleration (e.g., Zhang et al. 2004; Temmer et al. (2008)).
It is also interesting to note that the HXR profile (and the SXR derivative as well) has double peaks. In particular, the second HXR peak appeared at the same time as the high-lying blob-forming reconnection took place. This observation further supports the two-magnetic-reconnection scenario discussed earlier, i.e., the low-lying flare reconnection and the high-lying flux-rope-forming reconnection. The flare reconnection, responsible for producing the M1.2 class X-ray flare, was strong and located in a lower altitude, e.g., near the magnetic loop footpoints, as indicated by the HXR source. The flux-rope forming reconnection, occurring at the X-point between the arcade and the hot blob, might be a weaker magnetic reconnection, because of the weaker magnetic field near the arcade top. Nevertheless, this reconnection can also produce energetic electrons and demonstrate its existence through the second HXR peak. The second magnetic reconnection is essential for the blob/flux rope formation and eruption.
4 SUMMARY
An M1.2 class SXR flare and the associated CME occurred at the southwest limb on 2013 November 21. This event provided us the first direct observation of MFR formation process from a loop arcade during the eruption. We summarize the formation process as follows. The coronal arcade was heated by the underlying flare magnetic reconnection. In the same time, the arcade expanded upward, possibly due to the same reconnection process. The arcade was further strengthened and pushed upward by the new ascending loops from below. The rising of the arcade further stretched the surrounding background magnetic field. The arcade and the stretched magnetic field then curved-in beneath the loop apex, leading to the formation of an X-point. Then, the field lines near the X-point continued to approach each other and a second magnetic reconnection was induced, leading to the formation and eruption of the hot blob ( 10 MK), presumably a MFR, and producing a CME. We suggest that in this event there exist two reconnections taking place at different coronal heights and playing different roles in the development of the MFR formation and eruption. One is the low-lying flare reconnection, inducing the heating and expansion of the arcade, and the other is the high-lying magnetic reconnection, forming and releasing the MFR.
References
- Antiochos et al. (1999) Antiochos, S. K., Devore, C. R., & Klimchuk, J. A. 1999, ApJ, 510, 485
- Brueckner et al. (1995) Brueckner, G. E., Howard, R. A., Koomen, M. J., et al. 1995, Sol. Phys., 162, 357
- Burlaga et al. (1981) Burlaga, L., Sittler, E., Mariani, F., & Schwenn, R. 1981, J. Geophys. Res., 86, 6673
- Cheng (1996) Chen, J. 1996, J. Geophys. Res., 101, 27499
- Chen et al. (2006) Chen, Y., Li, G. Q., & Hu, Y. Q. 2006, ApJ, 649, 1093
- Chen et al. (2007) Chen, Y., Hu, Y. Q., & Sun, S. J. 2007, ApJ, 665, 1421
- Cheng et al. (2014) Cheng, X., Ding, M. D., Guo, Y., et al. 2014, ApJ, 780, 28
- Cheng et al. (2013a) Cheng, X., Zhang, J., Ding, M. D., et al. 2013, ApJ, 763, 43
- Cheng et al. (2013b) Cheng, X., Zhang, J., Ding, M. D., et al. 2013, ApJ, 769, L25
- Cheng et al. (2011) Cheng, X., Zhang, J., Liu, Y., & Ding, M. D. 2011, ApJ, 732, L25
- Cheng et al. (2012) Cheng, X., Zhang, J, Saar, S. H., & Ding, M. D. 2012, ApJ, 761, 62
- Del Zanna et al. (2011) Del Zanna, G., O’Dwyer, B., & Mason, H. E. 2011, A&A, 535, A46
- Forbes (2000) Forbes, T. G. 2000, J. Geophys. Res., 105, 23153
- Forbes & Isenberg (1991) Forbes, T. G., & Isenberg, P. A. 1991, ApJ, 373, 294
- Howard et al. (2008) Howard, R. A., Moses, J. D., Vourlidas, A., et al. 2008, Space Sci. Rev., 136, 67
- Hu et al. (2003) Hu, Y. Q., Li, G. Q., & Xing, X. Y. 2003, J. Geophys. Res., 108, 1072
- Isenberg et al. (1993) Isenberg, P. A., Forbes, T. G., & Demoulin, P. 1993, ApJ, 417, 368
- Kliem & Török (2006) Kliem, B., & Török, T. 2006, Phys. Rev. Lett., 96, 255002
- Klimchuk (2001) Klimchuk, J. A. 2001, in Space Weather, ed. Song, P., Singer, H., & Siscore, G. (Geophysical Monograph 125; Washington, DC: Am. Geophys. Un.), 143
- Lemen et al. (2012) Lemen, J. R., Title, A. M., Akin, D. J., et al. 2012, Sol. Phys., 275, 17
- Li & Zhang (2013) Li, L. P., & Zhang, J. 2013, A&A, 552, L11
- Lin et al. (2002) Lin, R. P., Dennis, B. R., Hurford, G. J. et al. 2002, Sol. Phys., 210, 3
- Liu et al. (2008) Liu, W., Petrosian, V., Dennis, B. R., & Jiang, Y. W. 2008, ApJ, 676, 704
- Ma et al. (2011) Ma, S. L., Raymond, J. C., Golub, L., et al. 2011, ApJ, 738, 160
- McKenzie & Canfield (2008) McKenzie, D. E., & Canfield, R. C. 2008, A&A, 481, L65
- Mikić & Linker (1994) Mikić, Z., & Linker, J. A. 1994, ApJ, 430, 898
- O’Dwyer et al. (2010) O’Dwyer, B., Del Zanna, G., Mason, H. E., Weber, M. A., &Tripathi, D. 2010, A&A, 521, A21
- Olmedo & Zhang (2010) Olmedo, O., & Zhang, J. 2010, ApJ, 718, 433
- Patsourakos et al. (2013) Patsourakos, S., Vourlidas, A., & Stenborg, G. 2013, ApJ, 764, 125
- Rust & Kumar (1994) Rust, D. M., & Kumar, A. 1994, Sol. Phys., 155, 69
- Song et al. (2014) Song, H. Q., Zhang, J., Cheng, X., et al. 2014, ApJ, 784, 48
- Su et al. (2011) Su, Y., Surges, V., van Ballegooijen, A., DeLuca, E., & Golub, L. 2011, ApJ, 734, 53
- Temmer et al. (2008) Temmer, M., Veronig, A. M., Vršnak, B., et al. 2008, ApJ, 673, L95.
- Titov & Démoulin (1999) Titov, V. S., & Démoulin, P. 1999, A&A, 351, 707
- Török et al. (2004) Török, T., Kliem, B, & Titov, V. S. 2004, A&A, 413, L27
- Vourlidas et al. (2012) Vourlidas, A., Lynch, B. J., Howard, R. A., & Li, Y. 2013, Sol. Phys., 284, 179
- Wang & Stenborg, G. (2010) Wang, Y. M., & Stenborg, G. 2010, ApJ, 719, L181
- Zhang et al. (2012) Zhang, J., Cheng, X., & Ding, M. D. 2012, NatCo, 3, 747
- Zhang et al. (2004) Zhang, J., Dere, K. P., Howard, R. A., & Vourlidas, A. 2004, ApJ, 604, 420