The orbital period of the
V Sge star candidate QU Carinae
††thanks: Based on observations obtained at Observatório do Pico dos Dias, LNA/MCT, Brazil.
Abstract
Close Binary Supersoft X-ray Sources (CBSS) are considered strong candidates to SN Ia progenitors, but very few CBSS are known in our Galaxy. The galactic counterparts of the CBSS may be the V Sge stars, not detected in X-rays due to the strong absorption by the interstellar gas. Nevertheless, the number of members in the V Sge class is still small. In order to find new members we selected QU Car for photometric and spectroscopic observations. The orbital period of this system was published in the literature as 10.9 h, determined from radial velocity data taken in 1979–1980, but posterior analysis of data taken in 2006–2007 did not confirm this period. We analysed the high variability of its emission line profiles with the Temporal Variance Spectrum (TVS) technique. Besides, we recovered the 10.9 h orbital period from the radial velocities of the He ii 4686 Å emission line and, for the first time, detected what may be the orbital modulation in the photometric data. This photometric modulation is present only in the lower brightness state data, when the flickering is attenuated. The inclusion of QU Car in the V Sge class is supported by many features like high/low states, strong winds, nebular lines and He ii 4686 Å/H line ratios. However, the non-detection of the characteristic O vi 3811–34 Å lines in its spectrum claims against this classification. These lines, though, may be highly variable so additional spectra analysed with the TVS technique can, possibly, solve this question.
keywords:
binaries: close – X-rays: binaries – supernovae: general – novae, cataclysmic variables – stars: individual: QU Car1 Introduction
Despite the major importance of the Type Ia Supernovae (SN Ia), as cosmological distance indicators, to the discovery of the accelerated expansion of the Universe and the dark energy (Riess et al., 1998; Perlmutter et al., 1999), the unknown nature of its progenitors is still a great concern. It is a theoretical consensus that the progenitors are binary systems with a massive C/O white dwarf (WD) which ignites when it reaches the Chandrasekhar mass limit. However, the nature of the companion star is under heavy debate yet. It can be a non-degenerate companion star in the single degenerate (SD) channel or a WD companion in the double degenerate channel. See Maoz, Mannucci & Nelemans (2013) and Wang & Han (2012) for recent reviews on the topic of SN Ia progenitors.
In the single degenerate channel, the Close Binary Supersoft Sources (CBSS) and the V Sge stars are strong candidates to SN Ia progenitors, given their massive WD and high accretion rates. In CBSS (Kahabka & van den Heuvel, 1997) the WD experiences hydrostatic nuclear burning on its surface because of the very high ( Myr-1) accretion rate from the near main sequence secondary star. Firstly discovered as supersoft X-ray sources in the Magellanic Clouds, only two CBSS have been discovered in the Galaxy so far (namely QR And and MR Vel). To address the problem of the discrepancy between the number of CBSS discovered in other galaxies and in the Milk Way, Steiner & Diaz (1998) proposed that the V Sge class of stars could be the galactic counterpart of the CBSS, not recognized as such in our Galaxy because of the absorption of the supersoft emission by the interstellar gas.
The V Sge stars are spectroscopically characterized by high-ionization emission lines of O vi and N v and by the ratio of the equivalent widths of He ii 4686 Å to H usually greater than 2. Other characteristic features are P Cyg profiles, indicating strong wind in the systems, and the lack or weakness of He i lines. Their orbital periods range from 5 to 12 h and their orbital light curves are either low-amplitude sinusoidal or high-amplitude asymmetric with primary and secondary eclipses. As in the CBSS, no spectroscopic evidence of atmospheric absorption features from the secondary star has been found until now in the V Sge stars, although in V Sge itself the discovery of narrow Bowen fluorescence emission features of O iii 3132 and 3444 Å characterized it as a double-lined spectroscopic binary, allowing the estimate of the mass ratio (Herbig et al., 1965). Four members initially composed the V Sge class: V Sge (Herbig et al., 1965), V617 Sgr (Steiner et al., 1999, 2007), WX Cen (Oliveira & Steiner, 2004) and DI Cru (HD104994, WR46), but the latter has left the V Sge class being re-classified as a quasi Wolf–Rayet (qWR) star (Oliveira, Steiner, & Diaz, 2004). Attempts were made to increase the number of known members in the V Sge class, but until now the low number of members still remains. The candidates WR 7a (Oliveira, Steiner, & Cieslinski, 2003) and HD 45166 (Steiner & Oliveira, 2005) have also been classified as qWR stars, as in the case of DI Cru. Witham et al. (2007) noted the spectral similarity of IPHAS J025827.88+635234.9 to V Sge and to the cataclysmic variable QU Car, however Kozhevnikov (2014) claims its photometric behaviour does not fit the typical behaviour of the V Sge stars and CBSS. Recently, Kafka, Anderson, & Honeycutt (2008) (hereafter KAH08) suggested the inclusion of QU Car in the V Sge class.
QU Car, although being bright () and known since 1968, is very poorly understood. It was discovered as an irregular variable with observational features similar to Sco X-1 by Stephenson, Sanduleak, & Schild (1968). Schild (1969) suggested its classification as an old nova and reported flickering as large as 0.2 mag in time-scales of minutes, but found no periodicity in the light curve that could be associated to orbital motions. This author also reported that the spectroscopic emission lines are weakest and absorption are strongest during times of maximum flickering activity. Gilliland & Phillips (1982) (hereafter GP82) determined an orbital period of 10.9 h from the radial velocities of the He ii 4686 Å emission line, a dominant optical spectral feature besides the C iii/N iii complex at 4630–4660 Å. No spectral features of a secondary star were found in their spectra, despite the long orbital period, leading to the suggestion that the light of the system is dominated by the WD and accretion disc. They suggested the classification of QU Car as Nova-like. While GP82 set a lower limit of 500 pc to the distance to QU Car, Drew et al. (2003) estimated a possible distance of 2 kpc. If this is really the case, the luminosity would be erg s-1 and the mass accretion rate would be close to M☉ yr-1, which are typical values of the CBSS.
Nevertheless, a comparison made by Drew et al. (2003) between the optical spectrum they obtained for QU Car and CBSS published spectra, showed that the absence of O vi in the former indicates that the degree of ionization in QU Car is lower than in CBSS. Based on the spectrum they also argue that the secondary may be an early-type R star.
KAH08 obtained new optical spectra of QU Car and performed a radial velocity analysis of the He ii 4686 Å line in order to provide a modern ephemeris, but surprisingly they could not find, in their data set, the 10.9 h orbital period previously determined by GP82 in data taken 27 years before, using the same emission line. KAH08 propose that line profile variations due to an erratic wind may be responsible for the non-detection of the 10.9 h periodicity. In their spectra they also found signals of the forbidden [O iii] and [N ii] emission lines, indicative of a nebula. This may possibly be related to the presence of a strong wind.
Based on the similarity of the spectra of QU Car to that of the V Sge star WX Cen, KAH08 proposed its inclusion on the V Sge class. Besides, they analysed a long term AAVSO photometric time series of QU Car and discovered high and low brightness states similar to the ones presented by the V Sge stars. The same set of AAVSO data, plus ASAS photometric monitoring, were analysed by Kafka, Honeycutt, & Williams (2012) (hereafter KHW12). In that data QU Car presented high states with mag and less frequent low states lasting for d when the magnitude was below 12 mag. KHW12 proposed to link QU Car to the V Sge class and to the Accretion Wind Evolution (AWE) model (Hachisu & Kato, 2003) which reproduces the high/low brightness levels as well as the off/on soft X-rays states of V Sge.
In an observational program to search for galactic counterparts of the CBSS and new members of the V Sge class, we selected QU Car for photometric and spectroscopic studies. In this paper we present our efforts to better understand this elusive system. In section 2 we present our data and in section 3 we discuss the extensive series of spectra, both in terms of line profile and radial velocity variabilities, and also discuss the photometric data. Our conclusions are presented in section 4.
2 Observations and data reduction
QU Car was observed with all three telescopes at the Observatório Pico dos Dias (OPD – LNA/MCTI) located in southeast Brazil. Photometric observations were carried out on ten nights during 2009, 2011 and 2012 (Table 1) at both 0.6-m Zeiss and Boller & Chivens telescopes. We employed three distinct thin, back-illuminated detectors: the E2V CCD47-20 (CCD S800), the SITe SI003AB (CCD 101) and the E2V CCD42-40 (CCD IkonL). Time series of images were obtained through the Johnson V filter, with individual exposure times of 30 seconds. The timings were provided by a GPS receiver. Bias and dome flatfield exposures were used for correction of the detector read-out noise and sensitivity using standard iraf111iraf is distributed by the National Optical Astronomy Observatories, which are operated by the Association of Universities for Research in Astronomy, Inc., under cooperative agreement with the National Science Foundation. tasks. The differential aperture photometry was performed with the DAOPHOT II package using apertures and background annulus defined by the instantaneous PSF measured at each image.
| Date | Length of | Telescope | CCD |
| (UT) | observation (h) | ||
| 2009 Jun 06 | 2.8 | 0.6 m B&C | S800 |
| 2011 Apr 13 | 7.7 | 0.6 m Zeiss | 101 |
| 2011 Apr 22 | 6.3 | 0.6 m Zeiss | 101 |
| 2011 Apr 23 | 3.5 | 0.6 m Zeiss | 101 |
| 2011 Apr 24 | 3.7 | 0.6 m Zeiss | 101 |
| 2011 May 11 | 1.7 | 0.6 m Zeiss | IkonL |
| 2011 Jun 21 | 7.0 | 0.6 m Zeiss | IkonL |
| 2012 Mar 14 | 8.1 | 0.6 m Zeiss | 101 |
| 2012 Mar 25 | 9.3 | 0.6 m Zeiss | 101 |
| 2012 Mar 26 | 6.0 | 0.6 m Zeiss | 101 |
The spectroscopic data were obtained with the 1.6-m Perkin–Elmer and the 0.6-m Boller & Chivens telescopes at OPD in 12 nights during 2004, 2008, 2010 and 2012. Table 2 presents a journal of the spectroscopic observations. Two thin, back-illuminated Marconi detectors (CCD 098 and CCD 105) were used with the Coudé or Cassegrain spectrographs. Bias and flatfield corrections were applied as usual. The width of the slit was adjusted to the conditions of the seeing. We took exposures of calibration lamps after every third exposure of the star, in order to determine accurate wavelength calibration solutions. The image reductions, spectra extractions and wavelength calibrations were executed with iraf standard routines.
| Date | Telescope | Spectrograph | Grating | CCD | Exp. Time | Number | Resol. | Spec. range |
|---|---|---|---|---|---|---|---|---|
| (UT) | (l mm-1) | (s) | of exps. | (Å) | (Å) | |||
| 2004 Feb 17 | 1.6 m P-E | Coudé | 600 | 098 | 600 | 5 | 0.7 | 4040–5170 |
| 2004 Mar 01 | 1.6 m P-E | Coudé | 600 | 098 | 1200 | 8 | 0.7 | 4040–5170 |
| 2004 Mar 11 | 0.6 m B&C | Cass. | 900 | 105 | 900 | 9 | 2 | 3800–5230 |
| 2008 Apr 02 | 1.6 m P-E | Coudé | 600 | 105 | 900 | 1 | 0.6 | 4500–5000 |
| 2010 Feb 13 | 1.6 m P-E | Coudé | 600 | 098 | 600 | 26 | 0.6 | 4205–5340 |
| 2010 Feb 14 | 1.6 m P-E | Coudé | 600 | 098 | 600 | 27 | 0.6 | 4205–5340 |
| 2010 Feb 16 | 1.6 m P-E | Coudé | 600 | 098 | 600 | 17 | 0.6 | 4205–5340 |
| 2012 Mar 01 | 1.6 m P-E | Coudé | 600 | 098 | 1200 | 4 | 0.7 | 4000–5140 |
| 2012 Mar 02 | 1.6 m P-E | Coudé | 600 | 098 | 1200 | 8 | 0.7 | 4000–5140 |
| 2012 Mar 03 | 1.6 m P-E | Coudé | 600 | 098 | 1200 | 1 | 0.7 | 4000–5140 |
| 2012 Mar 04 | 1.6 m P-E | Coudé | 600 | 098 | 1200 | 6 | 0.7 | 4000–5140 |
| 2012 Mar 05 | 1.6 m P-E | Coudé | 600 | 098 | 1200 | 21 | 0.7 | 4000–5140 |
3 Data analysis and results
3.1 Variability in the spectral features
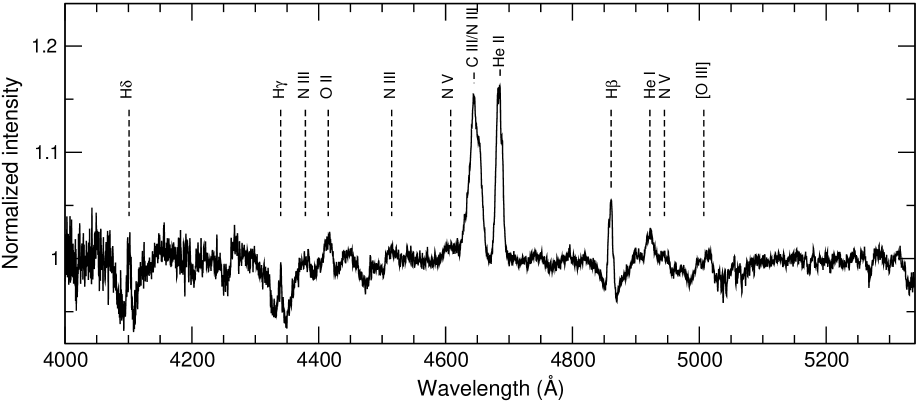
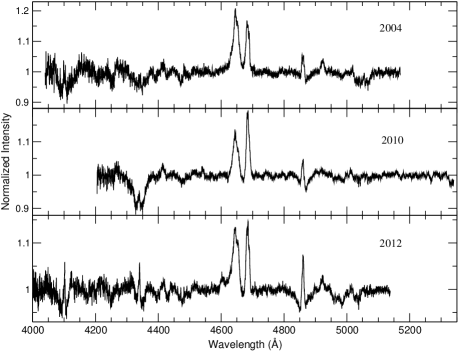
The average spectrum of QU Car constructed with data obtained in 2004, 2010 and 2012, normalized to the continuum, is presented in Fig. 1. It is dominated by the emission features of He ii 4686 Å and the C iii/N iii complex. The Balmer emission lines are superposed on broad absorption features. Emission lines of N v 4603, 4619 and 4945 Å, N iii 4379 and 4515 Å, O ii 4415 Å, He i 4922 Å and [O iii] 5007 Å are also present. The features in the spectra are highly variable, both in terms of intensities and profiles. Fig. 2 shows the average spectra for 2004, 2010 and 2012, and Table 3 lists the equivalent widths and FWHM of the emission lines in the average spectra of these years.
The broad Balmer absorption troughs are variable and were also observed by GP82, Drew et al. (2003) and KAH08. A possible explanation for the origin of these troughs could be the spectral features of the white dwarf atmosphere, although it would imply that the emission of the primary has a substantial contribution in the optical, in contrast to other evidences of a high accretion rate occurring in QU Car. A more convincing explanation is that the Balmer troughs are formed in the optically thick accretion disc. Such absorptions are observed in the spectra of dwarf novae during eruption and in UX UMa nova-likes (so called thick-disc CVs) as RZ Gru (Warner, 1995). During the evolution to the maximum of the dwarf nova eruption there is a transition from emission-line to absorption-line spectrum, as well described for SS Cyg (Hessman et al., 1984). An important point to note is that in such cases the Balmer decrement is much steeper in the emission than in the absorption lines, resulting in H in emission while higher series members present progressively stronger absorptions (Warner, 1995). This seems to be the case observed in the spectrum of QU Car presented, for instance, in fig. 1 of KAH08.
The ratio of the equivalent widths of the He ii 4686 Å to H emission lines, which is typically greater than 2 in CBSS and V Sge stars, varied from in our 2004 data to 4 in 2010 and back to 2 in 2012, while GP82 measured in 1979 and KAH08 obtained a value always lower than 1 in 2006 and 2007 data. These ratios, however, are uncertain and should be looked with caution, since the presence of the variable Balmer absorption troughs in all observed spectra of QU Car affects the measurements of the EW of the H emission. We, like KAH08, measured the EW of the Balmer lines only in their emission cores. The ratio of the EW of the He ii to the Bowen C iii/N iii complex, on the other hand, changed from 0.5 to 0.9 and to 0.6 between 2004, 2010 and 2012.
In the 2012 average spectrum the N v 4603 and 4619 Å emission lines are present, while N v 4945 Å is visible in the average spectra of 2010 and 2012. These high-ionization lines, together with the strong He ii 4686 Å line, are defining features of the V Sge stars. But, differently from what happens in the V Sge stars, in QU Car the He i 4922 Å emission line is present, as can be seen in its 2004 and 2012 average spectra. Steiner & Diaz (1998) analysed the presence of He ii and the absence of He i in the V Sge stars and suggested that these lines are formed by photoionization in a matter limited region, in contrast with the radiation limited case often found in Cataclysmic Variables. In this context, it is interesting to note the possible anti-correlation between the intensities of the He ii 4686 Å and He i 4922 Å lines in our QU Car spectra: while in 2004 He ii is less intense than the Bowen complex, the He i line is quite prominent (). This situation is inverted in 2010, when He ii is more intense than the Bowen complex and the He i line is marginally detected (). In 2012 an intermediate situation occurs.
In order to examine the variability of the emission line profiles in more detail, we performed the temporal variance spectrum (TVS) analysis on our spectroscopic data. In this procedure, the temporal variance is calculated for each wavelength pixel, from the residuals of each continuum normalized spectrum to the average spectrum. In our implementation, the temporal variance spectrum is the square root of the variance as a function of wavelength. A characteristic indicator of the variability of each spectral feature is the ratio between its variance and its intensity, . The TVS can be a useful method to distinguish between different kinds of features present in a line spectrum. Telluric lines, for instance, can present very high values for , while interstellar lines should not appear in the TVS. Also, if a line has no intrinsic profile variation but has radial velocity displacement only, its TVS should present an unambiguous double peak profile with . For further details on the TVS method see Fullerton, Gies, & Bolton (1996).
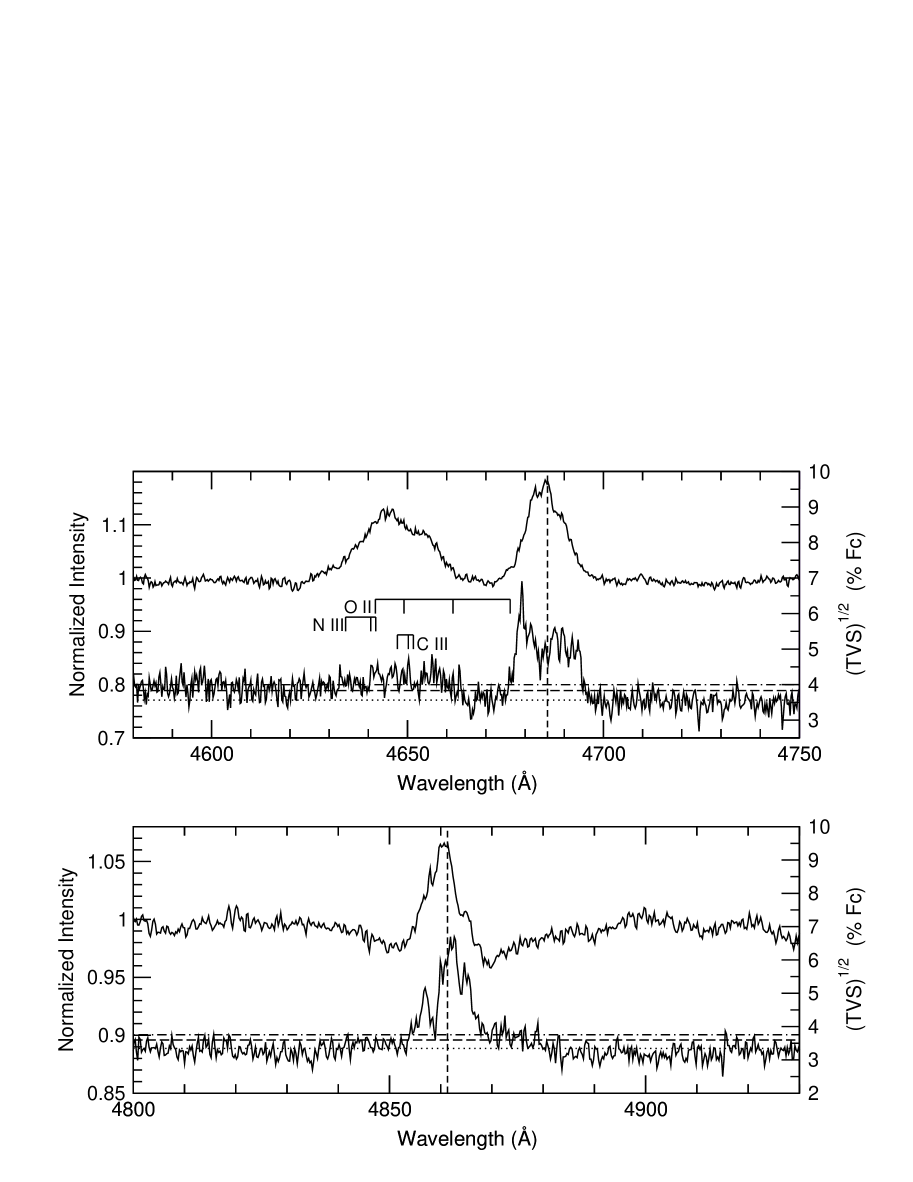
We constructed the TVS for the strongest spectral lines, such as the Bowen complex, He ii 4686 Å and H, using our 110 spectra obtained in 2010 and 2012 (the lower number of spectra obtained in 2004 precludes this analysis for that year). Fig. 3 shows the observed average intensity spectrum of QU Car and the calculated TVS. The most striking feature is the difference between the TVS profiles of the Bowen complex and of the He ii line. While the TVS of He ii presents a rich and intense profile, the Bowen complex show marginally significant features above the 1 per cent statistical level, representing a lower variability in this complex. In Fig. 3 we also show the rest positions of the strongest lines (C iii, N iii and O ii) of the Bowen blend (McClintock, Canizares, & Tarter, 1975), which coincides with some features in the respective TVS.
The He ii intensity emission line has an asymmetric compound profile with a main peak at 4685 Å ( km s-1) and some smaller side emissions. The TVS of He ii is much more asymmetric, with a central dip centred at the velocity of km s-1. It shows strong variability at km s-1, with per cent, that seems to be associated to a blue emission component observed in the intensity spectrum. The red wing of He ii also presents relevant variability in the TVS, with per cent, which may be associated to a red emission component at km s-1. These possible associations are clearer in the TVS constructed with separate 2010 and 2012 data, not shown in this paper. The core of the line, on the other hand, shows lower variability, with per cent. Another possible interpretation to the behaviour in the blue wing of He ii is a variable P Cyg profile causing maximum variance in the blue.
The H emission line presents a situation similar to He ii. In the blue wing of this emission line the TVS shows a peak displaced at km s-1 with per cent, and in this same velocity the intensity spectrum presents a clear peak. In the red wing, the TVS has a peak at km s-1 with per cent, again at the same velocity of a emission component in the intensity spectrum. But, differently from He ii, the central core of H emission exhibit high variability with per cent. An interesting fact is that the peak of the line is displaced to km s-1 in the intensity spectrum while the peak in the TVS is displaced to km s-1. We do not have interpretation for these velocities. No statistically significant variability is evident in the blue wing of the broad absorption feature of H, while in the red wing the variability is only marginally significant at the 1 per cent level.
The [O iii] 5007 Å forbidden line, observed before in QU Car by KAH08 and KHW12, is not accompanied by the weaker component of the doublet at 4959 Å. In spectra obtained in 2006 and 2007, KAH08 observed this feature split in two components with velocities of and km s-1, suggesting their formation in the front and back sides of an expanding shell. In 2010 and 2011, KHW12 observed only one weak velocity component of [O iii] 5007 Å. Our data clearly show both components in the average spectra taken in 2004, 2010 and 2012. Table 4 presents the velocities of these components measured in the average spectra of each year. The TVS in the spectral region of the [O iii] 5007 Å line does not exhibit statistically significant variations.
| Species | EW in | FWHM in | EW in | FWHM in | EW in | FWHM in |
|---|---|---|---|---|---|---|
| 2004 (Å) | 2004 (km s-1) | 2010 (Å) | 2010 (km s-1) | 2012 (Å) | 2012 (km s-1) | |
| H | 700 | … | … | 590 | ||
| H | 430 | 570 | 400 | |||
| N iii 4379 Å | 1330 | 1030 | 2350 | |||
| O ii 4415 Å | 1360 | 980 | 1160 | |||
| C iii/N iii/O ii 4642 Å | 1420 | 1350 | 1400 | |||
| He ii 4686 Å | 770 | 740 | 720 | |||
| H | 600 | 480 | 460 | |||
| He i 4922 Å | 820 | 380 | 730 | |||
| 5007 Å full | 2120 | 1640 | 1960 | |||
| 5007 Å blue | 780 | 1020 | 930 | |||
| 5007 Å red | 1050 | 610 | 760 |
| Year | v- | v+ |
|---|---|---|
| (km s-1) | (km s-1) | |
| 2004 | ||
| 2010 | ||
| 2012 |
3.2 The spectroscopic orbital period
We measured radial velocities of the He ii 4686 Å line by fitting a gaussian function to the peaks of the line profiles, and used the values obtained to search for periodicities. Fig. 4 shows the Lomb–Scargle (Scargle, 1982) periodogram of our 2010 and 2012 radial velocity data, which correspond to the most homogeneous set of spectra, as well as the periodograms we constructed from the GP82 and KAH08 He ii 4686 Å radial velocities.
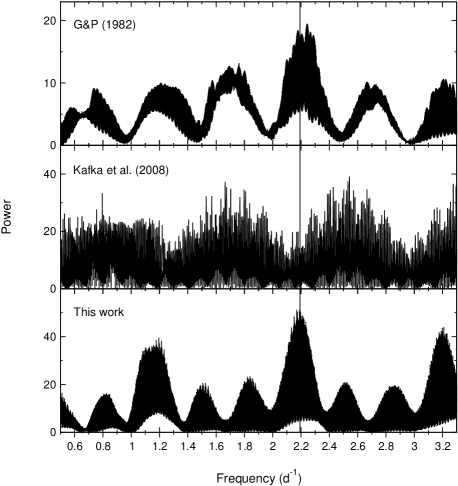
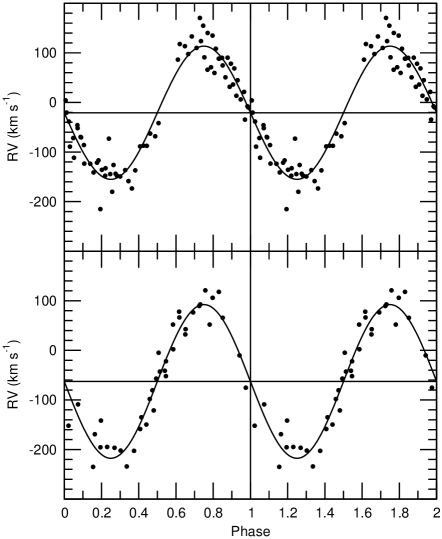
The individual periodograms of the three sets of data taken in 2004, 2010 and 2012 at OPD are very similar to the periodogram of the 2010/2012 combined data set shown in Fig. 4. This result shows that the 10.9 h orbital period determined by GP82 from 1979 and 1980 data, which was later absent in radial velocity data of KAH08 taken in 2006 and 2007, reappears as P = 10.94 h in our spectra obtained in 2010 and 2012, being also present in our 2004 data. The spectroscopic ephemerides associated to the He ii 4686 Å emission line from 2010 and 2012 data are shown in Table 5. The zero phase is defined as the crossing from positive to negative values of the radial velocity, when compared to the systemic velocity of each set, P is the orbital period from that set and is the semi-amplitude of the sinusoidal fit. In Fig. 5 we present the radial velocity curves of 2010 and 2012 data, folded with the period and epoch of each respective ephemeris.
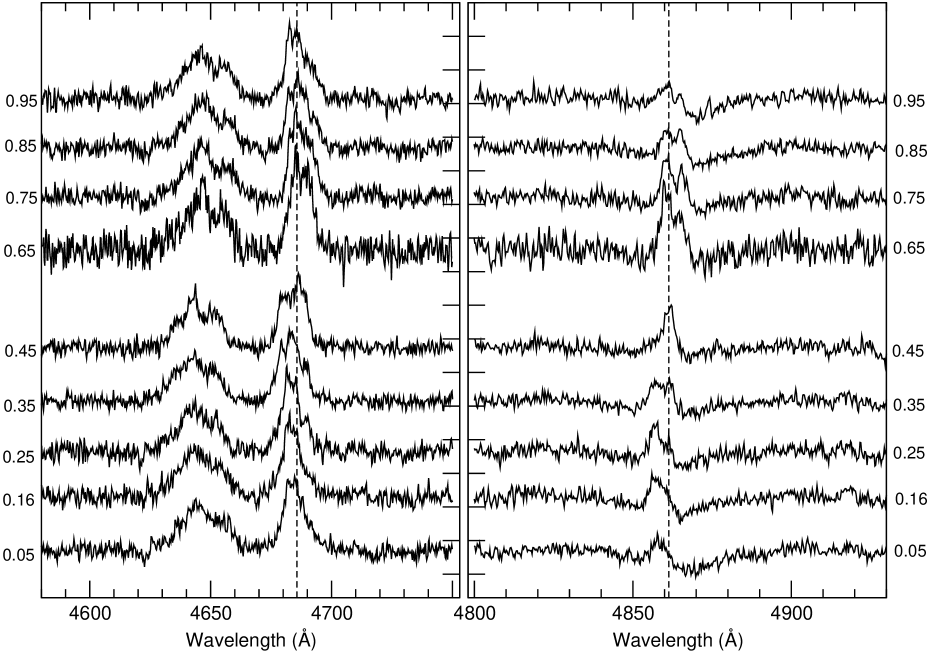
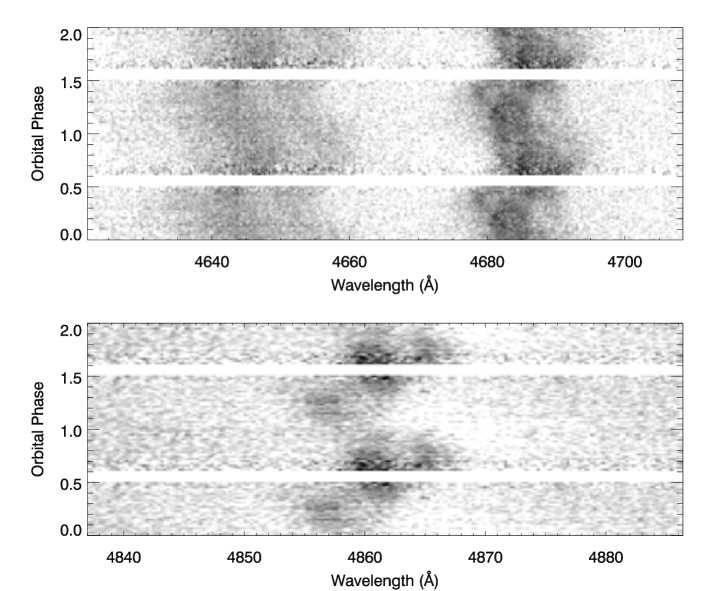
Fig. 6 shows the binned average spectra of the C iii/N iii complex, He ii 4686 Å and H lines, obtained in 2010 (our largest data set), phased with the orbital period and from the 2010 ephemeris, each spectrum being the average of five to ten spectra depending on the bin, while Fig. 7 presents the trailed spectrograms of the same data set. The C iii/N iii complex, He ii 4686 Å and H lines are clearly in phase. When comparing the structures in the line profiles of He ii 4686 Å and H at the same orbital phase bin, one can see that these structures are quite similar (see, for instance, the profiles at phase 0.65), perhaps indicating that these features are produced in the same location. The profiles of these lines are strongly variable, specially H which additionally experiences the presence of the variable absorption trough. When exploring the individual spectra we could see that, in some occasions, H almost completely disappears in the noise, usually during phases 0.8 to 0.3. However, due to the low S/N ratio in the individual spectra we could not ensure whether this phenomenon is associated to the orbital phase or to a non-orbital source of variability, although the disappearance of H for about half an orbital cycle was also reported by GP82.
| Year | P | K1 | ||
|---|---|---|---|---|
| (HJD) | (d) | (km s-1) | (km s-1) | |
| 2010 | 2 455 241.785 0.027 | 0.450 0.009 | 134 28 | |
| 2012 | 2 455 992.920 0.036 | 0.456 0.010 | 155 30 |
3.3 The photometric orbital period
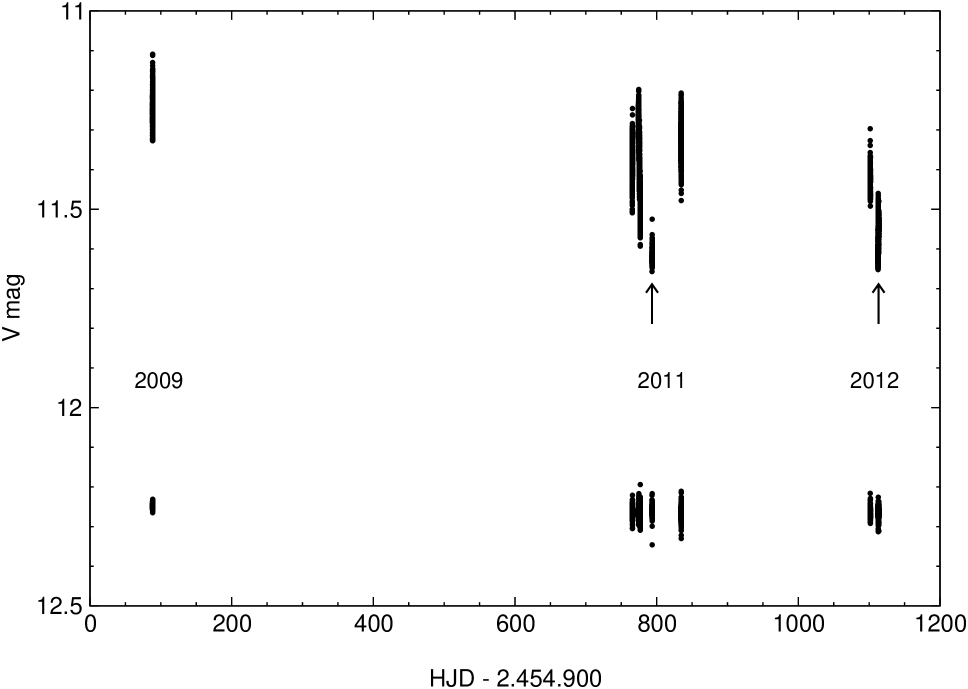
After seeing the recovery of the 10.9 h orbital period in our spectroscopic data, we searched for periodic modulations in the photometric data. In order to better compare our photometric data to the high/low brightness levels published by KAH08 and KHW12, we converted our differential magnitudes to V magnitudes. For that we used as reference one of our differential comparison stars, C1, which is registered in the Tycho-2 catalogue (Høg et al., 2000) as TYC 9212-2118-1, with .
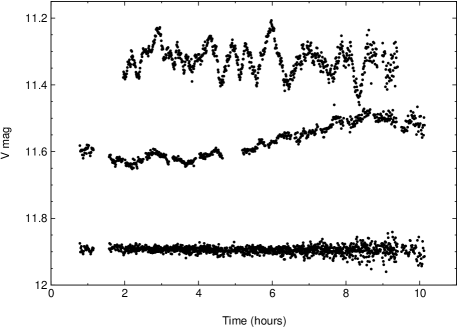
The light curves of QU Car show many kinds of variability, with time-scales ranging from minutes to months. The most prominent one is flickering, with time-scales of tens of minutes and amplitudes of 0.2 mag as can be seen, for example, in the light curve of 2011 June 21 (upper light curve in Fig. 8). Superposed on this flickering there are slow (hours) and smooth non-periodic fluctuations of tenths of magnitude. QU Car also presents different brightness levels with amplitude of about 0.5 mag and time-scales of tens of days in our set of data (Fig. 9), which were also reported by KAH08 and KHW12. It is important to say that QU Car was never caught below visual magnitude 11.7 in our set of data, differently from observations described in KHW12, where it occasionally dropped below 12 mag. There seems to exist in our data a correlation between the brightness level and the flickering activity of QU Car, which was also registered by Kern & Bookmyer (1986). Fig. 8 shows a comparison of the light curves obtained on 2011 June 21, when it was at the bright state, and on 2012 March 25 when it was at the lower state. The lower brightness state, which is about 0.3 mag fainter in this comparison, presents flickering with amplitude ten times smaller than the flickering observed in the higher state. In other occasions when the star was in this lower brightness state (2011 May 11 and 2012 March 26) the same flickering attenuation was observed.
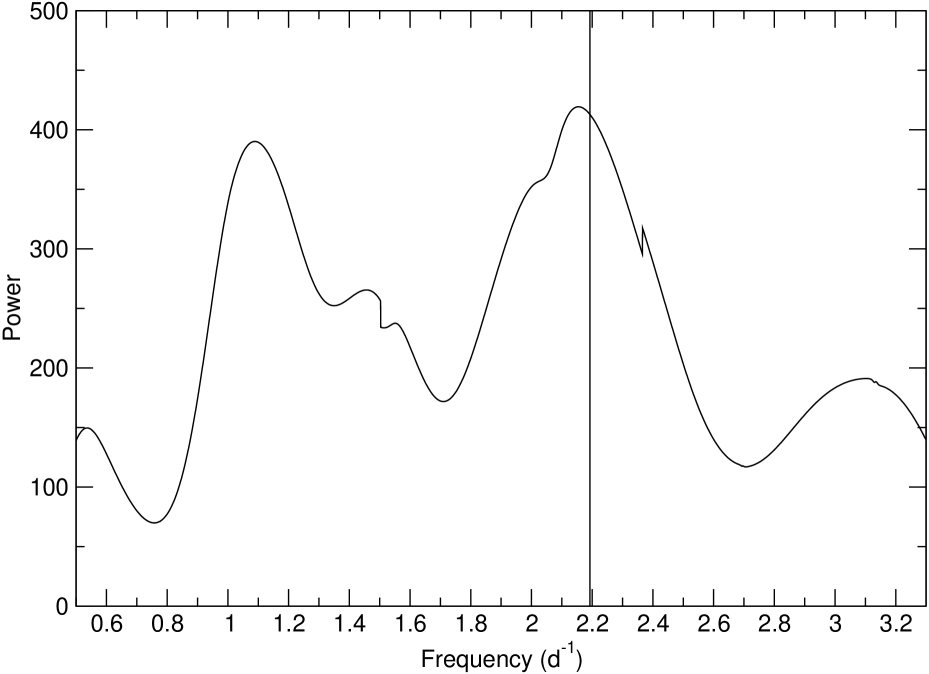
We applied the Lomb–Scargle method to search for periodicities in the photometric data. The periodograms constructed with the higher brightness level data do not show any relevant peak. On the other hand, despite the short length of the light curves, the periodogram of the lower state photometric data presents a period of h (Fig. 10) which is consistent with the 10.9 h period obtained from the He ii 4686 Å line radial velocities. In Fig. 11 we show the light curves of 2012 March 25 and 26 phased on the 10.94 h period. The amplitude of the modulation is about 0.15 mag. This appears to be the first photometric detection of an orbital modulation in QU Car and, if so, it occurred when the amplitude of the flickering had reduced from its typical value of 0.2 mag in the higher brightness state to mag in the lower state, unveiling the 0.15 mag orbital modulation. Photometric monitoring on QU Car were carried out by Schild (1969), GP82 and Kern & Bookmyer (1986) but no orbital modulation was detected.

4 Conclusions
An important result of this work is the recovery of the 10.9 h orbital period in the spectroscopic data of QU Car, but even more important may be the discovery of the long sought orbital modulation in the photometric observations. This orbital modulation has an amplitude of 0.15 mag and could be buried in the usual 0.2 mag flickering. The attenuation of the flickering when the system is in the lower brightness state was already noted by Kern & Bookmyer (1986) and is also observed in our data, and it seems that this attenuation is needed to unveil the photometric orbital modulation. It is worth to say that, in our photometry, QU Car was not seen in its lowest registered brightness level.
KAH08 suspected that the non-detection of the orbital modulation in their spectroscopic data could be related to the presence of a wind distorting the spectral line profiles. In addition to the line profile variations – LPV – the wind also manifests itself in the form of observed nebular lines and in the P Cyg profiles, and is a key ingredient of the Accretion Wind Evolution model for CBSS and V Sge stars. As a tool to investigate the LPV we applied the TVS method to our spectra, which showed that the He ii 4686 Å line, although used to map the radial velocities of the system, is heavily affected by the profile variations in a complex way.
As suggested by Drew et al. (2003) and KAH08 QU Car has many features that link it to the CBSS and V Sge classes, like the strong wind, nebular lines, high and low states, high accretion rate, luminosity and He ii/H line ratio. However one of the defining characteristics of the CBSS/V Sge stars are the O vi 3811–34 Å emission lines, which are absent in the spectrum of QU Car (Drew et al., 2003). The lack of detection of O vi is consistent with a lower degree of ionization in QU Car when compared to other CBSS/V Sge systems, but could be also due to variability in this line, like the one observed in the spectra of WX Cen (Oliveira & Steiner, 2004). The TVS method has proven to be a useful tool to enhance the signal of strongly variable O vi lines in noise dominated spectra of other V Sge candidates, as WR 7a (Oliveira, Steiner, & Cieslinski, 2003) and WX Cen (Oliveira & Steiner, 2004). Unfortunately our QU Car spectra do not cover the O vi line region (except for 2004 March 11, but then the noise dominated that region), so new bluer spectra combined with the TVS analysis are needed to search for this important feature.
In order to understand a system so variable as QU Car, extensive observations with several techniques are mandatory. Long term photometric observations, specially in the low state, are wanted to consolidate the photometric orbital modulation found in this work, and simultaneous photometric and spectroscopic data would provide means to investigate the correlation between the brightness states and the spectral lines behaviour.
Acknowledgements
A. S. Oliveira and H. J. F. Lima acknowledge FAPESP – Fundação de Amparo à Pesquisa do Estado de São Paulo – for financial support under grants 03/12618-7 and 10/12805-5.
References
- Drew et al. (2003) Drew J. E., Hartley L. E., Long K. S., van der Walt J., 2003, MNRAS, 338, 401
- Fullerton, Gies, & Bolton (1996) Fullerton A. W., Gies D. R., Bolton C. T., 1996, ApJS, 103, 475
- Gilliland & Phillips (1982) Gilliland R. L., Phillips M. M., 1982, ApJ, 261, 617
- Hachisu & Kato (2003) Hachisu I., Kato M., 2003, ApJ, 598, 527
- Hessman et al. (1984) Hessman F. V., Robinson E. L., Nather R. E., Zhang E.-H., 1984, ApJ, 286, 747
- Herbig et al. (1965) Herbig G. H., Preston G. W., Smak J., Paczynski B., 1965, ApJ, 141, 617
- Høg et al. (2000) Høg E., et al., 2000, A&A, 355, L27
- Kafka, Anderson, & Honeycutt (2008) Kafka S., Anderson R., Honeycutt R. K., 2008, AJ, 135, 1649
- Kafka, Honeycutt, & Williams (2012) Kafka S., Honeycutt R. K., Williams R., 2012, MNRAS, 425, 1585
- Kahabka & van den Heuvel (1997) Kahabka P., van den Heuvel E. P. J., 1997, ARA&A, 35, 69
- Kern & Bookmyer (1986) Kern J. R., Bookmyer B. B., 1986, PASP, 98, 1336
- Kozhevnikov (2014) Kozhevnikov V. P., 2014, Ap&SS, 349, 361
- McClintock, Canizares, & Tarter (1975) McClintock J. E., Canizares C. R., Tarter C. B., 1975, ApJ, 198, 641
- Maoz, Mannucci & Nelemans (2013) Maoz D., Mannucci F., Nelemans, G., 2013, preprint (arXiv:1312.0628)
- Oliveira & Steiner (2004) Oliveira A. S., Steiner J. E., 2004, MNRAS, 351, 685
- Oliveira, Steiner, & Cieslinski (2003) Oliveira A. S., Steiner J. E., Cieslinski D., 2003, MNRAS, 346, 963
- Oliveira, Steiner, & Diaz (2004) Oliveira A. S., Steiner J. E., Diaz M. P., 2004, PASP, 116, 311
- Perlmutter et al. (1999) Perlmutter S., et al., 1999, ApJ, 517, 565
- Riess et al. (1998) Riess A. G., et al., 1998, AJ, 116, 1009
- Scargle (1982) Scargle J. D., 1982, ApJ, 263, 835
- Schild (1969) Schild R. E., 1969, ApJ, 157, 709
- Steiner & Diaz (1998) Steiner J. E., Diaz M. P., 1998, PASP, 110, 276
- Steiner & Oliveira (2005) Steiner J. E., Oliveira A. S., 2005, A&A, 444, 895
- Steiner et al. (1999) Steiner J. E., Cieslinski D., Jablonski F. J., Williams R. E., 1999, A&A, 351, 1021
- Steiner et al. (2007) Steiner J. E., Oliveira A. S., Torres C. A. O., Damineli A., 2007, A&A, 471, L25
- Stephenson, Sanduleak, & Schild (1968) Stephenson C. B., Sanduleak N., Schild R. E., 1968, ApL, 1, 247
- Wang & Han (2012) Wang B., Han Z., 2012, NewAR, 56, 122
- Warner (1995) Warner, B., 1995, Cataclysmic Variable Stars. Cambridge University Press, Cambridge, UK
- Witham et al. (2007) Witham A. R., et al., 2007, MNRAS, 382, 1158