Softening of Roton and Phonon Modes in a Bose-Einstein Condensate with Spin-Orbit Coupling
Abstract
Roton-type excitations usually emerge from strong correlations or long-range interactions, as in superfluid helium or dipolar ultracold atoms. However, in weakly short-range interacting quantum gas, the recently synthesized spin-orbit (SO) coupling can lead to various unconventional phases of superfluidity, and give rise to an excitation spectrum of roton-maxon character. Using Bragg spectroscopy we study a SO coupled Bose-Einstein condensate of 87Rb atoms, and show that the excitation spectrum in a “magnetized” phase clearly possesses a two-branch and roton-maxon structure. As Raman coupling strength is decreased, a roton-mode softening is observed, as a precursor of the phase transition to a stripe phase that spontaneously breaks spatially translational symmetry. The measured roton gaps agree well with theoretical calculations. Further, we determine sound velocities both in the magnetized and the non-magnetized phase, and a phonon-mode softening is observed around the phase transition in between. The validity of the -sum rule is examined.
Roton and phonon are two typical excitation modes of superfluids. They were first introduced by Landau in his phenomenological explanation on superfluidity of liquid helium Landau , and an experimental observation was realized about two decades later helium . The emergence of roton mode in superfluid helium originates from strong density correlations. In weakly interacting ultrocold gases, long-range dipole-dipole interactions can induce a roton-maxson dispersion ODell2003 ; Shlyapnikov2003 , which were recently observed in a Bose-Einstein condensate (BEC) with cavity-mediated long-range interactions Esslinger2012 . Across the phase transition from a superfluid to a supersolid phase, a softening of roton mode was further demonstrated Esslinger2012 . An important question naturally arises: can an excitation spectrum of roton-maxon character be observed in a quantum gas with weak and short-range interactions?
Recently, artificial one-dimensional SO coupling has been synthesized in ultracold bosonic Spielman2011 ; Jinyi2012 and fermonic Jing2012 ; Zwierlein2012 atoms by two counter-propagating Raman lasers that couple the momentum of an atom to its spin Spielman2013 . The single-particle dispersion is significantly modified such that a degenerate double-well structure appears for some Raman-coupling strength . Despite that interatomic interactions are weak and short-ranged, these systems can exhibit many unconventional condensate phases. For 87Rb atoms, as increases, the ground-state phase diagram is predicted to include HoZhang2011 ; Yun2012 : a stripe phase of periodic density fringes that breaks translational symmetry, a “magnetized” phase breaking a discrete symmetry, and a non-magnetic phase. This rich structure of phase diagram has been largely supported by experiments Spielman2011 , and its finite-temperature analog has also been explored Cong2014 .
These recent vast experimental progresses in manipulating spin-orbit (SO) coupling pave a way to address the aforementioned question. It is recognized that superfluids with a tendency towards periodic order can have phonon- and roton-type excitation modes. In SO-coupled condensate of 87Rb atoms, the occurrence of the stripe phase preceding the magnetized phase indicates that the excitation spectrum in the latter exhibits a roton-maxon structure Stringari2012 ; zhengwei . As the phase boundary is approached, a roton-mode softening is further expected. In this work, we experimentally demonstrate such a structure, and thus provide the first direct experimental observation of roton mode and its softening in weak and short-range interacting systems.
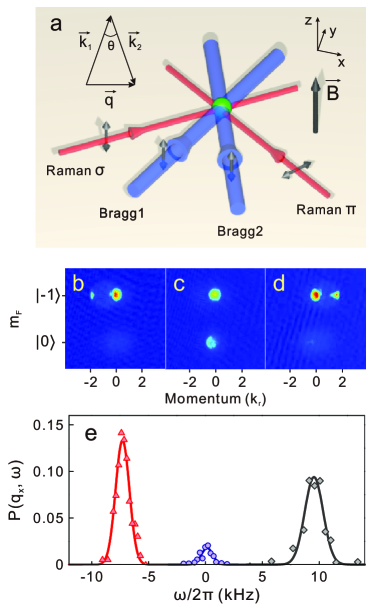
The experimental setup is sketched in Fig. 1a, sharing much similarity to our previous work Jinyi2012 ; Cong2014 . A BEC of about 87Rb atoms is prepared in a crossed dipole trap with frequency Hz. The two counter-propagating laser beams couple the three internal states of the F = 1 manifold, generated by a bias magnetic field. In addition, the BEC is illustrated by two Bragg beams with approximately parallel polarization, which are symmetric about the axis.
By a quadratic Zeeman shift with recoil momentum , the state is effectively suppressed, and the system can be regarded as a spin- system. The single-particle Hamiltonian along the SO coupling direction (the -direction) is given by ()
| (1) |
where is the atom mass, is the Raman coupling strength, and is the two-photon detuning, which is fine tuned to be in experiment. Symbols and represent the Pauli matrices, with for spin and for spin . For each given , Eq. (1) has two eigenstates with energy for the upper () and the lower () branch of single-particle dispersion zhengwei ; Hui2014 , respectively. The lower branch has two degenerate minima for (), denoted by , and has a single minima at for . With interatomic interactions of 87Rb atoms being taken into account, it has been shown Spielman2011 ; Yun2012 that for , atoms condense in a superposition of two components with opposite momenta , exhibiting the stripe order. For , this system maintains the magnetized phase, where atoms condenses at or . When , the single-particle dispersion has only one single minimum at zero momentum, and the Bose gas hence exhibits no magnetization, i.e., the non-magnetized phase.
The excitation spectrum of the magnetized phase is measured through Bragg spectroscopy Ketterle1999_1 ; Ketterle1999_2 ; Davidson2002 ; Vale2008 . We first prepare the BEC at the spin state , and adiabatically ramp up Raman coupling strength to the desired value. By this way, the condensate is at the minimum , where most of atoms are in the spin state . Then, we quickly switch on two Bragg lasers and hold them for ms. The Bragg beams have wavelength about nm and are detuned GHz away from the resonance. The angle between the two lasers (Fig. 1a) determines the momentum transfer (), while the frequency difference is tuned to produce an excitation. The Bragg pulse kicks a small percent of atoms out of the condensate cloud. The intensity of Bragg lasers is adjusted to excite at most atoms, such that the linear response theory applies Stringari_book . Finally, with the Stern-Gerlach technique, we take spin-resolved time-of-fight (TOF) images after 24 ms of free expansion. Three examples for are shown in Fig. 1b-d, which have , 1.77, and 1.77, respectively. The latter two have the same momentum transfer, but different frequency difference. It is worth noting that the spins of atoms in Fig. 1c flip when being kicked out from the condensate by the Bragg pulse. This is due to the lock of spin and momentum.
For each TOF image, the atom numbers, and , of the Bragg and the remaining condensate, are counted, and the ratio is calculated. According to the linear response theory Stringari_book , the excitation spectrum can be determined by the dynamic structure factor . An evaluation based on Fermi’s golden rule yields Ketterle1999_2 , where is the intensity of the Bragg lasers. We define excitation efficiency as , where is chosen such that is a dimensionless quantity. The excitation efficiency equals to the dynamic structure , apart from an unknown constant ; For a given momentum transfer , a broad range of frequency difference is scanned with Bragg laser intensity being fixed at an appropriate value. For , Fig. 1e shows the plot of the excitation efficiency versus frequency difference , for (red triangles) and 1.77 (purple circles and gray diamonds). For simplicity and comparison purpose, is taken as the Bragg-laser intensity for . It can be seen that there are two resonance peaks for momentum transfer , corresponding to the lower and the upper branch of the excitation spectrums, respectively. The measured data are fitted by a Gaussian curve, and the peak frequency is used to identify the excitation energy. The whole excitation spectrums for a fixed Raman coupling are then constructed by varying momentum transfer , see Fig. 2a for .
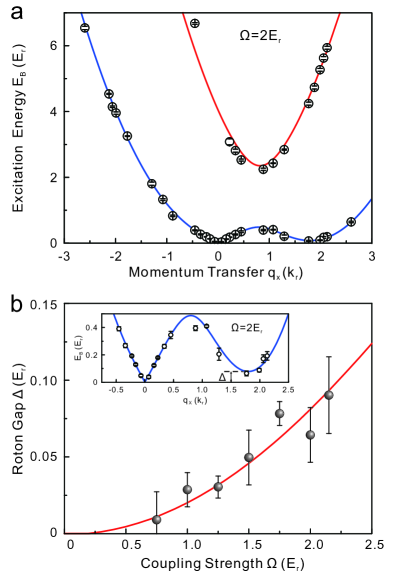
The excitation spectrum in the magnetized phase clearly shows a roton-type minimum at finite momentum around (see the inset of Fig. 2b). We measure the roton gap , defined as the excitation energy at the roton minimum, and find it soften as Raman coupling strength decreases (Fig. 2b). We calculate the roton gap based on a modified Bogoliubov theory Stringari2012 ; zhengwei , shown as the red solid curve in Fig. 2b. The experimental data agree well with theoretical calculations. As mentioned above, for 87Rb atoms, there is a phase transition near between the magnetized and the stripe phase, and accordingly, the roton gap is expected to vanish at . Unfortunately, our experimental data are not sufficiently accurate to figure out the precise location of . On the other hand, we do find that the roton-maxon structure disappears when is tuned above a large enough value (about in our experiment), suggesting that the roton mode is a precursor of the stripe phase with periodic fringes.
The observed softening of roton gap can find its origin in Raman-dressed interaction. In the presence of SO coupling, interatomic interaction becomes anisotropic Long2013 , and this anisotropy can be modified by tuning Spielman_Science . This can be revealed by calculating the interaction energy for a condensate of different components. As shown in Ref. Spielman2011 , for 87Rb atoms, we have interaction energy , where the spin-independent interaction Hzcm3, the spin-dependent interaction Hzcm3, and and respectively represent the spatial density of the components at and . This means that the interaction energy for a condensate of two dressed components has additional energy terms compared to the energy for a single-component condensate at or . Accordingly, one can give an estimation of the roton gap as for with for the condensate density and marking the phase transition point between the stripe and the magnetized phase.
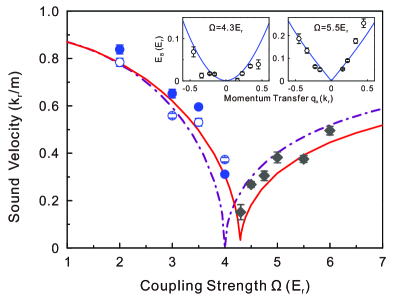
We also measure sound velocities both in the magnetized and the non-magnetized phase, and find a softening of the phonon mode near the phase transition between these two phases. In the magnetized phase, the excitation spectrum exhibits linear dispersions in the long wavelength limit, i.e. for and for ; see the inset of Fig. 2b. Here () is the sound velocity in the negative (positive) -direction. The measured velocities and are almost identical for a given (Fig. 3), since the interaction difference in 87Rb atoms is very small Stringari2012 . The values of and decrease as is enhanced, and reaches a minimum near the phase transition that is slightly above , as shown in Fig. 3. For , heating from Raman lasers makes it difficult to adiabatically load BEC into the minimum, and the condensate starts to oscillate in the trap during the Bragg pulse. To minimize any effect of induced Doppler shift, the sound velocity in the non-magnetized phase is taken as the average of the values for and . Nevertheless, it is still clear that the sound velocity increases with the coupling strength.
The non-monotonic behavior of the sound velocity as shown in Fig. 3 can be interpreted by the modification of single-particle dispersion. With the effective-mass approximation, the sound velocity ( is assumed) can be written as zhengwei . Here the effective mass is given by for and for . This shows that the vanishing of sound velocity originates in the divergency of the effective mass at , which marks the transition point between the magnetized and the non-magnetized phase. However, the Bose gas in our experiment is not a pure spin- system. Due to the influence of the suppressed state , the value of sound velocity cannot drop to zero and the transition point is shifted to about (Fig. 3).
Phonon mode softening indicates that at the transition point, the Bose gas should exhibit no superfluidity when an impurity moves inside with finite velocity in the SO coupling direction. It should be pointed out that due to the absence of Galilean invariance Jinyi2012 in SO coupled system, a moving SO-coupled Bose gas has different excitation spectrum from what we measure in Fig. 2, and softening of phonon mode is prevented in the comoving frame zhengwei .
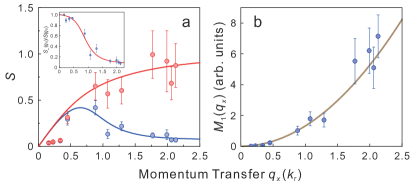
Finally, we examine sum rules in this unconventional system with SO coupling. Beside the excitation energy identified by the resonance peak position, the measured excitation efficiency carries additional rich information. This is reflected by Fig. 1e, where the heights of the three resonance peaks are significantly different. The sum rules Stringari_book are about the behavior of moments of the dynamic structure, defined as , where is an integer. The zeroth-order moment for is proportional to the static structure factor as , where is the number of atoms. The famous -sum rule is about the energy-weighted moment , and states that , where is the mass of atom. The validity of the -sum rule in SO coupled system has been theoretically examined in Ref. Stringari2012 . In Fig. 4a, we plot the static structure factor for as a function of (the red circles), where constant is chosen such that among the measured data, the maximum of is equal to unity. The blue circles in Fig. 4a represent the contribution from the lower branch of excitation spectrum. The solid lines in Fig. 4a are obtained from theoretical calculations based on local density approximation. They agree with experimental data, except for those three points with very small momentum transfer . The relative contribution is shown in the inset of Fig. 4a, which rapidly decreases as the momentum transfer becomes larger. The measured 1st moment for is plotted versus in Fig. 4b. These experimental data can be well described by a quadratic curve, demonstrating the validity of the -sum rule at least in the magnetized phase.
We have shown that despite interatomic interactions are weak and short-ranged, the SO coupled 87Rb condensate has an excitation spectrum of roton-maxon character in the magnetized phase, which softens near the phase transition to the stripe phase. The sound velocities are also measured and a phonon-mode softening is observed. We mention that in condensed-matter physics and ultracold atomic physics, measurement of excitation spectrum is in itself of important role in revealing the properties of low-temperature phases Griffin_book . The observed linear dispersion near is an important feature of superfluidity. Further, the measured roton-maxon structure of excitation spectrum, its disappearance for large , and the softening of the roton gap, strongly support the predicted ground-state phase diagram for of the SO coupled Bose gas of 87Rb atoms.
We acknowledge insightful discussions with H. Zhai, C. Chin, S. Stringari, Y. Li, and Z. Q. Yu. This work has been supported by the NNSF of China, the CAS, the National Fundamental Research Program (under Grant No. 2011CB921300).
⋆⋆ These authors contribute equally to this work.
References
- (1) L. D. Landau, J. Phys. (Moscow) 5, 71 (1941).
- (2) J. L. Yarnell, G. P. Arnold, P. J. Bendt, and E. C. Kerr, Phys. Rev. Lett. 1, 9 (1958).
- (3) D. H. J. O’Dell, S. Giovanazzi, and G. Kurizki, Phys. Rev. Lett. 90, 110402 (2003).
- (4) L. Santos, G. V. Shlyapnikov, and M. Lewenstein, Phys. Rev. Lett. 90, 250403 (2003).
- (5) R. Mottl, F. Brennecke, K. Baumann, R. Landig, T. Donner, and T. Esslnger, Science 336, 1570 (2012).
- (6) Y.-J. Lin, K. Jiménez-García, and I. B Spielman, Nature 471, 83 (2011).
- (7) J.-Y. Zhang, et al., Phys. Rev. Lett. 109, 115301 (2012).
- (8) P. Wang, et al., Phys. Rev. Lett. 109, 095301 (2012).
- (9) L. W. Cheuk, et al., Phys. Rev. Lett. 109, 095302 (2012).
- (10) V. Galitski and I. B. Spielman, Nature 494, 49 (2013).
- (11) T.-L. Ho and S. Zhang, Phys. Rev. Lett. 107, 150403 (2011)
- (12) Y. Li, L. P. Pitaevskii, and S. Stringari, Phys. Rev. Lett. 108, 225301 (2012).
- (13) S.-C. Ji, et al., Nat. Phys. 10, 314 (2014).
- (14) G. I. Martone, Y. Li, L. P. Pitaevskii, and S. Stringari, Phys. Rev. A 86, 063621 (2012).
- (15) W. Zheng, Z.-Q. Yu, X. Cui, and H. Zhai, J. Phys. B: At. Mol. Opt. Phys. 46, 134007 (2013).
- (16) H. Zhai, Rep. Prog. Phys., http://arxiv.org/abs/1403.8021v1.
- (17) J. Stenger et al., Phys. Rev. Lett. 82, 4569 (1999).
- (18) D. M. Stamper-Kurn et al., Phys. Rev. Lett. 83, 2876 (1999).
- (19) J. Steinhauer, R. Ozeri, N. Katz, and N. Davidson, Phys. Rev. Lett. 88, 120407 (2002).
- (20) G. Veeravalli, E. Kuhnle, P. Dyke, and C. J. Vale, Phys. Rev. Lett. 101, 250403 (2008).
- (21) L. P. Pitaevskii and S. Stringari, Bose-Einstein Condensation (Oxford University Press, New York, 2003).
- (22) L. Zhang, Y. Deng, and P. Zhang, Phys. Rev. A 87, 053626 (2013).
- (23) R. A. Williams, et al., Science 335, 314 (2012).
- (24) A. Griffin, Excitations in a Bose-Condensed Liquid (Cambridge University Press, New York, 1993)