Single 20 meV boson mode in KFe2As2 detected by point-contact spectroscopy
Abstract
We report an experimental and theoretical investigation of the electron-boson interaction in KFe2As2 by point-contact (PC) spectroscopy, model, and ab-initio LDA-based calculations for the standard electron-phonon Eliashberg function. The PC spectrum viz. the second derivative of the characteristic of representative PC exhibits a pronounced maximum at about 20 meV and surprisingly a featureless behavior at lower and higher energies. We discuss phonon and non-phonon (excitonic) mechanisms for the origin of this peak. Analysis of the underlying source of this peak may be important for the understanding of serious puzzles of superconductivity in this type of compounds.
pacs:
71.38.-k ,73.40.Jn, 74.70.DdI INTRODUCTION
The superconductivity in iron-pnictides and chalchogenides (FeSC), and in particular the doping, pressure, and disorder dependencies of the superconducting critical temperature are still under lively discussions since their discovery more than five years ago. More importantly, the question of the nature of the bosonic glue for Cooper pair-mediated superconductivity is still open.
In order to estimate the conventional contribution of phonons to the Cooper pairing, immediately after the discovery of FeSC, the spectral function of the electron-phonon interaction (EPI) has been calculated from first principles for a number of FeSC by different authors Boeri2008 ; Subedi2008 ; Mazin2008 ; Yildirim2009 . All calculations showed that the EPI is not strong enough to get values exceeding a few K. Later it was shown that considering a magnetic or paramagnetic ground state, i.e. a state with large local magnetic moments at the Fe sites, leads to a 50 enhancement of the electron-phonon (EP) coupling. Boeri2010 ; Yndurain2011 However, even this effect is not enough to yield critical temperatures above a few K, and is thus insufficient to explain the high of FeSC. Based on these finding, pure phonons were excluded as a leading glue for Cooper pairing.
Currently, two main scenarios for Cooper pairing in the pnictides are under debate. The first is the inter-band spin-fluctuation scenario which, at optimal doping, favors s±-wave superconductivity, characterized by gap functions with opposite signs on the electron (-point centered) and hole (-point centered) surface sheets. Mazin2008 ; Kuroki2008 The second scenario is based on the interplay of orbital fluctuations with conventional electron-phonon coupling. In this case superconductivity exhibits ordinary s++-wave symmetry, i.e. the gap functions show the same sign on the electron and hole Fermi surface sheets Kontani2012 . For the transition regime between these limiting cases due to disorder see Ref. Efremov2011, . In this scenario, a small bare EP coupling constant ( 0.2) can be so strongly enhanced by orbital fluctuations to cause -wave superconductivity with reasonable critical temperatures. Given the discrepancy between the various theoretical scenarios, it is highly desirable to obtain an independent estimate of the actual coupling of electrons to various bosonic excitations from an experimental source.
Point-contact (PC) spectroscopy (PCS) Naidyuk2005 is one of the few available tools to address this question, because it permits to measure the spectral function for the interaction of conduction electrons with different types of bosonic excitations: phonons, paramagnons (spin fluctuations), crystal-electric field excitations, etc. In particular, several authors have recently underlined the potential importance of PCS in iron pnictides and chalchogenides, as a tool to identify new featuress due to the interplay of strong electronic correlations with spin and orbital fluctuations, close to an orbital-selective Mott transition. Arham12 ; Greene12 ; Gonnelli2013 .
In PCS, the second derivative of the curves of the ballistic PC, in other words the PC spectrum, represents directly the spectral function of the interaction of conduction electrons with phonons or other bosonic excitations (electron-boson interaction, EBI).Kulik1977 ; Kulik1992 ; Jansen1980 ; footnote2 .
In order to obtain reliable results the measurements have to be performed at temperatures considerably lower than the characteristic energy of the bosonic excitations. The underdoped compound KFe2As2 (K122), with a low critical temperature K, is thus one of the best candidates in the 122 family of FeSC for studying of PC spectra in the normal state. It is also the only member of this family where nodal superconductivity, probably of -wave nature, has been reported. Reid2012 ; Abdel2013 ; Grinenko2014
In this paper we present a combined experimental and theoretical study of the PC spectra of K122. We find that the PC spectrum as a function of grows nearly linearly at small , has a maximum at meV, and then decays as . Such a behavior can hardly be attributed to phonons or pure spin fluctuations. Based on a simplified analytical model of the underlying electronic structure, we propose that this feature is due to excitonic charge excitations.
The outline of the paper is the following. After a short introduction into the theory of PCS, we present our PC spectra and discuss them first in terms of a standard EP model. We then show the outcome of a linear response dfpt ; qe calculation for the EPI spectrum of K122, which shows a relatively featureless spectrum, with a very weak total EPI. This is incompatible with the measured PC spectrum. In the following section we introduce a novel scenario involving charge excitations into the empty electron pockets. We conclude discussing the physical consequences of our findings and prospects for further work.
II PCS OF BOSONIC EXCITATIONS
PCS is a direct tool to study the EBI. According to the general theory of PCS, Kulik1977 ; Jansen1980 the second derivative of the curve in case of a ballistic PC is given by the energy derivative of the scattering rate. Among the various contributions to the scattering rate, inelastic spin and charge interband scattering, as well as diagonal and off-diagonal EBI can be identified. First, we consider the most common case of EBI. In this case the second derivative of the curve of the ballistic PC is directly proportional to the electron-boson spectral function Kulik1992 :
| (1) |
where is the differential PC resistance, is the electron charge, is the PC diameter and is the Fermi velocity. Hence, we yield:
| (2) |
The spectral information can be extracted if the size of PC (i.e. the contact area with the K122 single crystal) is less than the elastic () and inelastic () mean free path of electrons (), i.e. in the case of ballistic contacts. Spectroscopy is also possible under a less strict condition, i.e. also in the case that only () is larger than the contact size . This is, so-called, diffusive regime (). In both cases electrons are accelerated in the PC up to a maximum energy =, and varying the applied voltage allows energy-resolved spectroscopy. The opposite limit is the thermal regime () of the current flow. In this case the electron transport behaves like in the bulk material, which results in Joule heating: the temperature in the PC core increases with the applied bias voltage Naidyuk2005 ; Verkin1993 .
It is important to point out that the PC EBI function differs from the Eliashberg thermodynamical EBI function by a factor due to the kinematic restrictions for the electron scattering processes in the contact. For spherical Fermi surfaces, the PC spectral functions are obtained averaging the -dependent thermodynamical spectral functions with a weighting factor 1/2(1-/tan) over the angle formed by the incoming (k) and outgoing (k’) momenta of the electrons. Evaluating the corresponding average for K122, which possesses multiple and highly anisotropic Fermi surface sheets, is a non-trivial task which deserves a theoretical study by itself, and is therefore beyond the scope of the present work.
PCS can provide useful information on the boson modes coupled to electrons, even without a detailed knowledge of the electron scattering processes taking place in the contact Naidyuk2005 ; Kulik1977 ; Kulik1992 . In fact, this is a very powerful tool to identify candidates for the pairing glue and for the mass renormalization observed in the electronic specific heat in the normal state at low temperatures. In principle, it is possible to extract the EBI functions also from PC spectra in the superconducting state. However, the features of the PC spectra induced by the superconducting state, such as the Andreev-reflection or the critical current (self-magnetic field) effects, are much stronger than those due to EBI, at least in the energy range of the order of superconducting gap value. Therefore, the EBI spectral function is usually extracted from PC spectra measured in the normal state, that is, above or above the upper critical field in the case of type-II superconductors.
In FeSC, PC measurements above (typically in the range of 30–55 K) will yield little information, since the energy resolution in the PCS Naidyuk2005 decreases with increasing temperature and amounts to about 20 meV at 40 K. To circumvent this difficulty, we decided to carry out our first measurements on K122, where K. We expect that, although in this compound is low in comparison with 40 K for optimally doped 122 FeSC, the main bosonic features in the PC spectra could be similar in systems with a lower hole doping, closer to the magnetic parent compounds (Ba-112 or Sr-122). This is partly confirmed by our first-principles calculations, which show a quite similar distribution of the EPI for K122 and Ba122 (compare Fig. 4 and Ref. Boeri2010, ). A further advantage of K122 is the large electron mean free path, compared to that of doped FeSC, due to a lower amount of disorder, that could makes it easier to realize ballistic contacts required by the PCS.Naidyuk2005 ; Kulik1977 ; Kulik1992 .
III EXPERIMENTAL DETAILS
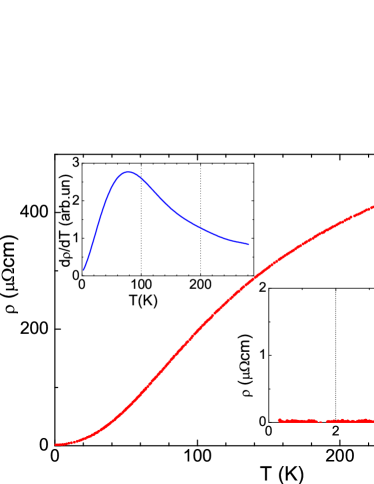
High-quality K122 single crystals were grown using the self-flux method as described in Refs. Abdel2012 ; Abdel2013 . Their lateral dimension was as large as mm2 and the thickness is up to 0.1 mm. The onset of the superconducting transition is slightly below 4 K (see Fig. 1, right inset). The temperature dependence of the resistivity has a typical metallic behavior with low residual resistivity (see Fig. 1) and quantitatively it is similar to that of Ref. Rotter2008, , where the high- superconductivity in 122 FeSC was reported for the first time. The PCs were established by the conventional “needle-anvil” technique Naidyuk2005 , touching a cleaved single crystal surface with a sharpened thin Cu or Ag wire. A first set of measurements with a Cu needle has been carried out at the IFW (Dresden), and a second set of measurements with an Ag needle have been performed on a different batch of single K122 crystals in the ILTPE (Kharkiv). The differential resistance signal and the second derivative signal , were recorded by sweeping the dc current on which a small ac current was superimposed using the standard lock-in technique. Here and are the amplitudes of the first and the second harmonics of the modulating signal, respectively, such that and are related by . The measurements of our PC spectra were performed in most cases at 4 K.
IV RESULTS AND DISCUSSIONS
IV.1 RESULTS
We have measured the characteristics for more than one hundred K122–Cu (or Ag) PCs. We can distinguish mainly two types of PC spectra.
The majority of the measured curves has a broad maximum whose position varies for different contacts between 35 and 60 meV, and whose FWHM is between 40 and 60 mV. In general, the shape of these spectra is similar to the derivative of the resistivity , shown in Fig. 1 (left inset) and for that reason not shown here. We would like to note that the differential resistance for these PCs increases by a factor 100–300% from 0 to 100 mV. This is typical for PCs in the thermal regime (see, e.g. Refs. Naidyuk2005, ; Naidyuk2014, ). We have also calculated the curve expected in the thermal regime using Kulik’s formula (see Eq. (3.23) in Ref. Naidyuk2005, and Refs. Kulik1992, ; Verkin1993, ). The calculated curves have a shape similar to the shown in Fig. 1 (left inset). The variation of the position of the maxima in for different PCs can be explained supposing that the in the PC core is modified due to an imperfect surface and to additional stress/perturbation induced by the formation of the PC etc. We infer that in this case the current regime in the contact is thermal.
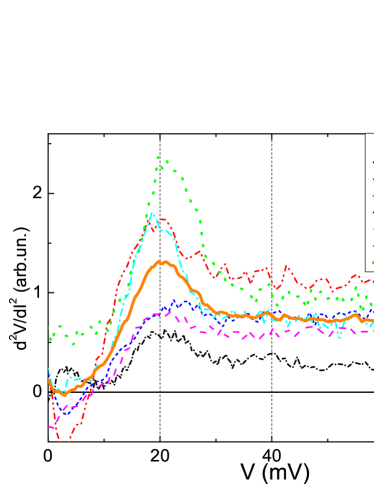
We suppose that, instead, the second type of spectra we observed correspond to a spectroscopic (ballistic or diffusive) regime of the current flow in PCs. Typical curves for such PCs are shown in Fig. 2. All these curves look similar to each other and display a clear maximum at about 20 mV with a subsequent background behavior. The relative change of for such contacts is below 10 %, i.e. one order of magnitude smaller than for the PCs in the thermal regime.
In order to exclude that the 20 meV feature we observed is due to extrinsic effects, for instance caused by the Cu counterelectrodes, we have carried out measurements with both Cu and Ag needles. The transverse phonons, which may in principle contribute to the PC spectra, are located between 15 and 20 meV in Cu Naidyuk2005 and at 11–13 meV in Ag.Naidyuk2005 But, as clearly seen comparing Fig. 2 with Fig. 3, in both sets of measurements the maximum remains at 20 meV, which indicates that this feature is solely due to intrinsic K122 excitations.
Usually phonon excitations are considered as the most likely candidates to explain peaks in PC spectra in conventional superconductors. Their possible contribution in K122 will be considered in the next subsection.
Spin fluctuations (or paramagnons) also give rise to characteristic features in the PCS, as shown in Ref. Naidyuk1993, .
In K122, the inelastic neutron scattering spectra show a broad peak centered at meV at = 12 K Lee2011 . A very close estimate of the characteristic boson frequency for spin fluctuations can also be extracted from the approximate scaling law: for spin fluctuations (see Fig. 1 in Supplement S1 of Ref. Curro2005, ). This approximate relation is satisfied by many classes of unconventional, -wave like superconductors, such as heavy-fermion, Pu-based compounds, and high- cuprates. In K122, with 4 K, expected would be 100 K ( 10 meV), i.e. a factor two smaller than the position of the 20 meV maximum in our spectra. Therefore it is rather unlikely that the maximum in the PC spectra around 20 meV is due to spin fluctuations.
Also tempting to relate our observations with recent STM/STS experiments Shan12 ; Wang2013 , which reported a strong dip in the tunneling spectrum at the energy 21.50.8 meV. This feature was observed Wang2013 in two different systems, Ba0.6K0.4Fe2As2 and Na(Fe0.975Co0.025)As and it vanishes inside the vortex core or above . This dip was attributed to the bosonic mode, which should appear in the tunneling spectra in the superconducting state of a strong coupling superconductor at an energy offset by the gap value. In this case the bosonic mode energy would be about 14 meV, that is not consistent with our 20 mV maximum. Interestingly, this dip is gradually smeared out with increasing , but it does not change the position.
ARPES measurements have been reported in a recent study of BaFe1.9Pt0.1As2 (see Ref. Ziemak2014, ). A bosonic energy of about 15 meV can be estimated from the peak-minimum distance from their data given in Fig. 7(d). This value is rather close to 14 meV for the related systems mentioned above.
IV.2 AB-INITIO CALCULATION OF THE EPI
In order to estimate the contribution of phonons to the PC spectra we have calculated the EPI properties of K122 ab-initio with density functional perturbation theory, using plane-waves and pseudopotentials. dfpt ; qe ; technical . The typical numerical accuracy of such calculations amounts to meV (6 K) for phonon frequencies, and to 10 on the EP coupling constants. We employed the structural data of Ref. Rosza81, – space group .
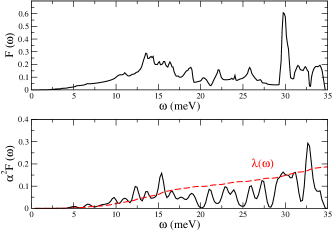
Fig. 4 shows the calculated phonon density of states and the EPI spectral function , defined as:
| (3) | |||||
where is the number of k-points used in the summation, is the density of states per spin at the Fermi level, and are the phonon frequencies. The EPI matrix element is defined by the variation of the self-consistent crystal potential with respect to a frozen phonon displacement according to the phonon eigenvector . The dashed line in Fig. 4 (low panel) is the the value of the frequency-dependent partially integrated EP coupling :
| (4) |
We first notice that the shape of the phonon density of states of K122 bares a strong resemblance to that of other 122 FeSC, which typically extend up to 40 meV. The high-lying modes are in-plane vibrations of Fe and As atoms; out-of-plane vibrations are centered around 20 meV, and the lowest modes ( meV) have a substantial contribution from the K atom. For the and modes at the point we obtain a frequency of 24 and 27 meV, respectively. Our calculated spectrum has a Debye frequency of 261 K, which is in quite good agreement with the low-temperature specific heat data of Ref. Grinenko2014, and Kittaka14, ; remdebye, , which report K and =274 K, respectively. We expect that the theoretical Debye frequencies would be even closer to experiment, if we took into account the slight lattice contraction at low temperatures.
The , shown in the lower panel, exhibits a rich structure with numerous peaks, as in the case of optimally doped pnictides and chalchogenides, where the filling of the orbitals is near . Boeri2008 ; Subedi2008 Such a relatively unstructured spectral function, i.e. without a few especially pronounced maxima, is characteristic of compounds with a weak EP coupling. With respect to those spectra, in K122 we observe a slight reduction of the coupling to the As out-of-plane modes centered around 24 meV, and a substantial increase of coupling to the Fe and As in-plane modes at high frequencies ( meV).
The total EP coupling constant, obtained by integrating Eq. (4) up to the highest frequency of the spectrum, is , i.e. comparable to the values obtained in the pnictides, Boeri2008 ; Subedi2008 and a factor three too low to explain the experimental of 3.5 K. The modes between 15 and 25 meV contribute about one third of the total coupling constant, i.e. . Including magnetic fluctuations would enhance this value at most by a factor of two – . Boeri2010 We believe that such an extremely low value would almost be invisible in the PC spectra, also taking into account the kinematic factors which make different from the ordinary ) calculated here. Notice also that in our PC spectra we do not resolve any of the other phonon modes with smaller and larger energies, which in the calculations have a coupling comparable or even larger than the out-of-plane modes. This is an indirect indication that the effect of phonons on the PC spectra is indeed negligible. Our ab-initio calculations thus show that, at least from the point of view of standard Eliashberg theory, the feature observed near 20 meV cannot been ascribed to a phonon mode. Thus we are forced to look for an alternative non-phonon scenario, which we discuss below.
Before proceeding in our analysis, we would like to note that a quantitative theoretical model of EBI spectral functions in K122 should also take into account the fact that for the -wave superconductivity Reid2012 ; Abdel2012 ; Grinenko2014 the spectral functions responsible for the mass enhancement and the pairing interaction Abdel2012 have different expressions.
IV.3 ALTERNATIVE NON-PHONON SCENARIO
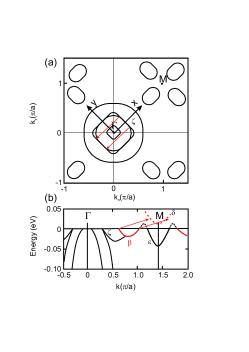
We now suggest a possible alternative to phonons or spin fluctuations scenario. We need to remind the reader about three specific features of the electronic structure of the compound under consideration. First, K122 is nearly two dimensional. Second, K122 is strongly hole doped – i.e. Fe is in a nominal d5.5 configuration, so that one of the bands which are partially filled in optimally doped 122 systems and form the electron pockets of the Fermi surface is unoccupied but still close to the Fermi-energy . Third, one of the hole bands near the -point has an almost square cross-section, as shown in Fig. 5.
.
For a thorough discussion of the electronic structure, including orbital-resolved pictures of the Fermi surface, see e.g. Refs. OKA2011, , haule, and Valenti2014, .
Although there are quantitative differences between LDA and LDA+DMFT calculations haule , for example in the relative position and size of the hole pockets, and between these and ARPES and de-Haas-van-Alphen experiments, Sato2009 ; Yoshida2012 ; Terashima2013 ; Valenti2014 , these three basic features are robust.
In most FeSC around optimal doping, i.e. near , the Fermi surface comprises hole and electron sheets, centered around the and points of the Brillouin zone. Two hole pockets derive from bands of character, which are degenerated at the point, and the third has typically or character. Around the M point, two bands of and character form two elliptical pockets, with main axes along the () and () directions. In K122 (), the Fermi level is shifted eV below that of . The volume of the hole pockets is expanded, and that of the electron pockets is reduced. At the M point, the bottom of the band, which forms the inner part of the double-elliptical electron Fermi surface sheets for , is raised a few tenths meV above the Fermi level. Instead of a double ellipse, the Fermi surface now comprises 4 small “propellers”, along the ()and () directions. At the same time, one of the hole pockets acquires a square-like cross-section. A sketch of the electronic structure of K122, adapted from the ARPES data of Ref. Sato2009 ; Yoshida2012 , is shown in Fig. 5. The top panel (a) shows the Fermi surface, with three large hole pockets around the point, and four “propeller blades” around the M point. The two red arrows indicate the nesting vector of the square () Fermi surface ().
The complicated electronic structure of K122 has important consequences on the PC spectra. According to the theory of PCS Kulik1977 ; Jansen1980 , the leading contribution to the energy dependence of the resistance in PCs is the back-scattering of the quasiparticles due to their interaction with bosons. In this particular case, the scattering from a point to a point on the Fermi surface sheet, shown in Fig 5(a) is also compatible with the excitation of indirect excitons with .
Indeed, Fig. 5(b) shows that along the direction the shallow band which forms the outer hole Fermi surface and the outer parts of the propellers can be almost exactly translated on top of the unoccupied electron band , for and 20 meV. The portion of this shallow band which lies below , denoted as in the following, is strongly anisotropic, and concentrated in a small region of and energy space. As a consequence, the electron-hole excitations to the pocket are strongly peaked in energy and momentum space. This makes the possible charge excitation spectrum of K122 very different from that of usual isotropic materials, where the scattering on the electron-hole continuum leads to a featureless resistance contribution.
To find the contribution of these excitations to the PC spectrum we start from the general expression for the back-flow current Jansen1980 :
| (5) |
is a weighting factor depending on the incoming and outgoing momenta ; note that is also affected by various properties of a real PC. For the scattering of an electron inside the -band from one to the opposite side of the Fermi surface (shown with red arrows in Fig. 5(a)), for the sake of simplicity we adopt the approximation const., often found in literature. The average in Eq. (5) is defined as: ; here we assume . Approximating the transition rate between an initial state and a final state with the probability of creating indirect excitons with the energy , we get:
| (6) |
We now introduce analytical approximations for the dispersion of the relevant bands. In particular, for the band we assume a linear dispersion: ; for the band a parabolic spectrum, centered around the point: . Furthermore, we approximate the dispersion of the electron-like pocket, centered around , and extending in the direction, as . We further assume and neglect the contribution to the kinetic energy. A straightforward calculation yields:
where is the Fermi-velocity in the band , and . The charge excitations (excitons) give rise to a differential conductivity which starts abruptly at , and decays at high energies as . This expression gives a very good fit of the behavior of experimental PC spectra at large frequencies.
In order to fit the experimental spectra also at low frequencies, we consider an additional contribution to the back-flow, due to spin fluctuations; the empirical spectral density is given by
| (8) |
Here, we set meV, from the inelastic neutron scattering data at = 12 K Lee2011 ; Wang2013 . For the present analysis, we are more interested in the asymptotic behavior of for , which translates into a decay of the differential conductivity than in the the precise value of . Thus, the total differential conductivity reads:
where , are multiplicative factors which account respectively for the (unknown) area of the PC and for the relative weight of the excitonic and spin-fluctuation contribution to the spectral function; 120 meV.
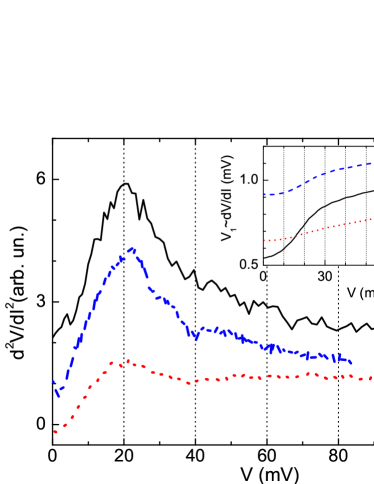
Representative examples of the measured second derivatives of the curves are shown in Fig. 6 together with fits through Eq. (IV.3). The experimental data correspond to two K122–Ag spectra with different resistance, the fitting parameters are reported in the caption of Fig. 6.
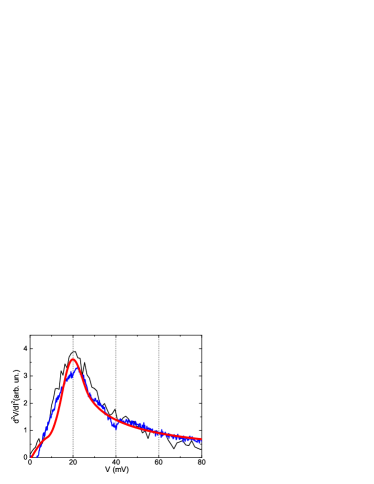
In all cases, the experimental spectra show a clear 1/ decay at high energies, which is not captured by the spin-fluctuation term; this behavior is also incompatible with phonons, which have a finite spectrum, and thus PC spectrum has constant value Naidyuk2005 above Debye energy of 40 meV. On the other hand, the excitonic contribution Eq. (IV.3) has a 1/ tail. A finite spin-fluctuation term () in Eq.IV.3 is needed to account for the spectral weight at low frequencies ().
The charge excitation (excitonic) mechanism proposed here has clear fingerprints, distinct from usual phonon excitations, which should be easy to detect experimentally. We propose a few experimental tests, which would definitely confirm our scenario and rule out the possibility that the 20 meV peak is due to coupling to -axis phonons.
First of all, our model predicts a strong dependence of the peak position on , which is shifted to higher(lower) values upon hole(electron) doping. This is in stark contrast to what is expected for phonons, since it is known that the phonon frequencies in pnictides depend only weakly on the doping. PC studies of samples with different dopings could then be used to check our scenario.
Another possibility is to use high resolution EELS (in reflection) Ibach1993 probing the longitudinal density-density response i.e. the in-plane polarizations: this would help to distinguish -axis polarized phonon modes at meV from the in-plane low-lying non-vertical interband transition proposed here. Its high resolution, up to 0.5 meV, may also be able to reveal further details of the electronic structure. Note that EELS would be able to detect nonmagnetic singlet excitons, while to detect magnetic triplet excitons spin-polarized inelastic neutron scattering should be used instead.
More theoretical and experimental studies are required to clarify the interplay of charge excitations with other degrees of freedom in (doped) K122. For example, in doped samples, it would also be essential to understand the effects of deviations from stoichiometry, on disorder, and/or electronic correlations on the PC spectra; this is particularly crucial in FeSC due to the contiguity of an orbital selective Mott transition. Mottsel ; Medici2012 These measurements may also help to gain further insight on the strength of the EPI and details of the total mass renormalization and their interplay with -wave superconductivity.
This interplay depends on the magnetic nature of the excitons under consideration. In case of non-magnetic singlet excitons, if -wave superconductivity is suppressed due to a strong enough pair-breaking disorder, the residual superconductivity, if any at all, might be of the -wave type. In this case, the excitonic mechanism proposed here would act as a non-flipping-spin charge excitation process. Like phonons, it would therefore compete with spin fluctuations in case of -wave superconductivity, and support superconductivity in case of an pairing regime with accidental nodes, or another complex pairing-regime induced by disorder.
We will now try to estimate the contribution of excitons to the total coupling constant for the EBI.
Since in clean samples a transition to an pairing regime has not been observed, nonmagnetic excitons compete with spin-fluctuations and therefore we expect:
| (10) |
Indeed, several experimental evidences point to a -wave symmetry in clean samples. For example, the low- of K122 fits very well the empirical relation for several -wave superconductors Moriya2003 ; Curro2005 :
| (11) |
if we use for meV K, extracted from inelastic neutron scattering measurements Lee2011 and 3.6 K. Grinenko2014
In case of wave symmetry with accidental nodes on one sheet of the Fermi surfaces, only, one would expect a significantly higher , intermediate between the -wave value and that of a nodeless gap.
Substituting our calculated , and to 0.8 deduced from a previous Eliashberg analysis Abdel2013 ; Grinenko2014 into Eq. (10) we can estimate an upper bound for . In this estimate it is assumed that we deal with singlet-excitons, only.
In the case of triplet excitons the observed peak would be a special type of spin fluctuation visible in the magnetic inelastic neutron scattering spectra at low temperature. In the triplet case the magnetic excitons would support a -wave type of superconductivity. In this context very recent inelastic neutron scattering data obtained by Wang et al. Wang2013b at K for K122 are of interest. According to these authors there is practically no spectral weight above about 20 meV for magnetic excitations. Then one might conclude that a magnetic exciton scenario is rather unlikely.
V CONCLUSION
We have investigated PC spectra in the normal state of the low- iron-pnictide compound K122. A single maximum at about 20 meV has been observed. In this work, we have proposed a novel nonphonon and nonmagnetic scenario to interpret the PC spectra, based on the presence of unoccupied electron bands close to Fermi energy.
This scenario is strongly supported by a DFT linear response calculation of the Eliashberg EPI function and of the corresponding EP coupling constant , which shows an extremely low coupling for phonon modes between 15 and 25 meV, comparable or lower to that of the remaining phonon spectrum (=0.05, ).
Our work provides the first evidence for an additional bosonic excitation in FeSC, beyond the ones usually discussed in literature - phonons, spin and orbital fluctuations. To the best of our knowledge, this is the first time that this type of excitonic charge excitation (indirect longitudinal excitons) is reported for a metallic system. In typical metals the difficulty to observe excitons is usually ascribed to the large dielectric screening provided by the fast conduction electrons. However, in the present somewhat ”anomalous” case, where heavy charge carriers are present with large mass renormalizations, this detrimental screening might be significantly suppressed.
The present finding extends the list of exceptional cases in which PCS could detect the interaction of electrons with bosons other than phonons. These include magnons Akim , crystal field excitations interacting with conduction electrons in the magnetic superconductor Naidyuk2007 HoNi2B2C, in the superconducting heavy fermion system PrOs4Sb12 Kvitnitskaya2006 , in PrNi5 Reiffers1989 , and with paramagnons in the nearly ferromagnetic CeNi5.Naidyuk1993
Acknowledgements
Yu.G. N. and O.E. K. thank the IFW Dresden for hospitality and the Alexander von Humboldt Foundation for financial support. Funding by the National Academy of Sciences of Ukraine under project 3-19 is gratefully acknowledged. D.E., S.W., L.B. and S.-L.D. acknowledge the Deutsche Forschungsgemeinschaft DFG (priority program SPP 1485) for support. S.W. thanks also funding by the research training group GRK 1621 as well as by the project WU 595/3–1. Discussions with S.V. Borisenko, R.S. Gonnelli, S. Johnston, M. Knupfer, Yu.A. Kolesnichenko, A.N. Omelyanchouk and H. Rosner are kindly appreciated. The assistance of N.L. Bobrov and K. Nenkov during some experiments is acknowledged.
References
- (1) L. Boeri, O.V. Dolgov, and A. A. Golubov, Phys. Rev. Lett. 101, 026403 (2008); Physica C 469, 628(2009).
- (2) Alaska Subedi, Lijun Zhang, D. J. Singh, and M. H. Du, Phys. Rev. B 78, 134514 (2008).
- (3) I.I. Mazin, D.J. Singh, M. D. Johannes, and M.H. Du, Phys. Rev. Lett. 101, 057003 (2008).
- (4) T. Yildirim, Physica C 469, 425 (2009).
- (5) L. Boeri, M. Calandra, I.I. Mazin, O.V. Dolgov,and F. Mauri, Phys. Rev. B 82, 020506 (2010).
- (6) F. Yndurain, Europhys. Lett. 94, 37001 (2011).
- (7) Kazuhiko Kuroki, Seiichiro Onari, Ryotaro Arita, Hidetomo Usui, Yukio Tanaka, Hiroshi Kontani, and Hideo Aoki, Phys. Rev. Lett. 101, 087004 (2008).
- (8) H. Kontani, Y. Inoue, T. Saito, Y. Yamakawa, and S. Onari, Solid State Comm. 152, 718 (2012).
- (9) D. V. Efremov, M.M. Korshunov, O.V. Dolgov, A.A. Golubov, and P.J. Hirschfeld, Phys. Rev. B 84, 180512(R) (2011); D. Efremov, A.A. Golubov, and O.V. Dolgov, New J. Phys. 15, 013002 (2013).
- (10) Yu. G. Naidyuk and I. K. Yanson, Point-Contact Spectroscopy, Springer Series in Solid-State Sciences (Springer Science+Business Media, Inc), vol.145, 2005.
- (11) H.Z. Arham, C.R. Hunt, W.K. Park, J. Gillett, S.D. Das, S. E. Sebastian, Z.J. Xu, J. S. Wen, Z.W. Lin, Q. Li, G. Gu, A. Thaler, S. Ran, S.L. Bud’ko, P.C. Canfield, D.Y. Chung, M.G. Kanatzidis, and L.H. Greene, Phys. Rev. B 85, 214515 (2012).
- (12) L.H. Greene and H.Z. Arham, J. of Supercond. and Novel Magnetism 25, 2121 (2012).
- (13) R.S. Gonnelli, D. Daghero, and M. Tortello, Current Opinion in Solid State and Materials Science 17, 72 (2013).
- (14) I.O. Kulik, A.N. Omelyanchouk and R.I. Shekhter, Fiz. Nizk. Temp. 3, 1543 (1977) [Sov. J. Low Temp. Phys. 3, 840 (1977)].
- (15) I.O. Kulik, Fiz. Nizk. Temp. 18, 440 (1992) [Sov. J. Low Temp. Phys. 18, 302 (1992)].
- (16) A.G.M. Jansen, A.P. van Gelder, and P. Wyder, J. Phys. C: Solid State Phys., 13, 6073 (1980).
- (17) Thus, in general, the PC EPI function is quantitatively different from the usual Eliashberg EPI function responsible for the superconductivity (see Eq. (3)). However, both functions are strongly enhanced at frequencies corresponding to bosons with a strong interaction to electrons.
- (18) J. Ph. Reid, M. A. Tanatar, A. Juneau-Fecteau, R. T. Gordon, S. René de Cotret, N. Doiron-Leyraud, T. Saito, H. Fukazawa, Y. Kohori, K. Kihou, C.H. Lee, A. Iyo, H. Eisaki, R. Prozorov, and L. Taillefer, Phys. Rev. Lett. 109, 087001 (2012); Supercond. Sci. and Techn. 25, 084013 (2012).
- (19) M. Abdel-Hafiez, V. Grinenko, S. Aswartham, I. Morozov, M. Roslova, O. Vakaliuk, S. Johnston, D.V. Efremov, J. van den Brink, H. Rosner, M. Kumar, C. Hess, S. Wurmehl, A.U.B. Wolter, B. Büchner, E.L. Green, J. Wosnitza, P. Vogt, A. Reifenberger, C. Enns, M. Hempel, R. Klingeler, and S.-L. Drechsler, Phys. Rev. B 87, 180507(R) (2013).
- (20) V. Grinenko, D.V. Efremov, S.-L. Drechsler, S. Aswartham, D. Gruner, M. Roslova, I. Morozov, K. Nenkov, S. Wurmehl, A.U.B. Wolter, B. Holzapfel, and B. Büchner Phys. Rev. B 89, 060504(R) (2014).
- (21) S. Baroni, S. de Gironcoli, A. Dal Corso, and P. Giannozzi, Rev. Mod. Phys. 73, 515 (2001).
- (22) Paolo Giannozzi, Stefano Baroni, Nicola Bonini, Matteo Calandra, Roberto Car, Carlo Cavazzoni, Davide Ceresoli, Guido L. Chiarotti, Matteo Cococcioni, Ismaila Dabo, Andrea Dal Corso, Stefano de Gironcoli, Stefano Fabris, Guido Fratesi, Ralph Gebauer, Uwe Gerstmann, Christos Gougoussis, Anton Kokalj, Michele Lazzeri, Layla Martin-Samos, Nicola Marzari, Francesco Mauri, Riccardo Mazzarello, Stefano Paolini, Alfredo Pasquarello, Lorenzo Paulatto, Carlo Sbraccia, Sandro Scandolo, Gabriele Sclauzero, Ari P. Seitsonen, Alexander Smogunov, Paolo Umari and Renata M. Wentzcovitch, J. Phys.: Condens. Matter 21, 395502 (2009).
- (23) B.I. Verkin, I.K. Yanson, I.O. Kulik, O.I. Shklyarevski, A.A. Lysykh, Yu.G. Naydyuk, Solid State Commun. 30, 215 (1979).
- (24) M. Abdel-Hafiez, S. Aswartham, S. Wurmehl, V. Grinenko, C. Hess, S.-L. Drechsler, S. Johnston, A.U.B. Wolter, and B. Büchner, H. Rosner, L. Boeri, Phys. Rev. B 85, 134533 (2012).
- (25) M. Rotter, M. Tegel, and D. Johrendt, Phys. Rev. Lett. 101, 107006 (2008).
- (26) Yu.G. Naidyuk, O.E. Kvitnitskaya, S. Aswartham, G. Fuchs, K. Nenkov, and S. Wurmehl, Phys. Rev. B 89, 104512 (2014).
- (27) Yu.G. Naidyuk, M. Reiffers, A.G.M. Jansen, P. Wyder, I.K. Yanson, D. Gignoux, and D. Schmitt, Int. J. of Mod. Phys. B, 7, 222 (1993).
- (28) C.H. Lee, K. Kihou, H. Kawano-Furakawa, T. Saito, A. Iyo, H. Eisaki, H. Fukazawa, Y. Kohori, K. Suzuki, H. Usui, K. Kuroki, and K. Yamada, Phys. Rev. Lett. 106, 067003 (2011).
- (29) N.J. Curro, T. Caldwell, E.D. Bauer, L.A. Morales, M.J. Graf, Y. Bang, A.V. Balatsky, J.D. Thompson, and J. L. Sarrao, Nature 434, 622 (2005).
- (30) Lei Shan, Jing Gong, Yong-Lei Wang, Bing Shen, Xingyuan Hou, Cong Ren, Chunhong Li, Huan Yang, Hai-Hu Wen, Shiliang Li, and Pengcheng Dai, Phys. Rev. Lett. 108, 227002 (2012).
- (31) Z. Wang, H. Yang, D. Fang, B. Shen, Q.-H. Wang, L. Shan, C. Zhang, P. Dai and H.-H. Wen, Nature Phys. 9, 42 (2013).
- (32) S. Ziemak, K. Kirschenbaum, S.R. Saha, R. Hu, J.-Ph. Reid, R. Gordon, L. Taillefer, D. Evtushinsky, S. Thirupathaiah, S.V. Borisenko, A. Ignatov, D. Kolchmeyer, G. Blumberg, and J. Paglione, arXiv:1407.6414.
- (33) All calculations were performed in the generalized gradient approximation DFT:PBE using plane-waves and ultra-soft pseudopotentials qe ; Vanderbilt . We employed a cut-off of 40 (480) Ryd for the wave-functions (charge densities). The electronic integration was performed over an -mesh with a Ry Hermitian-Gaussian smearing. Finer grids () -points were used for Fermi surface averages of the EP matrix elements in 3. Dynamical matrices and EP linewidths were calculated on a uniform grids in -space, and Fourier-interpolated to obtain dispersions in the whole Brillouin zone
- (34) S. Rosza and H.U. Schuster, Z. Naturforsch. 36, 1668 (1981).
- (35) S. Kittaka, Y. Aoki, N. Kase, T. Sakakibara, T. Saito, H. Kohori, K. Kihou, C.-H. Lee, A. Iyo, H. Eisaki, K. Sato, Y. Tstsumi, and K. Machida, J. Phys. Soc. Jpn. 83, 13704 (2014).
- (36) At variance with the authors of Ref. Kittaka14, where only one atom is taken into account in the determination of the Debye-energy, we have adopted the text-book definitionsh , where the lattice specific heat scales with the number of atoms/f.u. (five, in the present cases). As a result, we obtain a low-temperature lattice contribution to the total specific heat almost identical to with = 0.51(5) mJ/mol K4 taken from Ref. Grinenko2014, are obtained. In fact, the two Debye energies differ by a factor of .
- (37) O.K. Andersen and L. Boeri, Annalen der Physik, 523, 8 (2011).
- (38) Z.P. Yin, K. Haule and G. Kotliar, Nature Physics, 7, 294 (2011).
- (39) S. Backes, D. Guterding, H.O. Jeschke, and R. Valenti, arxiv:1403.6993.
- (40) T. Sato, K. Nakayama, Y. Sekiba, P. Richard, Y.-M. Xu, S. Souma, T. Takahashi, G. F. Chen, J. L. Luo, N. L. Wang, and H. Ding, Phys. Rev. Lett. 103, 047002 (2009).
- (41) S. Yoshida, S. Ideta, I. Nishi, A. Fujimori, M. Yi, R G. Moore, S.K. Mo, D.-H. Lu, Z.-X. Shen, Z. Hussain, K. Kihou, P.M. Shirage, H. Kito, C.H. Lee, A. Iyo, H. Eisaki, H. Harima, J. Phys. and Chem. of Solids 72, 465 (2011)
- (42) T. Terashima, N. Kurita, M. Kimata, M. Tomita, S. Tsuchiya, M. Imai, A. Sato, K. Kihou, Chul-Ho Lee, H. Kito, H. Eisaki, A. Iyo, Taku Saito, H. Fukazawa, Y. Kohori, H. Harima, and S. Uji, Phys. Rev. B 87, 224512 (2013).
- (43) H. Ibach, J. of Electron Spectroscopy and Related Phenomena 64/65, 819 (1993).
- (44) L. de Medici, A. Georges, and S. Biermann, Phys. Rev. B 72, 205124 (2005).
- (45) Luca de’Medici, Gianluca Giovannetti, Massimo Capone, Phys. Rev. Lett. 112, 177001 (2014)
- (46) T. Moriya and K. Ueda, Rep. Prog. Phys. 66, 1299 (2003).
- (47) Meng Wang, Chenglin Zhang, Xingye Lu, Guotai Tan, Huiqian Luo, Yu Song, Miaoyin Wang, Xiaotian Zhang, E.A. Goremychkin, T.G. Perring, T.A. Maier, Zhiping Yin, Kristjan Haule, Gabriel Kotliar and Pengcheng Dai, Nature Commun. 4, 3874 (2013).
- (48) A.I. Akimenko, I.K.Yanson, Pis‘ma Zh. Eksp. Teor. Fiz. 31, 209 (1980) [JETP Lett., 31, 191 (1980)].
- (49) Yu.G. Naidyuk, O.E. Kvitnitskaya, I. K. Yanson, G. Fuchs, K. Nenkov, A. Wälte, G. Behr, D. Souptel, and S.-L. Drechsler, Phys. Rev. B 76, 014520 (2007).
- (50) O.E. Kvitniskaya, Yu.G. Naidyuk, I.K. Yanson, A. Karkin, S. Naumov, and N. Kostromitina, Physica B, 378 178 (2006).
- (51) M. Reiffers, Yu.G. Naidyuk, A.G.M. Jansen, P. Wyder, I.K. Yanson, D. Gignoux, D.P. Schmitt, Phys. Rev. Lett. 62, 1560 (1989).
- (52) J.P. Perdew, K. Burke, and M. Ernzerhof, Phys. Rev. Lett. 78, 1396 (1997).
- (53) D. Vanderbilt, Phys. Rev. B 41, R7892 (1990).
- (54) A. Tari, The Specfic heat at Low Temperatures, Imperial College Press, (2003).