Exploring the spectral diversity of low-redshift Type Ia supernovae using the Palomar Transient Factory
Abstract
We present an investigation of the optical spectra of 264 low-redshift () Type Ia supernovae (SNe Ia) discovered by the Palomar Transient Factory, an untargeted transient survey. We focus on velocity and pseudo-equivalent width measurements of the Si ii 4130, 5972, and 6355 Å lines, as well those of the Ca ii near-infrared (NIR) triplet, up to +5 days relative to the SN -band maximum light. We find that a high-velocity component of the Ca ii NIR triplet is needed to explain the spectrum in per cent of SNe Ia observed before days, decreasing to per cent at maximum. The average velocity of the Ca ii high-velocity component is higher than the photospheric component. We confirm previous results that SNe Ia around maximum light with a larger contribution from the high-velocity component relative to the photospheric component in their Ca ii NIR feature have, on average, broader light curves and lower Ca ii NIR photospheric velocities. We find that these relations are driven by both a stronger high-velocity component and a weaker contribution from the photospheric Ca ii NIR component in broader light curve SNe Ia. We identify the presence of C ii in very early-time SN Ia spectra (before days), finding that 40 per cent of SNe Ia observed at these phases show signs of unburnt material in their spectra, and that C ii features are more likely to be found in SNe Ia having narrower light curves.
keywords:
distance scale – supernovae: general – galaxies: general1 Introduction
The use of Type Ia supernovae (SNe Ia) as cosmological probes is firmly established (e.g., Riess et al., 1998, 2007; Perlmutter et al., 1999; Kessler et al., 2009; Sullivan et al., 2011; Suzuki et al., 2012; Ganeshalingam et al., 2013; Rest et al., 2013; Betoule et al., 2014). While there is reasonable consensus that the stars that explode as SNe Ia are CO white dwarfs (WDs) in binary systems, the nature of their companion stars is still controversial with a number of scenarios considered plausible. In the single-degenerate (SD) model, a nondegenerate companion star is the mass donor (Whelan & Iben, 1973), while in the double-degenerate (DD) model, a thermonuclear explosion results from the merger of two CO WDs (Iben & Tutukov, 1984; Webbink, 1984). The ‘double-detonation’ scenario where the explosion is initiated by the detonation of a He layer on the WD surface, which sends a shock wave into the star resulting in a second detonation that unbinds the star, is experiencing a revival (Livne & Glasner, 1990; Shen & Bildsten, 2014). There is also increasing evidence that there is more than one progenitor channel contributing to the SN Ia population, although the relative rates of the different channels remain unclear (Gilfanov & Bogdán, 2010; Li et al., 2011; Nugent et al., 2011; Sternberg et al., 2011; Dilday et al., 2012; Schaefer & Pagnotta, 2012; Maguire et al., 2013; Maoz et al., 2013; Wang et al., 2013).
A large diversity in the observed properties of SNe Ia has been identified, particularly from studies of their light curves and spectra at maximum light. Good progress has been made through the analyses of large spectroscopic datasets that have found strong differences in the presence (or absence) of certain spectral features, line strengths, and velocities within the samples (e.g., Benetti et al., 2005; Branch et al., 2006; Matheson et al., 2008; Blondin et al., 2012; Silverman et al., 2012b). Correlations between spectroscopic properties and light-curve shape and colour, as well as between spectral features and host-galaxy properties (e.g., Bronder et al., 2008; Foley, 2012; Maguire et al., 2012), have been identified at varying significance, dependent on the samples and the analysis techniques used. Some studies have specifically focussed on investigating trends between spectral features and luminosity, with the aim of decreasing the scatter in the SN Ia Hubble diagram (Bronder et al., 2008; Bailey et al., 2009; Blondin et al., 2011; Walker et al., 2011; Silverman et al., 2012a). Potential connections between the progenitor systems (detectable through signatures of circumstellar material) and observed properties such as light-curve shape, light-curve colour, and host-galaxy properties have also been made (Foley et al., 2012; Maguire et al., 2013).
Some of the most prominent features in SN Ia spectra around maximum light are produced by Si: the Si ii 6355 Å, Si ii 5972 Å, and Si ii 4130 Å lines. The ratio of the strength of the Si ii 6355 Å line to that of the Si ii 5972 Å line is well known to correlate with SN light-curve width (Nugent et al., 1995). The equivalent widths of these two Si ii features and the velocity gradient of the Si ii 6355 Å line can also be used as a diagnostic for identifying subclasses of SNe Ia (Benetti et al., 2005; Branch et al., 2006). Recent work has highlighted the importance of studies of the Ca ii H&K and Ca ii near-infrared (NIR) triplet lines in SN Ia spectra at early times – previous studies have found a trend of increasing velocity of the complex Ca ii H&K absorption feature with increasing light-curve width (Wells et al., 1994; Fisher et al., 1995; Maguire et al., 2012). It was speculated by Maguire et al. (2012) that the presence of high-velocity features of the Ca ii lines may cause this correlation but other causes such as Si ii 3858 Å line contamination could not be ruled out. Foley (2013) suggested that a contribution from Si ii 3858 Å was the more likely cause of this correlation and that the strength of the Si ii 3858 Å varies strongly with light-curve width.
To investigate the origin of this relationship (contribution of high-velocity Ca ii features or Si ii 3858 Å to the Ca ii H&K feature), Childress et al. (2014) studied 58 SNe Ia with spectra covering the Ca ii NIR triplet, since this feature is less contaminated by features of other elements and should provide a much cleaner dataset. Using a multi-component fit, they found that the strength of the Ca ii NIR high-velocity features also correlates with the light-curve width, such that SNe Ia displaying broader light curves have higher ratios of high-velocity to photospheric-velocity Ca ii NIR features. This suggests that the origin of the previously identified trends in the Ca ii H&K feature are not caused predominantly by Si ii contamination but instead by high-velocity components of the Ca ii absorption features. Childress et al. (2014) also showed that SNe Ia with high Si ii velocities ( 12000 ) tend to have weak Ca ii NIR high-velocity features. Wang et al. (2013) have identified an environmental dependence on Si ii velocities – SNe Ia with higher Si ii velocities ( 12000 ) preferentially occur in the centre of their host galaxies.
The origin of the high-velocity features of Ca ii is unclear but only small amounts of Ca are needed to produce strong Ca ii features. Their high velocities (a few thousand greater than the photospheric component) indicate that they are caused by material far out in the ejecta. High-velocity features are best identified at early times owing to the contrast between the photospheric and high-velocity feature velocities but this difference decreases with time, and without a multiple-component fit are difficult to distinguish by eye. These features were first discussed by Gerardy et al. (2004) and a number of suggestions for their origin have been made, including density and/or abundance enhancements at high velocity, either from circumstellar material (CSM) or intrinsic to the SN (Mazzali et al., 2005; Blondin et al., 2012). It has been shown that a small mass of H added to the outer layers of the ejecta, with reasonably high density at high velocities (4 times higher density at velocities 20,000 than the standard W7 deflagration model of Nomoto et al., 1984), can lead to a substantial increase in recombination due to increased electron density (Mazzali et al., 2005; Altavilla et al., 2007; Tanaka et al., 2008). This increases the opacity of the strongest lines of singly ionised elements (in particular Ca ii H&K, Ca ii NIR and then Si ii 6355 Å) at high velocities, leading to the forming of high-velocity features. The Ca ii fraction is increased by a factor of 5–10 compared to no H being added (Tanaka et al., 2008). However, the link between the presence of these features and the progenitor configuration of SNe Ia remains elusive.
Identifying C ii features in the early-time spectra of SNe Ia is of importance since C ii traces the presence of unburnt material, providing a link to explosion mechanisms. Although O can also be used as a tracer of unburnt material, it too has a contribution from C burning. Many searches for C ii in SN Ia spectral samples have been performed, finding that per cent of SN Ia spectra obtained at epochs before 5 d with respect to maximum show signs of C ii (Thomas et al., 2011; Blondin et al., 2012; Folatelli et al., 2012; Parrent et al., 2012; Silverman & Filippenko, 2012).
Different explosion mechanisms predict different amounts of unburnt material in early-time SN Ia spectra. Pure detonation models appear unviable since they predict too few intermediate-mass elements, and very little unburned material compared to observations (Arnett, 1969). Pure deflagration models predict too much unburnt material in their ejecta, as well as the presence of O lines at nebular phases owing to mixing of the ejecta caused by turbulent burning (Kozma et al., 2005; Röpke, 2005; Röpke & Niemeyer, 2007). However, this has only been observed in one subluminous SN Ia to date (Taubenberger et al., 2013). For the majority of SNe Ia, delayed-detonation models hold the most promise for explaining the observations, with the prediction that all but the outer layers of material will be burnt in the explosion (e.g., Khokhlov, 1991; Hoeflich et al., 1995; Maeda et al., 2010). Detections of C ii signatures in early-time SN Ia spectra have allowed constraints to be placed on the amount and velocity structure of this outer, unburnt material. For example, Folatelli et al. (2012) showed that velocity of the C ii 6580 Å feature extends as low as (measured from the absorption minimum), suggestive of mixing of unburnt material to velocities similar to those of the Si ii lines.
Here we present optical spectra of SNe Ia obtained as part of the Palomar Transient Factory (PTF) collaboration. The PTF was an untargeted optical transient survey operating at the Samuel Oschin 48-in telescope (P48) at the Palomar Observatory, U.S. from 2009 to 2012 (Law et al., 2009; Rau et al., 2009). Its aim was to discover transient events with timescales on the order of hours to years. It located 1249 low-z spectroscopically confirmed SNe Ia, without biases in terms of host-galaxy properties (i.e., massive galaxies were not specifically targeted).
In this paper, we focus on the analysis of the spectroscopic features of these SNe Ia and the link to their photometric properties, specifically the SN light-curve width. This paper is complemented by Pan et al. (submitted), which details the connection between spectral properties at maximum light and SN Ia host-galaxy properties. Section 2 describes the sample selection, spectroscopic and photometric observations, as well as the data reduction and analysis techniques employed. Section 3 presents the measurements made of the spectral features (velocities, equivalent widths, presence of high-velocity components) as a function of phase and light-curve width, as well as an analysis of high-velocity features and the presence of C in early-time spectra. The use of PTF SN Ia spectral measurements as luminosity indicators is also described. A discussion of the results of the previous sections are presented in Section 4, while Section 5 summarises the conclusions of this work. Throughout this paper, we assume a Hubble constant H km s-1 Mpc-1.
2 Observations and Data Reduction
We present spectroscopic classification and follow-up data for SNe Ia obtained as part of the PTF collaboration. SN candidates were discovered in P48 g- and R-band images using image-subtraction techniques. The SN candidates were ranked using machine-learning software (Bloom et al., 2012), and visually confirmed by PTF members or citizen scientists via the ‘Galaxy Zoo: Supernova project’ (Smith et al., 2011). The best SN candidates were then classified (for a review of SN types, see Filippenko, 1997) and monitored spectroscopically using a variety of optical telescopes. Photometry was obtained at the P48, as well as the 2-m robotic Liverpool Telescope (LT; Steele et al., 2004) and the Las Cumbres Observatory Global Telescope (LCOGT) Faulkes Telescope North (FTN). In this paper, we focus on the spectroscopic sample analysis and use only derived quantities from the light curves (light-curve width, time of B-band maximum light). The fully calibrated PTF SN Ia light curves will be presented in a future paper.
2.1 Sample selection
We select SNe Ia for this spectroscopic study using the following criteria: (i) that a spectral comparison to SN templates is most similar to a SN Ia, (ii) that their light-curve parameters can be measured – specifically that there are enough data available so that a light-curve width (stretch, s) can be measured with the light-curve fitter, SiFTO (Conley et al., 2008) with an uncertainty , (iii) that a spectrum exists at a phase of 5 d with respect to B-band maximum, (iv) that a spectroscopic redshift is available for the SN host galaxy (see Section 2.2) and has a value of , and (v) that the spectrum has a sufficiently high signal-to-noise ratio (S/N) that at least the velocity and pseudo-equivalent width (pEW) of the Si ii 6355 Å can be measured. In this paper, we focus on ‘normal’ SNe Ia and leave the analysis of the low-velocity unusual SNe (‘2002es-like’ and ‘2002cx-like’ objects) found in PTF to White et al. (submitted). Only one SN (PTF10acdh) in our sample is further excluded after our initial cuts because of an overlap with the sample of White et al. (submitted). The spectrum of PTF10acdh had a low S/N and gave a spectral fit consistent with a SN Ia. However, it had the lowest Si ii velocity of our sample, with a value of just 6800 (measured from the absorption minimum) at 8 d with respect to maximum light, and it is most likely a ‘2002es-like’ SN.
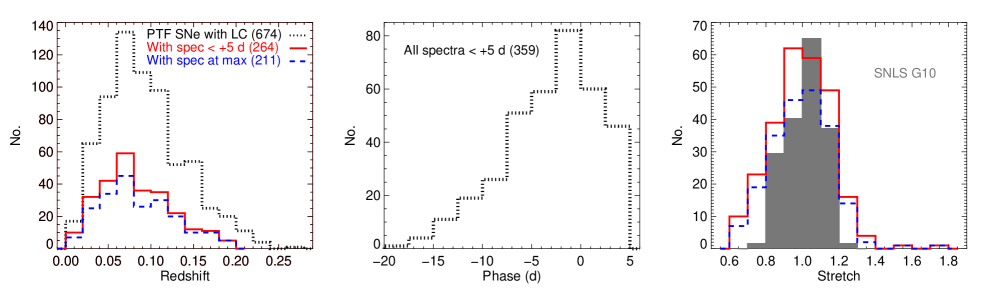
The number of SNe Ia remaining after each of the cuts is shown in Table 1. When these cuts have been made we are left with 359 spectra of 264 unique SNe Ia before +5 d, and 247 spectra of 211 unique events in a maximum-light sample ( to +5 d). Fig. 1 shows the redshift, phase, and stretch distributions of the PTF SN Ia sample used here. For comparison, the stretch distribution from the SN Legacy Survey (SNLS) is also shown (Guy et al., 2010). The sample is limited to SNe Ia at , since the SNLS sample is closer to being complete with this redshift cut than the full SNLS SN Ia dataset (Perrett et al., 2010).
| Cut | No. of SNe | Discarded SNe |
|---|---|---|
| Total | 1249 | – |
| LC with | 674 | 575 |
| With spectrum d | 371 | 303 |
| With spectroscopic | 288 | 83 |
| With Si ii 6355 Å measurement1 | 264 | 24 |
1 PTF10acdh is also excluded in this cut because of its SN 2002es-like properties as detailed in Section 2.1.
2.2 Low-resolution optical spectroscopy
The optical spectra presented in this paper were obtained with 14 telescopes having 15 different instruments. The typical instruments and setups used for these observations are listed in Table 2, along with the number of spectra from each telescope entering our sample. The slit was generally aligned along the parallactic angle (see Filippenko, 1982) to minimise the effects of atmospheric dispersion. The spectra were reduced using custom pipelines for each of the telescopes based on standard spectral reduction procedures in iraf and idl. The two-dimensional spectra were bias and flat-field corrected before extraction. The extracted spectra were wavelength calibrated using arc-lamp exposures and instrumental response functions were obtained from observations of spectrophotometric standards to perform the flux calibration. As only velocity and equivalent-width measurements are presented in this paper, uncertainties in the absolute flux calibration do not significantly affect our results. The spectra will be publicly released via the WISeREP portal111http://www.weizmann.ac.il/astrophysics/wiserep/ (Yaron & Gal-Yam, 2012). Example rest-frame spectra around maximum light for a range of light-curve widths are shown in Fig. 2.
The spectra were corrected to the rest frame using redshifts obtained with one of the following methods: (i) from host-galaxy lines identified in the SN spectra, (ii) from NASA/IPAC Extragalactic Database222http://nedwww.ipac.caltech.edu/ (NED) galaxy spectra, (iii) from Sloan Digital Sky Survey Data Release 9 galaxy spectra (York et al., 2000), or (iv) from host-galaxy spectra obtained after the SN had faded. Any SN Ia that did not have a redshift measured in this manner is excluded from our sample. This includes any with redshift measurements from template matching of the SN spectrum, since we are performing a velocity analysis and this could bias the results. However, a potential bias could be introduced by the removal of faint hosts, which are more likely not to have a host-galaxy spectrum. To quantify this potential bias, we compare the stretch distribution of the SNe Ia with and without a spectroscopic redshift using a Kolmogorov-Smirnov test, and find that their distributions are consistent with being drawn from the same parent population (p-value=0.83).

| Telescope+1 | Typical | No. of spectra | No. of spectra |
|---|---|---|---|
| instrument | range (Å) | at 5 d | in max-light sample |
| P200+DBSP | 3200–10200 | 91 | 63 |
| Keck1+LRIS | 3200–11000 | 67 | 44 |
| WHT+ACAM/ISIS | 4950–9500, 3200–9500 | 61 | 48 |
| Lick+Kast | 3400-10300 | 47 | 42 |
| UH88+SNIFS | 3300–9700 | 28 | 13 |
| KPNO+RC | 3400-8400 | 25 | 18 |
| Gemini-N+GMOS | 3500–9700 | 25 | 9 |
| VLT+XSH | 3200–10200 | 3 | 2 |
| Keck2+DEIMOS | 4500–9600 | 3 | 2 |
| TNG+DOLORES | 3300-8200 | 3 | 1 |
| Gemini-S+GMOS | 3500–9700 | 2 | 2 |
| APO+DIS | 3200–9500 | 2 | 1 |
| Magellan+LDSS3 | 4000-10200 | 1 | 1 |
| Wise+FOSC | 3900–8300 | 1 | 1 |
1Further information on the telescopes and instruments used:
P200+DBSP = Palomar 200-inch (P200) with the Double Spectrograph (DBSP; Oke & Gunn, 1982).
Keck+DEIMOS/LRIS = Keck 10-m with the Deep Imaging Multi-Object Spectrograph (Faber et al., 2003) and the Low-Resolution Imaging Spectrometer (Oke et al., 1995).
WHT+ACAM/ISIS = William Herschel Telescope (WHT) with the Advanced Camera (ACAM) and the Intermediate-dispersion Spectrograph and Imaging System (ISIS).
Lick+Kast = Lick Observatory Shane 3-m telescope with the Kast double spectrograph (Miller & Stone, 1993).
UH88+SNIFS = University of Hawaii 2.2-m telescope (UH88) with the Supernova Integral Field Spectrograph (SNIFS; Lantz et al., 2004)
KPNO+RC = Kitt Peak National Observatory (KPNO) Mayall 4-m telescope with the RC spectrograph.
Gemini-N+GMOS = Gemini Telescope North (Gemini-N), Mauna Kea, Hawaii, US, with the Gemini Multi-Object Spectrograph (GMOS; Hook et al., 2004).
VLT+XSH = Very Large Telescope (VLT) at Paranal, Chile with the XShooter (XSH) spectrograph (XSH; D’Odorico et al., 2006; Vernet et al., 2011).
TNG+DOLORES = 3.58m Telescopio Nazionale Galileo (TNG) with the Device Optimized for the LOw RESolution (DOLORES).
Gemini-S+GMOS = Gemini Telescope South (Gemini-S), Cerro Pachon, Chile, with GMOS.
APO+DIS = Apache Point Observatory (APO) with Dual Imaging Spectrograph (DIS).
Magellan+LDSS3 = Magellan 6.5-m telescope with the Low Dispersion Survey Spectrograph-3 (LDSS3).
Wise+FOSC = Wise Observatory 1-m telescope with the Faint Object Spectrograph and Camera (FOSC).
2.3 Optical photometry
The optical photometry of the SN Ia sample comes from three telescopes: the P48, the LT and FTN. The LT is located at the Roque de Los Muchachos Observatory on La Palma, Spain, while FTN is located on Haleakala, Hawaii, U.S. The P48 provides -band data, which were reduced by the Infrared Processing and Analysis Center (IPAC)333http://www.ipac.caltech.edu/ pipeline (Laher et al., 2014) and photometrically calibrated (Ofek et al., 2012). The LT data were obtained using both the RATCAM and IO:O optical imagers in filters, similar to those used in the Sloan Digital Sky Survey. The FTN data were obtained with the Spectral Optical Imager in filters.
Deep reference images of the SN field when the SN is not present (either pre-explosion or at 300 days post-explosion) using the same instrument and filters are necessary to remove host-galaxy contamination from the SN photometry. Since the PTF is a rolling search, P48 reference images are obtained pre-explosion by design. However, for the LT, a specific campaign was mounted to obtain these reference images after the SN had faded. For each SN image, the stacked reference images are registered, flux-scaled and subtracted off using a point-spread-function (PSF) matching routine. The zeropoints of the LT images are calculated by calibrating directly to the SDSS photometric system using SDSS stars in the field of the SN or using calibration images (Landolt standards or SDSS Stripe 82 fields) taken before and after the SN fields on photometric nights. The FTN data have been reduced and calibrated in a similar manner to that described for the LT data.
For the calibration of LT data for the PTF SN Ia cosmology analysis, a more homogeneous and sophisticated calibration will be employed. In addition to SDSS Stripe 82 stellar fields, the updated cosmology standards stars of Betoule et al. (2013) are being observed on photometric nights before and after deep reference images to allow more accurate calibration. However, this improved method has not yet been applied to the whole sample.
2.4 Light-curve fitting
The optical -band light curves were analysed using the SiFTO light-curve fitting code (Conley et al., 2008), which outputs values for the stretch, maximum B-band magnitude, colour at maximum (where multiple bands are available), and time of maximum light for each SN. SiFTO uses a time series of spectral templates that are adjusted to match the observed colours of the SN photometry at each epoch, while also adjusting for Galactic extinction and redshift (i.e., the K-correction). In this paper, we do not present the colours found with SiFTO but instead defer this to a future paper and focus on the connection between spectral features and light-curve width.
2.5 Measuring line velocities and widths
Different methods have been used in the past to fit SN Ia spectral features in optical spectra, including fitting single Gaussian profiles (e.g., Maguire et al., 2012), spline fits (e.g., Silverman et al., 2012b), and applying smoothing techniques and then choosing the minimum value (e.g., Blondin et al., 2006; Foley et al., 2011). Since we are particularly interested in the Ca ii NIR triplet, which contains overlapping lines, we follow the multiple Gaussian fitting method of Childress et al. (2013, 2014). First, a pseudo-continuum is defined on either side of the absorption feature by visual inspection, and it is removed by fitting a line between the two points. The spectrum is then normalised at the feature position by removing the line fit. We perform the spectral fitting in velocity space, converting wavelengths to velocities using the relativistic Doppler formula.
Single or multiple Gaussian profiles can then be used depending on the line being fit. For the Si ii 6355 Å line, a double Gaussian is used to account for the Si ii 6347 Å and Si ii 6371 Å lines. To reduce the degeneracy of the fit, we assume an optically thick regime (typical of SN Ia atmospheres at early times; e.g., Blondin et al., 2012) and that the lines tend to saturate. Therefore, we fix the strengths of the individual components of the doublet to be equal (for a further discussion see Childress et al., 2013). We also fix the relative velocity difference between the double components, as well as force their widths to be the same. In a similar manner to the Si ii 6355 Å feature, we measure the parameters of the Si ii 4130 Å (doublet at 4131 and 4128 Å) and Si ii 5972 Å (doublet at 5979 and 5958 Å) features. We constrain the relative strengths, velocity differences and widths of the doublet lines.
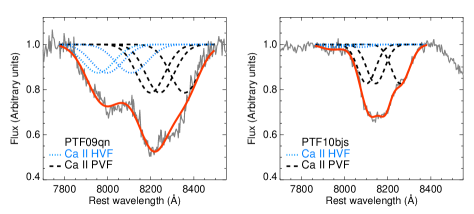
For the Ca ii NIR triplet region, the fitting is more complicated. There are three separate components of the Ca ii feature (8498, 8542, 8662 Å). Since we wish to determine the potential contribution from ‘high-velocity’ features, as well as photospheric-velocity features (PVFs), we fit six (three photospheric-velocity and three high-velocity) individual Gaussians simultaneously. We force each of the components of the Ca ii NIR triplet PVF to have the same velocity and width, as well as constrain their velocities to be within 25 per cent of the Si ii 6355 Å velocity; the latter is a looser constraint than that of Childress et al. (2014) because we wish to investigate the connection between the Si ii 6355 Å velocity and the Ca ii PVF velocity. For the Ca ii NIR high-velocity feature (HVF), we force the components to be at least 2000 higher than the Si ii velocity (by varying this value and repeating the measurements, we find that 2000 can be considered a conservative minimum). We also force the three components of the Ca ii NIR HVF to have the same velocities, widths, and relative strengths, assuming an optically thick regime. Example fits to the Ca ii NIR region are shown in Fig. 3.
Uncertainties in the velocities are estimated by propagating the uncertainty in the fitting with an additional one to account for uncertainties in the redshift of each SN. The quoted pEW uncertainties are those outputted from the fitting routine.
3 Analysis
In this section, we present the results of our spectroscopic analysis: (i) the properties of the spectral features as a function of the phase, (ii) the properties of the spectral features as a function of their light-curve width, (iii) the presence of high-velocity features and their relation to other properties, (iv) the breakdown of the sample into the spectroscopic subclasses of Branch et al. (2006) and Wang et al. (2009), (v) the use of spectral lines as luminosity indicators, and (vi) the search for unburnt material in the form of C ii.
3.1 Evolution of spectral features with phase
Here we detail the spectral velocities and pEW measured using a Gaussian fitting technique (discussed in Section 2.5) as a function of phase. We focus in this analysis on general trends with phase for the SNe Ia in our sample, instead of on the detailed evolution of individual events.
3.1.1 Velocities as a function of phase
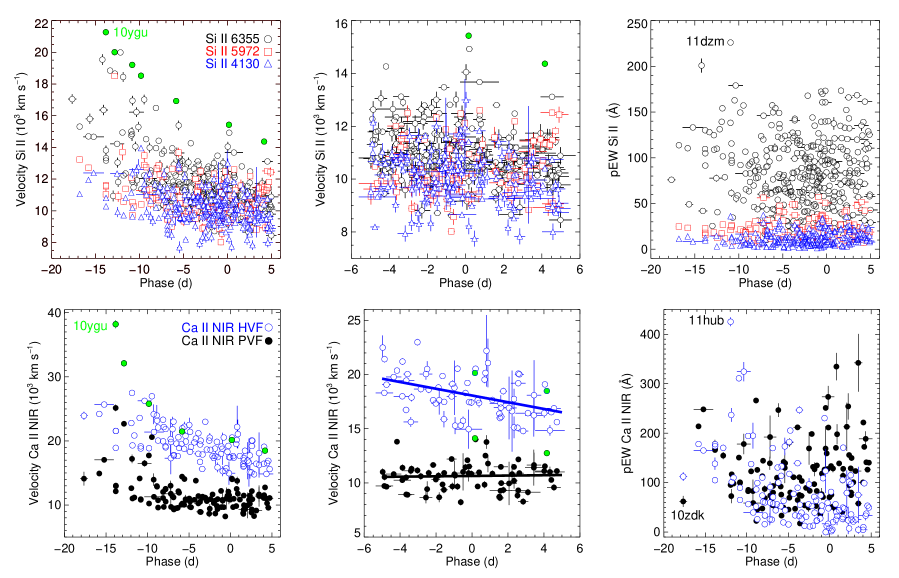
The Si ii 4130 Å, Si ii 5972 Å, Si ii 6355 Å, and Ca ii NIR triplet velocity (PVF and HVF) components are shown as a function of phase in Fig. 4. As expected, we find that the velocities of the spectral lines decrease with time over the phase range of to +5 d. The slopes of the best-fit lines to the data in a maximum-light sample (phase range to +5 d) are , , , , d-1 for Si ii 4130 Å, Si ii 5972 Å, Si ii 6355 Å, Ca ii NIR PVF, and Ca ii NIR HVF, respectively. Previous studies such as Benetti et al. (2005) and Blondin et al. (2012) examined the detailed phase evolution of individual objects and found a diversity in the rate of the evolution of the line velocities with time, as well as sometimes a nonlinear evolution with time. Therefore, we do not correct our measured velocities to maximum light using these average best-fit lines but instead restrict the sample to phase ranges over which the evolution with time is expected to be small.
In the maximum-light sample, the weighted mean Si ii velocities are , 10,511 108 and 11,477 96 for the Si ii 4130 Å, Si ii 5972 Å and Si ii 6355 Å features, respectively. As expected, the weaker Si ii 4130 Å and 5972 Å lines have lower velocities than the stronger Si ii 6355 Å.
There is a significant velocity difference between the weighted mean photospheric velocity of the Ca ii NIR triplet (10,085 173 ) and the mean high-velocity Ca ii NIR component (18,550 151 ) near maximum light. In our fitting routine, the greatest forced difference between the velocity of the Ca ii PVF component and velocity of the Ca ii NIR ‘high-velocity’ component is (and in many cases is significantly less). However, our measured average difference between the Ca ii NIR components of is significantly larger than this value. Further discussion of HVFs will be presented in Section 3.3.
3.1.2 pEW as a function of phase
The pEW of the main Si ii (4130 Å, 5972 Å, 6355 Å) and the Ca ii NIR lines in the SN Ia spectra are also investigated, and are shown as a function of phase in Fig. 4. There is a much larger scatter, extending to much higher values, in the Si ii 6355 pEW compared to the pEW of the Si ii 4130 and Si ii 5972 Å lines. The standard deviations of the means are 7 Å, 12 Å and 37 Å in the phase range to +5 d for Si ii 4130 Å, Si ii 5972 Å, Si ii 6355 Å, respectively. In the maximum-light sample, the pEW of the three Si ii lines stay relatively constant with phase.
The pEW of the two Ca ii IR triplet components (PVF and HVF) evolve differently with time. As shown in Fig. 4, over the phase range of to +5 d, the HVF strength decreases rapidly while the PVF strength tends to increase slightly. This is not surprising: the HVF form in lower-density regions farther out in the ejecta and thus, are likely to become optically thin more quickly than the PVF.
3.2 ‘Normal’ and ‘High’ velocities and light-curve width
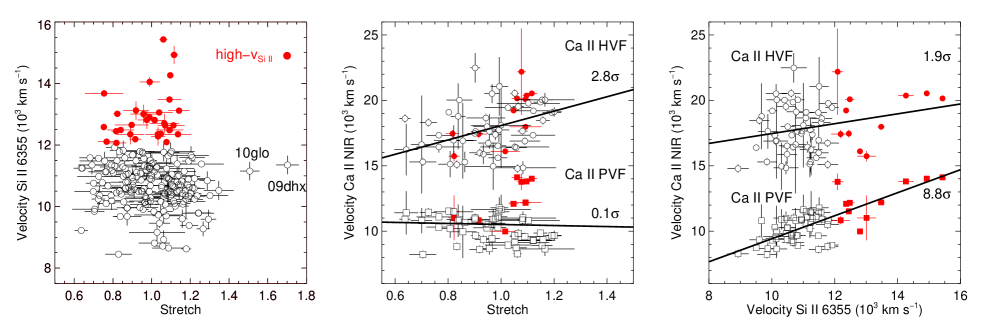
Previous studies have suggested that SNe Ia can be split into two distinct populations based on their Si ii 6355 Å velocities (Wang et al., 2009, 2013), ‘high-velocity’ (high-, 11,800–12,000 ) and ‘normal-velocity’ (normal-, 11,800–12,000 ). To investigate the relationship between Si ii 6355 Å velocity, the velocity of the Ca ii NIR triplet components and light-curve width, we focus on a maximum-light sample of SNe Ia ( to +5 d with respect to B-band maximum). We do not correct the velocities to maximum light for the reasons described in Section 3.1.1. If more than one spectrum for a SN Ia is present in this phase range, we choose the spectrum closest to maximum light. Two SNe Ia in our sample appear as outliers owing to their unusually large light-curve widths of (PTF10glo and PTF09dhx) and are excluded from further analysis (their positions in Si ii 6355 Å velocity vs. stretch space can be seen in the left panel of Fig. 5). The spectrum of PTF10glo appears similar to normal SNe Ia, while the spectra of PTF09dhx appear similar to ‘super-Chandrasekhar’ events (e.g., Howell et al., 2006; Hicken et al., 2007; Scalzo et al., 2010; Silverman et al., 2011).
The left plot of Fig. 5 shows the velocity of the Si ii 6355 Å line as a function of stretch. We measure the statistical significance of potential trends between the Si ii 6355 Å velocity and light-curve width using LINMIX, a Bayesian approach for linear regression with uncertainties in both variables (Kelly, 2007). As in previous studies, we find no correlation between the Si ii 6355 Å velocity and light-curve width for this maximum-light sample, nor when we limit the sample to that used by cosmological studies ( stretch ; Conley et al., 2011). We also consider the Si ii 6355 Å high-velocity and normal-velocity subsamples separately and look for correlations between light-curve width and Si ii 6355 Å velocity within the subsamples, but again find no statistically significant trends. In Fig. 5 (middle panel), we show our measured Ca ii NIR PVF and HVF velocities as a function of stretch. Using LINMIX, we find no correlation between the Ca ii NIR PVF velocity and light-curve width, and only a weak relation between the Ca ii NIR velocity and light-curve width (2.8-).
The Ca ii NIR PVF and HVF velocities against the Si ii 6355 Å velocity in the maximum-light sample are shown in the right panel of Fig. 5. A clear trend is seen between the Ca ii NIR PVF and the Si ii 6355 Å velocity, with a 8.8 significance. The corresponding Pearson correlation coefficient is 0.73. No correlation between the Ca ii HVF velocity and the Si ii 6355 velocity is seen. If we remove SNe Ia with ‘high-,’ then the correlation between the Ca ii PVF velocity and the Si ii 6355 Å velocity drops to 3.4-. This suggests that the correlation between Ca ii PVF and Si ii 6355 Å velocity is at least partly driven by the ‘high-’ SNe Ia having higher Ca ii PVF velocities.
In our fitting routine (as discussed in Section 2.5), we constrain the velocity of the Ca ii NIR PVF to be within 25 per cent of the Si ii 6355 Å velocity. This is a much looser constraint than that of Childress et al. (2014) of within 10 per cent of the Si ii 6355 Å velocity. To test the effect of this on the relation between the Ca ii PVF and Si ii 6355 Å velocities, we test the less stringent constraints of the Ca ii NIR PVF velocity being within 40 per cent and 60 per cent of the Si ii 6355 Å velocity. We find no significant difference in the correlation values for these constraints. Therefore, the tight correlation between Si ii 6355 Å velocity and the Ca ii NIR PVF velocity cannot be explained by this constraint alone. We discuss the possible origin of the observed variations in line velocities in Section 4.1.
3.3 Strength of high-velocity Ca ii features
High-velocity features of the Si ii 6355 Å, Ca ii H&K and Ca ii NIR triplet lines have been previously identified in many SN Ia spectra at early times and their origin is still unclear (e.g., Childress et al., 2013; Gerardy et al., 2004; Mazzali et al., 2005). These features typically have velocities that are a few thousand higher than the photospheric component (as seen for our sample in Fig. 4 where we identify an average difference of ) and can appear as multiple-peaked or blended absorption profiles.
Previous studies have been made of the Ca ii H&K region because data were more readily available for it than the Ca ii NIR triplet region. However, the Ca ii NIR region is less affected by other lines and so is more suitable for studying the presence of high-velocity features. Childress et al. (2014) parameterised the ratio of the HVF to the PVF pEW of the Ca ii NIR triplet as . To investigate the presence and strength of HVF in the PTF SN Ia sample, we measure the pEW of the Ca ii PVF and HVF in spectra in our sample that cover the Ca ii NIR triplet and are in the phase range of 18 to +5 d with respect to B-band maximum.
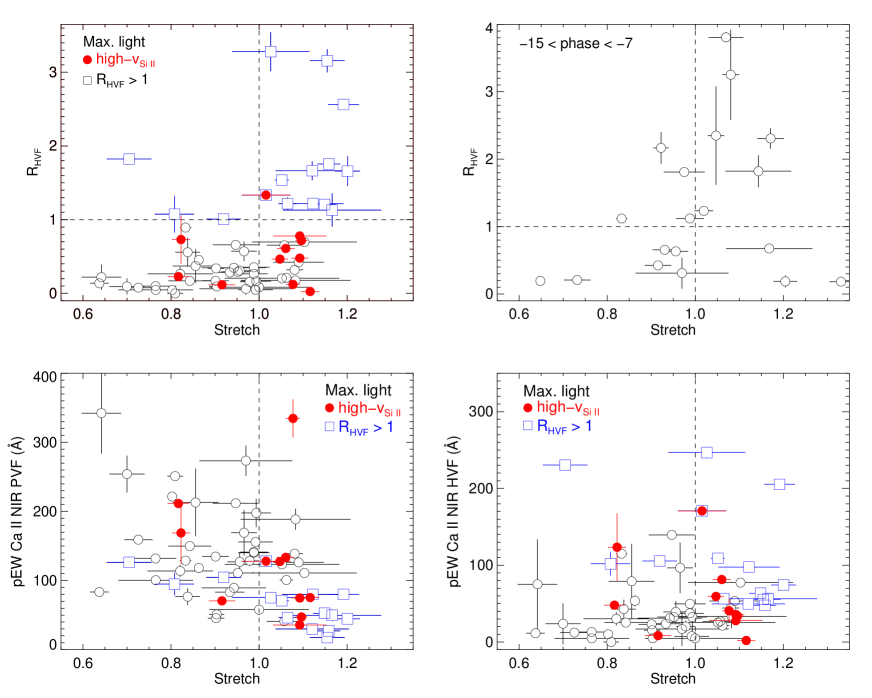
3.3.1 Ca ii HVF strength and light-curve width
In Fig. 6, we show the Ca ii against the light-curve width (stretch) in two different phase bins, 5 to +5 d (maximum light) and 15 to 7 d (early). We confirm the maximum-light relationship identified by Childress et al. (2014), as well as show that this relation is present in our early time sample. We show that SNe Ia with broader light curves (higher stretch) have higher values of , on average. To estimate the significance of this relationship, we split the maximum-light sample in two at (where the strength of both components is equal), and find that the weighted mean stretch of the low is , while the high weighted mean stretch is . This corresponds to a difference in their weighted mean stretches of 3.3.
To better understand the origin of the trend between and stretch, we have studied the pEW of the individual photospheric and high-velocity components as a function of stretch (bottom panels of Fig. 6). We find that the weighted means of the PVF pEW for the and subsamples are different at the 3.6 level, with mean values of Å and Å, respectively. For the HVF, we find the weighted mean pEW of the and subsamples to be different at the 5.4 level, with mean values of Å and Å. This suggests that there are two effects driving the versus stretch relation – there is both a lower contribution from the Ca ii NIR photospheric velocity components in higher-stretch SNe Ia, as well as stronger Ca ii HVF in more luminous SNe Ia. We will discuss possible reasons for this in Section 4.2.
3.3.2 Ca ii HVF strength and spectral velocities
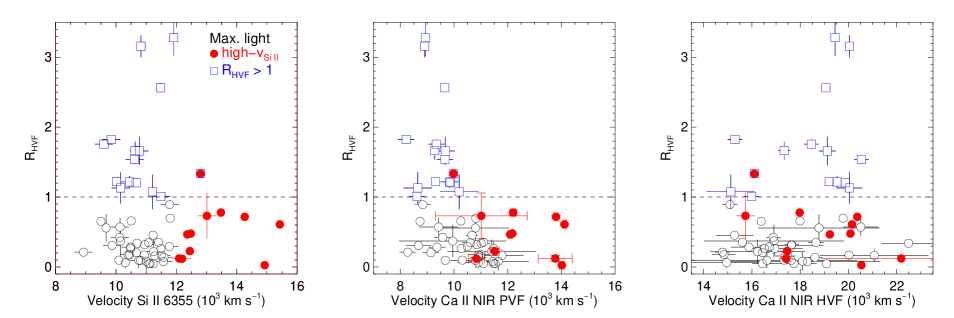
We also investigate the Ca ii NIR as a function of the velocities of the spectral features. In Fig. 7, we show the as a function of the Si ii 6355 Å, Ca ii NIR PVF and Ca ii NIR HVF velocities in the maximum-light sample. While only one SN Ia in our high- sample has a ‘high-’ Si ii 6355 Å value, we do not find a statistically significant difference in the weighted mean Si ii velocities for the high- and low- subsamples.
However, we have also investigated the relationship between the Ca ii NIR and the velocity of the Ca ii NIR components. We find that SNe Ia with high values have higher Ca ii photospheric velocities compared to the low sample (different at the 12.6 level) – the weighted means of the Ca ii NIR PVF velocities for the high- and low- subsamples are and 11,265 161 , respectively. For the high-velocity Ca ii NIR component, we find no significant difference in the weighted mean velocities for the high- and low- subsamples.
3.4 Spectroscopic subclasses
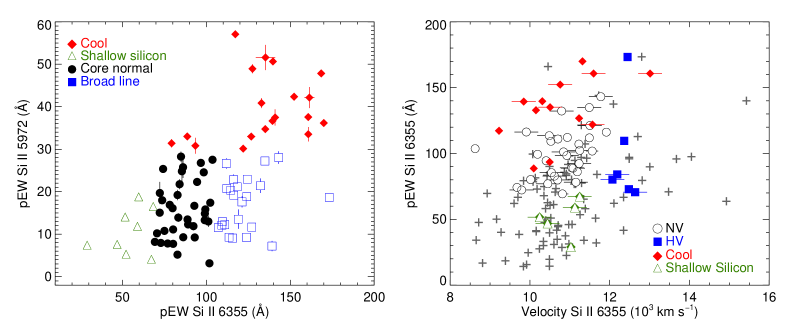
Different classification systems for splitting SNe Ia into spectral subclasses have previously been defined (Branch et al., 2006; Wang et al., 2009). In Fig. 8 (left panel), the pEW Si ii 5972 Å against pEW Si ii 6355 Å of Branch et al. (2006) in the phase range to +5 d is shown. If more than one measurement was available in this phase range, the measurement closest to maximum light was used. The pEW Si ii 5972 Å against pEW Si ii 6355 Å space is divided into four subclasses: ‘cool’ (high pEW Si ii 5972 Å values, SN 1991bg-like objects), ‘shallow silicon’ (both shallow Si ii 5972 Å and Si ii 6355 Å, SN 1991T-like objects), ‘core normal’ (middle range of pEW values, ‘normal’ SNe Ia), and ‘broad line’ (SNe with normal pEW Si ii 5972 but higher Si ii 6355 Å widths). ‘Cool’ SNe Ia also display Ti ii absorption at Å, which is a signature of lower temperatures and less luminous SNe Ia. Of the 86 SNe Ia for which both the pEW Si ii 5972 Å and pEW Si ii 6355 Å could be measured in the phase range to +5 d , we find 36 SNe Ia (42 per cent) that are classified as core-normal, 23 SNe Ia ( per cent) as ‘broad line,’ 8 SNe Ia ( per cent) as ‘shallow silicon’ and 19 SNe Ia ( per cent) as ‘cool.’ The number of SNe Ia falling in the ‘core-normal,’ ‘broad line’ and ‘cool’ subclasses are within per cent of the values found by Blondin et al. (2012) for the CfA SN Ia spectral sample. A larger difference is seen for the ‘shallow silicon’ subclass, where Blondin et al. (2012) found 14 per cent of the SNe fell in it. However, given the relatively small number of objects in this subclass, the difference is not significant.
In the right panel of Fig. 8, the pEW of the Si ii 6355 Å line against its velocity in the phase range 3 to +3 d, as presented by Wang et al. (2009), is shown. Unlike Wang et al. (2009), we do not split the sample into subclasses based on a qualitative visual inspection of the spectra (SN 1991T-like, SN 1991bg-like, ‘normal’). Instead, we use their position in the pEW Si ii 5972 Å against pEW Si ii 6355 Å space (left panel of Fig. 8) to provide a quantitative measure of their peculiarities. We consider the ‘core-normal’ and ‘broad-line’ subgroups to be ‘Branch-normal’ SNe Ia as generally defined in the literature (see Branch et al., 2006), while the ‘cool’ group includes SN 1991bg-like objects and the ‘shallow silicon’ group includes SN 1991T-like objects, but there is not a one-to-one overlap. After excluding SNe Ia falling in the ‘shallow silicon’ and ‘cool’ subgroups of Branch et al. (2006), we follow Wang et al. (2013) and define any of the remaining SNe Ia as ‘Branch-normal’ SNe Ia, and split them into ‘high-’ ( 12000 ) and ‘normal-’ ( 12000 ). A Branch et al. (2006) subclassification could not be made for all the SNe Ia mainly because the S/N was too low in the Si ii 5972 Å region or the feature was contaminated by host-galaxy lines.
3.5 Spectral luminosity indicators
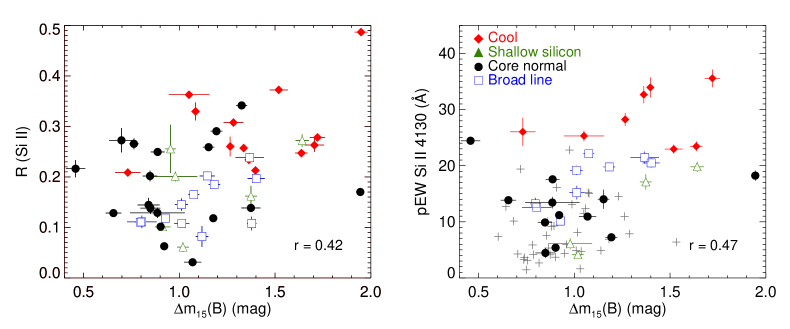
Previous studies have investigated the relation between SN Ia spectral features and light-curve parameters with the aim of improving the use of SNe Ia as distance indicators. In Fig. 9, we have plotted measurements of two well-studied spectral luminosity indicators against light-curve width (stretch): the ratio of the pEW of Si ii 5972 Å to pEW of Si ii 6355 Å line as defined by Hachinger et al. (2008), which is an updated version of the R(Si ii) of Nugent et al. (1995), and the pEW of the Si ii 4130 Å line. Following Blondin et al. (2011), we restrict our sample to spectra in the phase range of to +2.5 d with respect to maximum light. We split the sample into subclasses (‘cool,’ ‘shallow silicon,’ ‘core normal,’ ‘broad line’) as described in Section 3.4. For a SN to be placed in one of these spectral luminosity subclasses, it is necessary that the pEW of the Si ii 5972 Å and the Si ii 6355 Å lines can be measured.
For comparison with previous work, we convert our SiFTO ‘stretch’ values to (Phillips, 1993) using the relation given by Conley et al. (2008). Firstly, we investigate the connection between R(Si ii) and , finding a Pearson coefficient of 0.42 (Spearman rank coefficient of 0.36). For pEW of the Si ii 4130 Å line and , we find a Pearson coefficient of 0.47 (Spearman rank coefficient of 0.43) for the whole sample. These correlation values are of lower significance than previously found - revised values of Blondin et al. (2012)444Some objects were accidentally left out of the original luminosity indicator analysis (Blondin; private communication) for the R(Si ii) and the pEW of the Si ii 4130 Å line against are 0.67 and 0.66, respectively. Silverman et al. (2012a) find values of the correlation coefficient (Spearman rank coefficient) of 0.42 and 0.87 for the R(Si ii) and the pEW of the Si ii 4130 Å line against the SALT2 light-curve width parameter, ‘x1’ (respectively).
We also investigated the correlation between the most promising luminosity indicator (visible to higher redshifts than R(Si ii)), the pEW of the Si ii 4130 Å line and stretch for members of the individual subclasses. We find that when the sample is restricted to SNe Ia falling in the ‘broad line’ subclass alone (just 9 objects), the Pearson coefficient is , meaning a significant correlation between the Si ii 4130 Å pEW of ‘broad line’ SNe Ia and light-curve width.
3.6 Searching for carbon at early times
The presence of C in SN Ia spectra is an excellent tracer of unburnt material, and provides information on the way the star exploded. To investigate the presence of C ii 6580 Å at early times in our sample, we select SNe Ia with spectra at phases before d with respect to maximum light, resulting in a sample of 24 SNe Ia with at least one spectrum in this phase range. Our sample includes 7 spectra of SN 2011fe (Nugent et al., 2011; Parrent et al., 2012). SN 2011fe was found to have clear signatures of C ii detected in its early-time spectra lasting until nearly maximum light, with strongly decreasing strength with time (Parrent et al., 2012). Two other SNe Ia in our sample also have 2 spectra each (PTF10zdk, PTF11hub). Our sample also includes three spectra of SN 2010jn (PTF10ygu; Hachinger et al., 2013) where C ii 6580 Å was not detected. SN 2010jn was an unusual SN Ia with very broad Si ii features, and the highest Si ii velocities of our sample (Fig. 4). If the C ii 6580 Å velocity was also toward the higher end of C ii velocities then it could be blended with the Si ii 6355 Å features, resulting in a null detection (for a discussion, see Thomas et al., 2011).
We follow the nomenclature of Folatelli et al. (2012), defining the detection of C ii 6580 Å as ‘absorption,’ ‘flat,’ or ‘no detection’ based on a visual inspection of the spectra. A spectrum in the ‘absorption’ class shows a clear absorption feature at the expected position of C ii 6580 Å (–6350 Å, assuming typical velocities of 10,400–13,500 ), while the ‘flat’ profile is one that appears to have a suppressed Si ii 6355 Å emission resulting in a flat profile in the C ii region. A ‘no detection’ label means straightforwardly that no flat or absorption profile is found. A ‘?’ symbol after the initial classification means a low S/N in the C ii region and an uncertain feature classification.
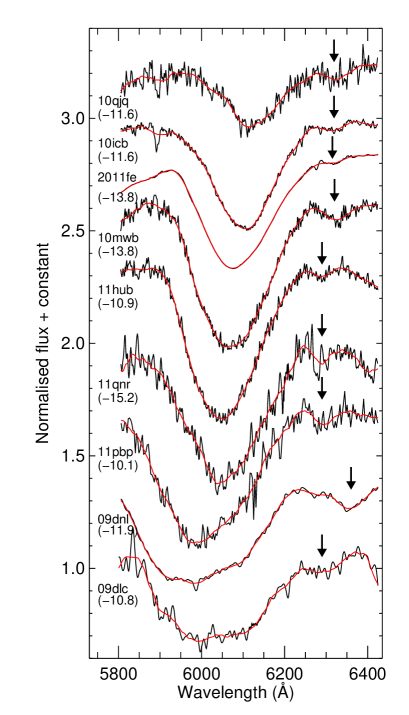
In our sample, we find 9 SNe Ia (including SN 2011fe) with a definite ‘absorption’ feature at the position of C ii 6580 Å with an additional two SNe Ia having an ‘absorption?’ feature (Table 3). Fig. 10 shows the SNe Ia where C ii 6458 Å has been positively detected in their spectra. Two SNe Ia are classified as ‘flat’ profiles, two as ‘flat?,’ six as ‘no detection,’ and three SNe Ia fall in the ‘no detection?’ subclass. These results suggest that a lower limit of per cent of SNe Ia show C ii features (i.e., with an ‘absorption classification’) if observed at earlier than d.
Similarly to the trend first identified by Thomas et al. (2011), we also find a correlation between light-curve width and the presence of C ii, in the sense that SNe Ia with C ii features have narrower light curves on average. The weighted mean stretch distribution for the ‘absorption’ sample is and for the ‘no detection’ sample is , different at a significance 3.5.
We also investigate the connection between Ca ii NIR and the presence of C ii 6580 Å – 12 of the SNe Ia with a spectrum before d have a measurement around maximum light. Of the six SNe Ia in the sample in the ‘absorption’ group that have a measured value of , five have and one (PTF09dlc) has . The three SNe Ia in the sample in the ‘no detection’ C group have . Therefore, we do not identify any trends between and detection of C ii 6580 Å in this small sample.
| C ii class | No. of SNe Ia | % of total sample |
|---|---|---|
| Absorption | 9 | 37.5 |
| Flat emission | 2 | 8.3 |
| No detection | 6 | 25.0 |
| Absorption? | 2 | 8.3 |
| Flat emission? | 2 | 8.3 |
| No detection? | 3 | 12.5 |
4 Discussion
We have presented spectra of 264 SNe Ia having at least one spectrum before +5 d from the PTF SN Ia programme. These data were combined with light-curve width information to provide a new low-redshift SN Ia dataset (unbiased with respect to host-galaxy properties) from which the diversity of SNe Ia can be investigated and correlations between spectral properties, as well as with light-curve width, can be determined. An accompanying analysis of the PTF spectral sample combined with host-galaxy information is given by Pan et al. (submitted).
4.1 The diversity of Si ii velocities
The connection between spectral velocities and light-curve properties provides important information on the configuration of the explosion. Spectral feature velocities provide us with information on the location of line-forming regions. We find that mean velocities for the weaker Si ii 4130 and Si ii 5972 Å features are lower than for the stronger Si ii 6355 Å line, whose line-forming region extends to higher velocity.
Wang et al. (2009) suggested that there are two distinct spectroscopic subclasses for SNe Ia: those with Si ii 6355 Å velocities above 11,800 at maximum light, and those with values below. Wang et al. (2013) investigated the galaxy environments of these SNe Ia with high Si ii 6355 Å velocities and fo und that they occur preferentially in more massive host galaxies and in the central regions of their hosts, compared to SNe Ia with lower Si ii 6355 Å velocities that tend to occur at larger radii. About 33 per cent of Wang et al. (2013) sample fall in the high-velocity subclass ( 12,000 ). For our sample, we find significantly fewer SNe Ia in this high-velocity subgroup ( per cent). A study focussing on the connection between host-galaxy properties and spectral features in the PTF sample (Pan et al. submitted) find that this is at least partially caused by selection biases in the LOSS SN sample that results in more massive host galaxies compared to our SN sample (although this does not completely explain the different number of high- events found).
We have identified a strong relation between the Si ii velocity and the velocity of the Ca ii NIR PVF. SNe Ia with higher Si ii velocities have higher Ca ii NIR PVF velocities (8.8-). This result is in agreement with both one-dimensional deflagration and delayed-detonation models (e.g., Iwamoto et al., 1999; Blondin et al., 2013; Mazzali et al., 2014) showing that the distribution of intermediate-mass elements such as Si and Ca in the ejecta is roughly similar.
High-velocity features in the Si ii 6355 Å feature were first suggested to be present at early times in SN 1990N (Mazzali, 2001), and since then have been identified in a number of SNe Ia (Nugent et al., 2011; Parrent et al., 2012; Childress et al., 2013). A contribution from a high-velocity component in the Si ii 6355 Å line may be present but blended with the photospheric component, as in SN 1990N, or isolated, as in the case of SN 2011fr. One way of testing for the presence of high-velocity features in the Si ii lines is to compare their velocities to the Ca ii NIR PVF velocity: both are intermediate-mass elements and should have similar mass distributions in the ejecta. We find in an early-time sample (15 to 7 d), for which both Ca ii NIR PVF and Si ii 6355 Å velocity measurements are available, the velocity of the Si ii 6355 Å line is higher than the Ca ii NIR PVF velocity at the 2.6- level. This suggests that there may be a weak contribution from high-velocity components to the strong Si ii 6355 Å feature at early times.
4.2 The origin of high-velocity Ca ii features
One of the main foci of this work is to study the presence of high-velocity features in the Ca ii NIR triplet and measure their contribution to the overall profile. In many cases, the high-velocity features are blended with their corresponding photospheric components. However, they can be disentangled using multi-Gaussian spectral fitting techniques. The physical origin for high-velocity features is unclear – the two main interpretations for these high-velocity features are either an abundance or density enhancement at large radii. An abundance enhancement of Ca could cause these high-velocity features but would need very large enhancements to explain the strong high-velocities features seen in some SNe Ia (Mazzali et al., 2005). A density enhancement could arise from either circumstellar material or could be intrinsic to the SN, coming from material in the outer layers (Mazzali et al., 2005; Tanaka et al., 2008). Mixing of H from CSM can increase the rate of recombination resulting in stronger Ca ii features at high velocity (Mazzali et al., 2005; Tanaka et al., 2008). We have found that the mean Ca ii NIR HVF velocity decreases significantly faster than the mean PVF velocity from 18 d to +5 d. The faster evolution of the HVF is most easily explained by HVF becoming optically thin quicker than the PVF since it is formed in a lower density region farther out in the ejecta, as discussed in Mazzali et al. (2005).
The HVF velocities are found to be significantly higher than the PVF velocities for our sample, with a mean velocity difference between the two features of . This is much higher than the greatest difference enforced by the fitting routine of . This large mean velocity difference suggests that the material that gives rise to the Ca ii HVF should be located at the edge of the ejecta. It may be part of the ejecta from the explosion, or could be due to a small mass of CSM dragged by the exploding material. We do not identify a trend between Si ii 6355 Å velocity and the velocity of the Ca ii NIR HVF. If these velocities were connected, then this could suggest the Ca ii HVF must be intrinsic to the SN. However, since they are unconnected, the possibility that the origin of the Ca ii HVF is external to the SN (from CSM) cannot be ruled out.
4.2.1 How common are high-velocity Ca ii features?
We wish to estimate how common are high-velocity Ca ii features in SNe Ia. As expected, a contribution from a Ca ii photospheric component is necessary to fit the Ca ii NIR feature for all the SNe Ia in our sample. We estimate the percentage of SNe Ia that require a contribution to the Ca ii NIR triplet from a high-velocity component by calculating the number of SNe Ia with a HVF pEW that is greater than the minimum PVF pEW in the same phase range. This is equivalent to assuming that if the pEW of the component is lower than the lowest PVF pEW, it is essentially negligible, while conservatively allowing for small nonzero HVF pEW in the fitting routine.
At early phases (before d), we find that per cent of SNe Ia (18 out of 19 SNe Ia) require a contribution from a high-velocity Ca ii NIR feature. This drops to per cent in the maximum-light sample (5 to +5 d), showing that HVF are more prevalent at early times compared to maximum light. This demonstrates that nearly all SNe Ia have high-velocity Ca ii NIR features at early times, confirming the suggestion of Mazzali et al. (2005).
4.2.2 Relative strength of high-velocity Ca ii features
The of the Ca ii NIR triplet was defined by Childress et al. (2014) to quantify the strength of HVF relative to the PVF in the Ca ii NIR triplet. They found, in a maximum-light sample, that SNe Ia with higher values have broader light curves. We confirm this trend in our sample (Fig. 6), and also show the trend is present at earlier phases. At early times (15 to 7 d), we find that per cent of SNe Ia have values of greater than one (i.e., where the Ca ii HVF dominates over the Ca ii PVF), decreasing to per cent of SNe Ia in our maximum-light sample. There does not appear to be a one-to-one correlation between the and the light-curve width, but instead an additional source of objects that is contributing, with greater than one and light-curve widths of (as shown in Fig. 6). When the sample was split in two bins (high and low ), we found that there was a 3.3 difference between the weighted mean stretches.
We have also investigated the origin of this connection by studying the individual Ca ii NIR HVF and PVF pEW as a function of light-curve width. It was found that dominant driver of the observed relation between and stretch is that more luminous SNe Ia have higher pEW of their Ca ii NIR HVF. This provides a link between more luminous SNe Ia and the presence of more high-velocity material, which could be caused by CSM or be intrinsic to the SN ejecta.
The more luminous SNe Ia are also found to have, on average, weaker PVF pEW. A possible reason for this is that in more luminous SNe Ia there is more burning of intermediate-mass elements in more luminous (broader light curve) SNe Ia (Mazzali et al., 2007), resulting in less Ca ii at the location of the photosphere, and hence a weaker PVF pEW. However, in this scenario, the photosphere may be expected to be located farther out in more luminous SNe Ia (higher Ca ii PVF velocity), which was not seen for our sample in Section 3.2. Another possibility is that the Ca ii photospheric component feature is weaker in more luminous SNe Ia because of a higher Ca ionisation fraction in these events. For the higher HVF pEW in more luminous SNe Ia, this could possibly be explained by an additional contribution at high-velocity to the SN Ia feature, which could be caused by CSM or be intrinsic to the SN ejecta.
As shown by Childress et al. (2014), SNe Ia appear to have either high values or high Si ii 6355 Å velocities but not both (Fig. 7) – we find only one SN Ia overlapping in these subsamples. However, the weighted mean Si ii velocities between the high- and low- subsamples is not significant. We also identified a connection between Si ii 6355 Å velocity and Ca ii NIR PVF velocity - SNe Ia with high Si ii 6355 Å velocities have, on average, high Ca ii NIR PVF velocities but rarely a high value. Pan et al. (submitted) studies the relation between the Ca ii and host-galaxy properties, finding that SNe Ia with high values of are found preferentially in lower stellar mass hosts, while SNe Ia with high-values are preferentially found in higher stellar mass populations.
This could suggest that these two groups, SNe Ia with high and SNe Ia with high Si ii velocities, are distinct and not generally overlapping in their spectral properties. The SNe Ia with high values have lower Ca ii PVF velocities, lower Si ii velocities, broader light curves (stretch ) and occur in lower stellar mass hosts. Those in the high-velocity Si ii 6355 Å subgroup have higher Ca ii PVF velocities, lower values, a range of light-curve widths ( stretch ) and tend to occur in higher stellar mass host galaxies. The effect of observing an asymmetric explosion from different viewing angles can not explain these observations, since then there would be no connection between the presence (or absence) of Ca ii and high-values and host-galaxy properties.
Maguire et al. (2013) showed that SNe Ia showing blueshifted narrow Na i D features, thought to be indicative of circumstellar material (e.g., Patat et al., 2007; Sternberg et al., 2011), also have broader light curves and occur more frequently in late-type galaxies. Some SNe Ia with blueshifted Na i D features in the sample also fall in the high-velocity Si ii 6355 Å subgroup, but not all (Foley et al., 2012; Maguire et al., 2013). However, the high-velocity Si ii 6355 Å subgroup have a preference for occurring in the centre of galaxies and in more massive host galaxies (Wang et al., 2013) at odds with the preference of SNe Ia with blueshifted Na i D features to occur late-type galaxies (low stellar mass, high specific star formation rate). Therefore, further investigation between the presence of blueshifted Na i D features and Ca ii HVF is necessary.
4.2.3 Ca ii velocity and light-curve parameters
A correlation between Ca ii velocity and light-curve width (SNe Ia with broader light curves having higher Ca ii velocities) was previously identified for the Ca ii H&K feature (Wells et al., 1994; Fisher et al., 1995; Maguire et al., 2012; Foley, 2013). The origin of the correlation was questioned because the Ca ii H&K region may be contaminated by weaker lines such as Si ii 3858 Å. However, Childress et al. (2014) showed that the strength of high-velocity components relative to their photospheric components in the cleaner Ca ii NIR feature is stronger in SNe Ia with broader light curves, which could therefore, influence the measured Ca ii velocities and produce the observed trends.
For our sample, we analysed the individual Ca ii NIR HVF and PVF velocities as a function of stretch and find a weak correlation (2.8-) between the Ca ii NIR HVF and the light-curve width. This suggests that previously observed trends in the Ca ii H&K region (measured using a single Gaussian fit) may be somewhat driven by a higher Ca ii HVF velocity in more luminous SNe Ia, but is likely also driven by the higher relative strength of Ca ii HVF in more luminous SNe Ia.
4.3 The future of SN Ia spectral luminosity indicators
Recent studies have shown correlations between spectral luminosity indicators and light-curve width in SNe Ia at varying degrees of significance. No studies combining both photometric and spectroscopic data have dramatically increased the performance of purely photometric data. However, studies have uncovered spectral luminosity indicators that can be used to standardise SN Ia luminosities, with varying levels of significance (e.g., Nugent et al., 1995; Bronder et al., 2008; Hachinger et al., 2008; Bailey et al., 2009; Blondin et al., 2011; Walker et al., 2011; Nordin et al., 2011; Chotard et al., 2011; Silverman et al., 2012a; Blondin et al., 2012). The main cause of this lack of an improvement appears to be that the light-curve width and spectral luminosity indicators such as R(Si ii) and the Si ii 4130 Å pEW appear to trace different properties of the SNe Ia, with SNe Ia with very different light-curve widths having similar Si ii 4130 Å pEW values.
We find, on average, lower significance trends for both the R(Si ii) and the Si ii 4130 Å pEW against light curve stretch than previous studies for a number of possible reasons. The most likely reason is the increased number of SNe Ia with unusual properties that are present in the PTF SN Ia sample. However, as noted by Blondin et al. (2012), by selecting SNe Ia in just one of the subclasses of Branch et al. (2006), the significance of the trends can be increased. When we select only SNe Ia falling in the ‘broad line’ subclass of Branch et al. (2006), the significance of the correlation is improved and we find for this subclass a Pearson correlation of for the Si ii 4130 Å pEW against light-curve stretch. Therefore, with careful selection of the objects is it is possible to obtain a reasonable correlation between Si ii 4130 Å pEW and light-curve width for our sample, but similarly to previous studies, not significantly improve upon the use of photometric data.
Given the increased difficulty of obtaining spectra compared to obtaining photometry and the observed scatter in the correlation, the future of spectral luminosity indicators for SNe Ia in their current form is likely to be limited. However, ongoing spectroscopic surveys such as Nearby Supernova Factory (Aldering et al., 2002; Lantz et al., 2004) that are obtaining high-quality multi-epoch spectra of a large sample of SNe Ia may find more sophisticated ways to connect spectral features to luminosity instead of simple pEW measurements and ratios.
4.4 Ubiquity of C ii and connection to progenitor models
Identifying the presence of C ii in SN Ia spectra is a key diagnostic of unburnt material in the SN ejecta, which provides important links to SN Ia explosion models, with different models predicting different amounts of C ii left over in the outer layers. Systematic searches for C in the early-time spectra of SNe Ia, when the outer layers are still visible, have been performed (Thomas et al., 2007, 2011; Parrent et al., 2011; Folatelli et al., 2012; Silverman & Filippenko, 2012). The most recent results of Folatelli et al. (2012) and Silverman & Filippenko (2012) have determined that 30–40 per cent of SNe Ia with spectra around d have a clear detection of C ii 6580 Å in their spectra, and is suspected to be even higher when spectra earlier than 10 d are used (Thomas et al., 2011). The strength of C ii 6580 Å features was found to decrease rapidly with time with nearly no detections by the time of maximum light. However, the number of published spectra available at these early phases is small and it remains unclear if the majority of SNe Ia would show C features if observations were obtained early enough.
Using a new sample of 24 SNe Ia obtained by PTF with at least one spectrum before d with respect to maximum, we find that per cent of SNe Ia at these early phases have a clear detection of C ii 6580 Å in their spectra. If we include ‘absorption?’ detections and ‘flat’ profiles, we find that as much as per cent may have C present. However, per cent of SNe Ia show no clear detection of C ii in their spectra when observed at these early phases.
Previous studies such as Folatelli et al. (2012) have shown that the velocity of the C ii 6580 Å feature is lower than expected reaching as low as 11,000 , not much higher than the average Si ii 6355 Å velocity. For our sample, the minimum of the C ii 6580 Å feature ranges from 10,700–13,500 . The true range could extend to higher velocities than are measured since at velocities in the range of 15,000-27,000 , the C ii 6580 Å feature becomes indistinguishable from the much stronger Si ii 6355 Å blueward of it (Thomas et al., 2011; Parrent et al., 2012).
We estimate that the lowest velocity (measured from the red edge of the absorption profile) at which C ii is present is in the range 7000–11,800 . These relatively low velocities suggest that the unburnt material must be mixed deep into the ejecta and may be caused by macroscopic mixing since spherically symmetric models of deflagration or detonation lead to more burning below 15000 (Nomoto et al., 1984; Iwamoto et al., 1999; Folatelli et al., 2012). However, the two-dimensional delayed detonation models of Maeda et al. (2010) have C existing as low as , closer to the observed values than the one-dimensional models. Using spectral modelling, Folatelli et al. (2012) have estimated the mass of C necessary to produce this feature to be 10-3–10-2 M⊙.
We confirm the result of Thomas et al. (2011) that SNe Ia where C ii features are identified have narrower light curves than those without a detected C ii 6580 Å feature – the weighted mean light-curve widths for the ‘absorption’ and ‘no detection’ groups are different at the 3.5-. This could be because more luminous SNe Ia produce more Fe-group elements and have more complete burning and therefore, the amount of C ii remaining is less in more luminous events. Alternatively, in more luminous, higher-stretch events, the C ii 6580 Å feature may be present but at high velocities and therefore, blended with the much stronger Si ii 6355 Å feature (Parrent et al., 2012). The study of high-S/N spectra of high-stretch SNe Ia at early times could allow us to investigate the presence of C ii in these objects.
5 Conclusions
We have presented the first spectroscopic analysis of the untargeted, low-redshift PTF SN Ia sample, analysing 359 spectra of 264 SNe at at phase up to +5 d with respect to maximum brightness. We have investigated the link between spectral properties and light-curve width, and searched for C ii 6580 Å features and the presence of high-velocity components in the Ca ii NIR feature, which can be used to distinguish progenitor scenarios. Our main results are as follows.
- 1.
- 2.
-
3.
SNe Ia falling in the Si ii 6355 Å high-velocity ( 12,000 ) subgroup also have higher Ca ii NIR photospheric-velocity component velocities (Section 3.2, Fig. 5). The lack of a correlation between the Si ii 6355 Å velocity and the Ca ii high-velocity component velocity could suggest that the material producing the Ca ii high-velocity features is not intrinsic to the SNe, and could be caused by circumstellar material (Fig. 5).
-
4.
SNe Ia with broader light curve have, on average, a larger contribution from a Ca ii high-velocity component to their Ca ii NIR feature relative to a photospheric component (larger , in agreement with the results of Childress et al., 2014). This is driven mainly by a higher pEW of the Ca ii high-velocity component in SNe Ia with large values, but it is also affected by lower pEW of the Ca ii photospheric-velocity component in these SNe Ia (Section 3.3.1, Fig. 6)
- 5.
-
6.
At least per cent (and as much as 55 per cent) of SNe Ia show signs of unburnt material in the form of C ii 6580 Å features if observed at phase earlier than 10 d with respect to maximum brightness. Similarly to Folatelli et al. (2012), we find that SNe Ia with C ii features tend to have narrower light curves on average (Section 3.6).
-
7.
25 per cent of SNe Ia with a spectrum before 10 d with respect to maximum light do not show a C ii 6580 Å, and these SNe Ia have, on average, broader light curves (Section 3.6). This trend may suggest more burning of C in more luminous SNe Ia.
We have confirmed that there is much diversity in the spectral properties of SNe Ia. We have attempted to connect these observed properties and determine if there are distinct subclasses of SNe Ia or trends in their properties. Any explosion models must be capable of explaining the presence of high-velocity Ca ii features in the vast majority of SNe Ia at early times, the correlation in their strength with light-curve shape, as well as the presence of C ii in at least per cent of cases.
6 Acknowledgements
K.M. is supported by a Marie Curie Intra-European Fellowship, within the 7th European Community Framework Programme (FP7). M.S. acknowledges support from the Royal Society. A.G.Y is supported by the EU/FP7-ERC grant no [307260], the Quantum Universe I-Core program by the Israeli Committee for planning and funding, the ISF, GIF, Minerva, and ISF grants, and Kimmel and ARCHES awards. N.C. acknowledges support from the Lyon Institute of Origins under grant ANR-10-LABX-66. M.M.K. acknowledges generous support from the Hubble Fellowship and Carnegie-Princeton Fellowship. J.M.S. is supported by an NSF Astronomy and Astrophysics Postdoctoral Fellowship under award AST-1302771. A.V.F.’s supernova group at UC Berkeley has received generous financial assistance from Gary and Cynthia Bengier, the Christopher R. Redlich Fund, the Richard and Rhoda Goldman Fund, the TABASGO Foundation, and NSF grant AST-1211916.
The William Herschel Telescope is operated on the island of La Palma by the Isaac Newton Group in the Spanish Observatorio del Roque de los Muchachos of the Instituto de Astrofísica de Canarias. Based on observations (GN-2010A-Q-20, GN- 2010B-Q-13, GN-2011A-Q-16 and GS-2009B-Q-11) obtained at the Gemini Observatory, which is operated by the Association of Universities for Research in Astronomy, Inc., under a cooperative agreement with the NSF on behalf of the Gemini partnership: the National Science Foundation (United States), the National Research Council (Canada), CONICYT (Chile), the Australian Research Council (Australia), Ministério da Ciência, Tecnologia e Inovação (Brazil) and Ministerio de Ciencia, Tecnología e Innovación Productiva (Argentina). Observations were obtained with the Samuel Oschin Telescope at the Palomar Observatory as part of the Palomar Transient Factory project, a scientific collaboration between the California Institute of Technology, Columbia University, La Cumbres Observatory, the Lawrence Berkeley National Laboratory, the National Energy Research Scientific Computing Center, the University of Oxford, and the Weizmann Institute of Science. The authors would like to thank all the observers and data reducers of the collaboration for their hard work throughout the survey (in particular I. Arcavi, S. Ben-Ami, J. Bloom, S. B. Cenko, M. Graham, A. Horesh, E. Hsiao, I. Kleiser, S. Kulkarni, A. Miller, E. Ofek, J. Parrent, D. Perley, R. Quimby, A. Sternberg, N. Suzuki, O. Yaron, D. Xu). This publication has been made possible by the participation of more than 10,000 volunteers in the Galaxy Zoo: Supernova project (http://supernova.galaxyzoo.org/authors).
The Liverpool Telescope is operated on the island of La Palma by Liverpool John Moores University in the Spanish Observatorio del Roque de los Muchachos of the Instituto de Astrofisica de Canarias with financial support from the UK Science and Technology Facilities Council. This work also makes use of observations from the LCOGT network. Some of the data presented herein were obtained at the W.M. Keck Observatory, which is operated as a scientific partnership among the California Institute of Technology, the University of California, and the National Aeronautics and Space Administration (NASA). The Observatory was made possible by the generous financial support of the W.M. Keck Foundation. We thank the dedicated staffs at all the observatories we used for their excellent assistance with the observations. Based on data taken at the European Organisation for Astronomical Research in the Southern Hemisphere, Chile, under program IDs 084.A-0149(A) and 085.A-0777(A). Observations obtained with the SuperNova Integral Field Spectrograph on the University of Hawaii 2.2-m telescope as part of the Nearby Supernova Factory II project, a scientific collaboration between the Centre de Recherche Astronomique de Lyon, Institut de Physique Nucléaire de Lyon, Laboratoire de Physique Nucléaire et des Hautes Energies, Lawrence Berkeley National Laboratory, Yale University, University of Bonn, Max Planck Institute for Astrophysics, Tsinghua Center for Astrophysics, and Centre de Physique des Particules de Marseille. This research has made use of the NASA/IPAC Extragalactic Database (NED) which is operated by the Jet Propulsion Laboratory, California Institute of Technology, under contract with NASA.
References
- Aldering et al. (2002) Aldering G. et al., 2002, in Survey and Other Telescope Technologies and Discoveries. Edited by Tyson, J. Anthony; Wolff, Sidney. Proceedings of the SPIE, Volume 4836, pp. 61-72 (2002)., pp. 61–72
- Altavilla et al. (2007) Altavilla G. et al., 2007, A&A, 475, 585
- Arnett (1969) Arnett W. D., 1969, ApJS, 5, 180
- Bailey et al. (2009) Bailey S. et al., 2009, A&A, 500, L17
- Benetti et al. (2005) Benetti S. et al., 2005, ApJ, 623, 1011
- Betoule et al. (2014) Betoule M. et al., 2014, arXiv:1401.4064
- Betoule et al. (2013) Betoule M. et al., 2013, A&A, 552, A124
- Blondin et al. (2013) Blondin S., Dessart L., Hillier D. J., Khokhlov A. M., 2013, MNRAS, 429, 2127
- Blondin et al. (2006) Blondin S. et al., 2006, AJ, 131, 1648
- Blondin et al. (2011) Blondin S., Mandel K. S., Kirshner R. P., 2011, A&A, 526, A81
- Blondin et al. (2012) Blondin S. et al., 2012, AJ, 143, 126
- Bloom et al. (2012) Bloom J. S. et al., 2012, PASP, 124, 1175
- Branch et al. (2006) Branch D. et al., 2006, PASP, 118, 560
- Bronder et al. (2008) Bronder T. J. et al., 2008, A&A, 477, 717
- Childress et al. (2014) Childress M. J., Filippenko A. V., Ganeshalingam M., Schmidt B. P., 2014, MNRAS, 437, 338
- Childress et al. (2013) Childress M. J. et al., 2013, ApJ, 770, 29
- Chotard et al. (2011) Chotard N. et al., 2011, A&A, 529, L4+
- Conley et al. (2011) Conley A. et al., 2011, ApJS, 192, 1
- Conley et al. (2008) Conley A. et al., 2008, ApJ, 681, 482
- Dilday et al. (2012) Dilday B. et al., 2012, Science, 337, 942
- D’Odorico et al. (2006) D’Odorico S. et al., 2006, in Society of Photo-Optical Instrumentation Engineers (SPIE) Conference Series, Vol. 6269, Society of Photo-Optical Instrumentation Engineers (SPIE) Conference Series
- Faber et al. (2003) Faber S. M. et al., 2003, in Society of Photo-Optical Instrumentation Engineers (SPIE) Conference Series, Vol. 4841, Instrument Design and Performance for Optical/Infrared Ground-based Telescopes, Iye M., Moorwood A. F. M., eds., pp. 1657–1669
- Filippenko (1982) Filippenko A. V., 1982, PASP, 94, 715
- Filippenko (1997) Filippenko A. V., 1997, ARA&A, 35, 309
- Fisher et al. (1995) Fisher A., Branch D., Hoflich P., Khokhlov A., 1995, ApJ, 447, L73
- Folatelli et al. (2012) Folatelli G. et al., 2012, ApJ, 745, 74
- Foley (2012) Foley R. J., 2012, ApJ, 748, 127
- Foley (2013) Foley R. J., 2013, MNRAS, 435, 273
- Foley et al. (2011) Foley R. J., Sanders N. E., Kirshner R. P., 2011, ApJ, 742, 89
- Foley et al. (2012) Foley R. J. et al., 2012, ApJ, 752, 101
- Ganeshalingam et al. (2013) Ganeshalingam M., Li W., Filippenko A. V., 2013, MNRAS, 433, 2240
- Gerardy et al. (2004) Gerardy C. L. et al., 2004, ApJ, 607, 391
- Gilfanov & Bogdán (2010) Gilfanov M., Bogdán Á., 2010, Nature, 463, 924
- Guy et al. (2010) Guy J. et al., 2010, A&A, 523, A7+
- Hachinger et al. (2013) Hachinger S. et al., 2013, MNRAS, 429, 2228
- Hachinger et al. (2008) Hachinger S., Mazzali P. A., Tanaka M., Hillebrandt W., Benetti S., 2008, MNRAS, 389, 1087
- Hicken et al. (2007) Hicken M., Garnavich P. M., Prieto J. L., Blondin S., DePoy D. L., Kirshner R. P., Parrent J., 2007, ApJ, 669, L17
- Hoeflich et al. (1995) Hoeflich P., Khokhlov A. M., Wheeler J. C., 1995, ApJ, 444, 831
- Hook et al. (2004) Hook I. M., Jørgensen I., Allington-Smith J. R., Davies R. L., Metcalfe N., Murowinski R. G., Crampton D., 2004, PASP, 116, 425
- Howell et al. (2006) Howell D. A. et al., 2006, Nature, 443, 308
- Iben & Tutukov (1984) Iben I., Tutukov A. V., 1984, ApJS, 54, 335
- Iwamoto et al. (1999) Iwamoto K., Brachwitz F., Nomoto K., Kishimoto N., Umeda H., Hix W. R., Thielemann F.-K., 1999, ApJS, 125, 439
- Kelly (2007) Kelly B. C., 2007, ApJ, 665, 1489
- Kessler et al. (2009) Kessler R. et al., 2009, ApJS, 185, 32
- Khokhlov (1991) Khokhlov A. M., 1991, A&A, 245, 114
- Kozma et al. (2005) Kozma C., Fransson C., Hillebrandt W., Travaglio C., Sollerman J., Reinecke M., Röpke F. K., Spyromilio J., 2005, A&A, 437, 983
- Laher et al. (2014) Laher R. R. et al., 2014, arXiv:1404.1953
- Lantz et al. (2004) Lantz B. et al., 2004, in Society of Photo-Optical Instrumentation Engineers (SPIE) Conference Series, Vol. 5249, Optical Design and Engineering, Mazuray L., Rogers P. J., Wartmann R., eds., pp. 146–155
- Law et al. (2009) Law N. M. et al., 2009, PASP, 121, 1395
- Li et al. (2011) Li W. et al., 2011, Nature, 480, 348
- Livne & Glasner (1990) Livne E., Glasner A. S., 1990, ApJ, 361, 244
- Maeda et al. (2010) Maeda K., Röpke F. K., Fink M., Hillebrandt W., Travaglio C., Thielemann F., 2010, ApJ, 712, 624
- Maguire et al. (2012) Maguire K. et al., 2012, MNRAS, 426, 2359
- Maguire et al. (2013) Maguire K. et al., 2013, MNRAS, 436, 222
- Maoz et al. (2013) Maoz D., Mannucci F., Nelemans G., 2013, arXiv:1312.0628
- Matheson et al. (2008) Matheson T. et al., 2008, AJ, 135, 1598
- Mazzali (2001) Mazzali P. A., 2001, MNRAS, 321, 341
- Mazzali et al. (2005) Mazzali P. A. et al., 2005, ApJ, 623, L37
- Mazzali et al. (2007) Mazzali P. A., Röpke F. K., Benetti S., Hillebrandt W., 2007, Science, 315, 825
- Mazzali et al. (2014) Mazzali P. A. et al., 2014, MNRAS, 439, 1959
- Miller & Stone (1993) Miller J. S., Stone R., 1993, Lick obs. Tech. rep., University of California
- Nomoto et al. (1984) Nomoto K., Thielemann F.-K., Yokoi K., 1984, ApJ, 286, 644
- Nordin et al. (2011) Nordin J. et al., 2011, ApJ, 734, 42
- Nugent et al. (1995) Nugent P., Phillips M., Baron E., Branch D., Hauschildt P., 1995, ApJ, 455, L147+
- Nugent et al. (2011) Nugent P. E. et al., 2011, Nature, 480, 344
- Ofek et al. (2012) Ofek E. O. et al., 2012, PASP, 124, 854
- Oke et al. (1995) Oke J. B. et al., 1995, PASP, 107, 375
- Oke & Gunn (1982) Oke J. B., Gunn J. E., 1982, PASP, 94, 586
- Parrent et al. (2012) Parrent J. T. et al., 2012, ApJ, 752, L26
- Parrent et al. (2011) Parrent J. T. et al., 2011, ApJ, 732, 30
- Patat et al. (2007) Patat F. et al., 2007, Science, 317, 924
- Perlmutter et al. (1999) Perlmutter S. et al., 1999, ApJ, 517, 565
- Perrett et al. (2010) Perrett K. et al., 2010, AJ, 140, 518
- Phillips (1993) Phillips M. M., 1993, ApJ, 413, L105
- Rau et al. (2009) Rau A. et al., 2009, PASP, 121, 1334
- Rest et al. (2013) Rest A. et al., 2013, arXiv:1310.3828
- Riess et al. (1998) Riess A. G. et al., 1998, AJ, 116, 1009
- Riess et al. (2007) Riess A. G. et al., 2007, ApJ, 659, 98
- Röpke (2005) Röpke F. K., 2005, A&A, 432, 969
- Röpke & Niemeyer (2007) Röpke F. K., Niemeyer J. C., 2007, A&A, 464, 683
- Savitzky & Golay (1964) Savitzky A., Golay M. J. E., 1964, Analytical Chemistry, 36, 1627
- Scalzo et al. (2010) Scalzo R. A. et al., 2010, ApJ, 713, 1073
- Schaefer & Pagnotta (2012) Schaefer B. E., Pagnotta A., 2012, Nature, 481, 164
- Shen & Bildsten (2014) Shen K. J., Bildsten L., 2014, ApJ, 785, 61
- Silverman & Filippenko (2012) Silverman J. M., Filippenko A. V., 2012, MNRAS, 425, 1917
- Silverman et al. (2012a) Silverman J. M., Ganeshalingam M., Li W., Filippenko A. V., 2012a, MNRAS, 425, 1889
- Silverman et al. (2011) Silverman J. M., Ganeshalingam M., Li W., Filippenko A. V., Miller A. A., Poznanski D., 2011, MNRAS, 410, 585
- Silverman et al. (2012b) Silverman J. M., Kong J. J., Filippenko A. V., 2012b, MNRAS, 425, 1819
- Smith et al. (2011) Smith A. M. et al., 2011, MNRAS, 412, 1309
- Steele et al. (2004) Steele I. A. et al., 2004, in Society of Photo-Optical Instrumentation Engineers (SPIE) Conference Series, Vol. 5489, Society of Photo-Optical Instrumentation Engineers (SPIE) Conference Series, Oschmann Jr. J. M., ed., pp. 679–692
- Sternberg et al. (2011) Sternberg A. et al., 2011, Science, 333, 856
- Sullivan et al. (2011) Sullivan M. et al., 2011, ApJ, 737, 102
- Suzuki et al. (2012) Suzuki N. et al., 2012, ApJ, 746, 85
- Tanaka et al. (2008) Tanaka M. et al., 2008, ApJ, 677, 448
- Taubenberger et al. (2013) Taubenberger S., Kromer M., Pakmor R., Pignata G., Maeda K., Hachinger S., Leibundgut B., Hillebrandt W., 2013, ApJ, 775, L43
- Thomas et al. (2007) Thomas R. C. et al., 2007, ApJ, 654, L53
- Thomas et al. (2011) Thomas R. C. et al., 2011, ApJ, 743, 27
- Vernet et al. (2011) Vernet J. et al., 2011, A&A, 536, A105
- Walker et al. (2011) Walker E. S. et al., 2011, MNRAS, 410, 1262
- Wang et al. (2009) Wang X. et al., 2009, ApJ, 699, L139
- Wang et al. (2013) Wang X., Wang L., Filippenko A. V., Zhang T., Zhao X., 2013, Science, 340, 170
- Webbink (1984) Webbink R. F., 1984, ApJ, 277, 355
- Wells et al. (1994) Wells L. A. et al., 1994, AJ, 108, 2233
- Whelan & Iben (1973) Whelan J., Iben I. J., 1973, ApJ, 186, 1007
- Yaron & Gal-Yam (2012) Yaron O., Gal-Yam A., 2012, PASP, 124, 668
- York et al. (2000) York D. G. et al., 2000, AJ, 120, 1579
| SN | zhelio | Stretch | MJD of maximum2 |
|---|---|---|---|
| PTF09a | 0.05550.0001 | 0.880.05 | 54902.61.0 |
| PTF09ac | 0.1610.001 | 0.970.11 | 54917.90.7 |
| PTF09dhx | 0.0870.001 | 1.700.06 | 55071.40.4 |
| PTF09djc | 0.03370.0003 | 0.820.02 | 55068.50.1 |
| PTF09dlc | 0.0680.001 | 1.050.02 | 55073.80.1 |
1Heliocentric redshift
2Modifed Julian date of maximum B-band light.
| SN | Phase | v | pEW | v | pEW | v | pEW | v | pEW | v | pEW |
|---|---|---|---|---|---|---|---|---|---|---|---|
| (d) | () | (Å) | () | (Å) | () | (Å) | () | (Å) | () | (Å) | |
| PTF09a | -4.61.0 | 932753 | 13.60.8 | 982951 | 10.80.4 | 1080039 | 75.01.0 | – | – | – | – |
| PTF09ac | 3.10.7 | – | – | – | – | 10264308 | 9.30.7 | – | – | – | – |
| PTF09dhx | -3.40.4 | 10826301 | 23.20.4 | 11209307 | 28.31.2 | 11351299 | 84.90.8 | 11112447 | 73.42.8 | 15624447 | 39.31.4 |
| PTF09djc | -0.50.1 | 11098302 | 32.71.5 | 11643298 | 37.60.3 | 13013298 | 160.70.5 | 11017391 | 168.945.3 | 15733391 | 123.444.1 |
| PTF09dlc | -10.80.1 | 12376318 | 3.80.5 | – | – | 16947300 | 96.91.0 | – | – | – |
1Heliocentric redshift
2Modifed Julian date of maximum B-band light.