Network structure of multivariate time series
Abstract
Our understanding of a variety of phenomena in physics, biology and economics crucially depends on the analysis of multivariate time series. While a wide range of tools and techniques for time series analysis already exist, the increasing availability of massive data structures calls for new approaches for multidimensional signal processing. We present here a non-parametric method to analyse multivariate time series, based on the mapping of a multidimensional time series into a multilayer network, which allows to extract information on a high dimensional dynamical system through the analysis of the structure of the associated multiplex network. The method is simple to implement, general, scalable, does not require ad hoc phase space partitioning, and is thus suitable for the analysis of large, heterogeneous and non-stationary time series. We show that simple structural descriptors of the associated multiplex networks allow to extract and quantify nontrivial properties of coupled chaotic maps, including the transition between different dynamical phases and the onset of various types of synchronization. As a concrete example we then study financial time series, showing that a multiplex network analysis can efficiently discriminate crises from periods of financial stability, where standard methods based on time-series symbolization often fail.
I Introduction
Time series analysis is a central topic in physics, as well as a powerful method to characterize data in biology, medicine and economics, and to understand their underlying dynamical origin. In the last decades, the topic has received input from different disciplines such as nonlinear dynamics, statistical physics, computer science or Bayesian statistics and, as a result, new approaches like nonlinear time series analysis nonlinear or data mining data have emerged. More recently, the science of complex networks barabasirev ; Boccaletti2006 ; Newman2010 has fostered the growth of a novel approach to time series analysis based on the transformation of a time series into a network according to some specified mapping algorithm, and on the subsequent extraction of information about the time series through the analysis of the derived network. Within this approach, a classical possibility is to interpret the interdependencies between time series (encapsulated for instance in cross-correlation matrices) as the weighted edges of a graph whose nodes label each time series, yielding so called functional networks, that have been used fruitfully and extensively in different fields such as neuroscience Bullmore2009 or finance financenet . A more recent perspective deals with mapping the particular structure of univariate time series into abstract graphs Small ; Thurner2007 ; Small2 ; donner2010 ; donner2011 ; pnas ; seminalPRE , with the aims of describing not the correlation between different series, but the overall structure of isolated time series, in purely graph-theoretical terms. Among these latter approaches, the so called visibility algorithms pnas ; seminalPRE have been shown to be simple, computationally efficient and analytically tractable methods analytic ; Gutin , able to extract nontrivial information about the original signal EPL , classify different dynamical origins Toral and provide a clean description of low dimensional dynamics chaos ; quasi ; intermitencia . As a consequence, this particular methodology has been used in different domains including earth and planetary sciences geo ; geo2 ; astro , finance finance or biomedical fields bio (see review for a review). Despite their success, the range of applicability of visibility methods has been so far limited to univariate time series, whereas the most challenging problems in several areas of nonlinear science concern systems governed by a large number of degrees of freedom, whose evolution is indeed described by multivariate time series.
In order to fill this gap, in this work we introduce a visibility approach to analyze multivariate time series based on the mapping of a multidimensional signal into an appropriately defined multi-layer network Bianconi2013 ; Nicosia2013 ; dedomenico ; kivela2014 ; Boccaletti2014 ; Battiston2014 , which we call multiplex visibility graph. Taking advantage of the recent development in the theory of multilayer networks dedomenico ; kivela2014 ; Boccaletti2014 ; Battiston2014 ; Bianconi2013 ; NicosiaNonLinear ; NicosiaCorrelations , new information can be extracted from the original multivariate time series, with the aims of describing signals in graph-theoretical terms or to construct novel feature vectors to feed automatic classifiers in a simple, accurate and computationally efficient way. We will show that, among other possibilities, a particular projection of this multilayer network produces a (single-layer) network similar in spirit to functional networks, while being more accurate than standard methodologies to construct these. We validate our method by investigating the rich high-dimensional dynamics displayed by canonical models of spatio-temporal chaos, and then apply our framework to describe and quantify periods of financial instability from a set of empirical multivariate financial time series.
II Results
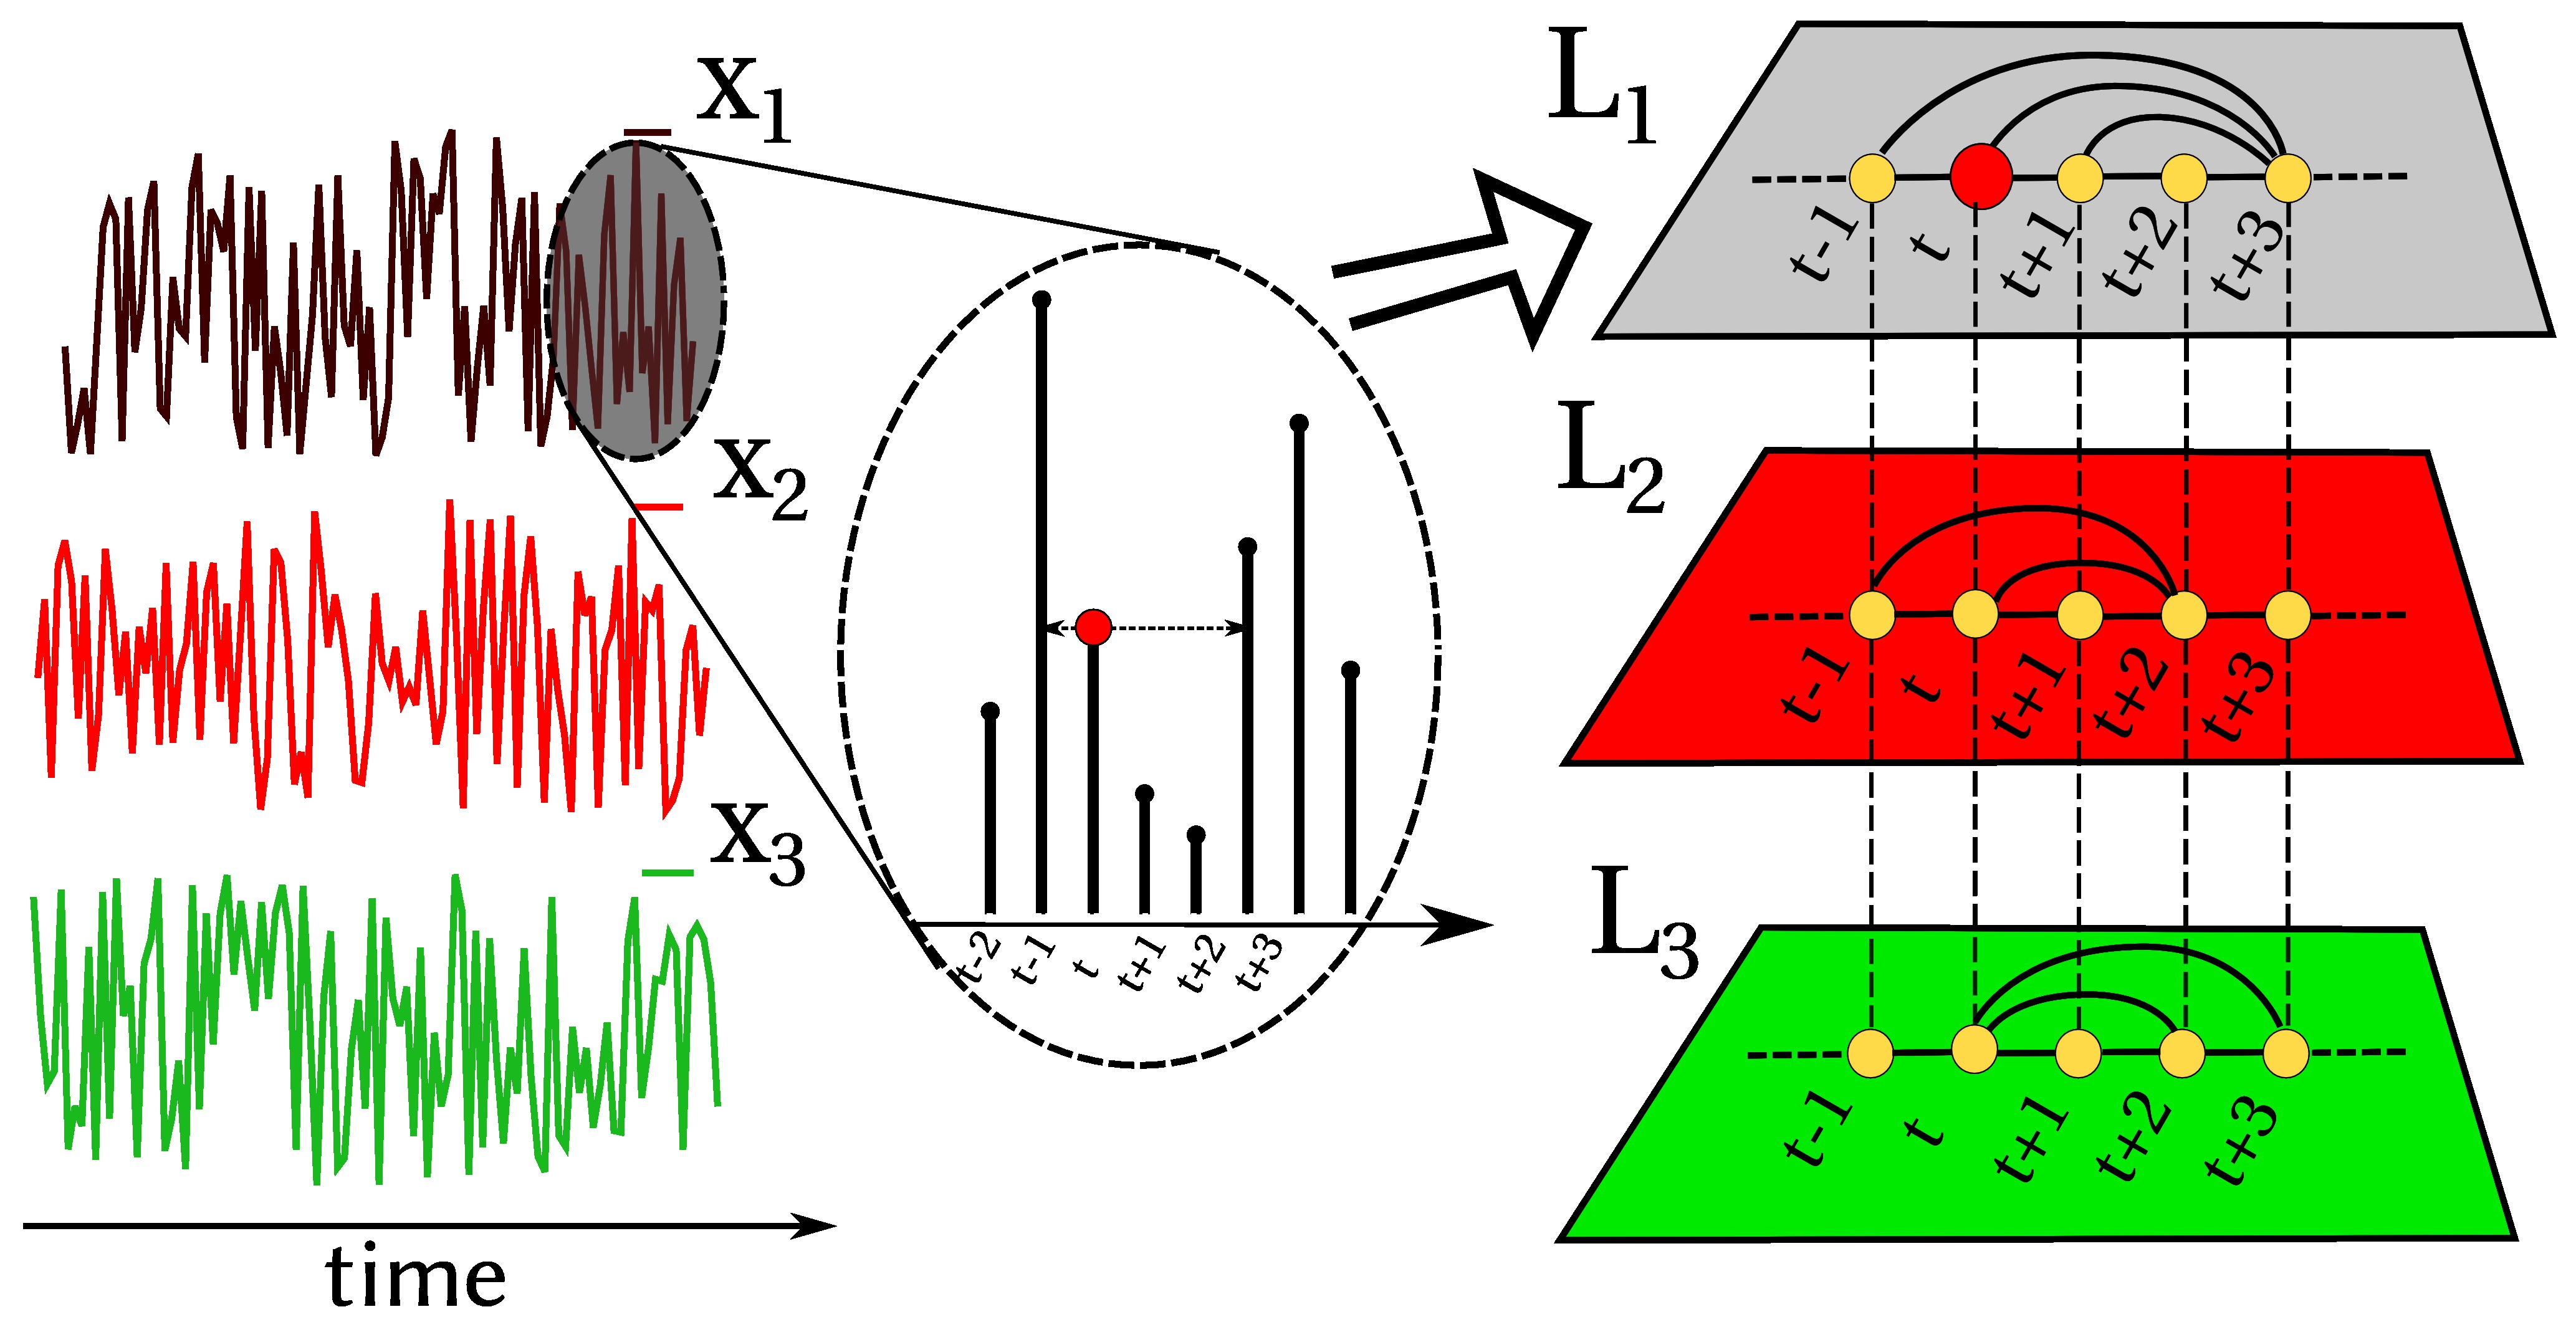
Let us start by recalling that visibility algorithms are a family of geometric criteria which define different ways of mapping an ordered series, for instance a temporal series of real-valued data , into a graph of nodes. The standard linking criteria are the natural visibility pnas (a convexity criterion) and the horizontal visibility seminalPRE (an ordering criterion). In the latter version, two nodes and are linked by an edge if the associated data and have horizontal visibility, i.e. if every intermediate datum satisfies the ordering relation The resulting Horizontal Visibility Graph (HVG) is an outerplanar graph (indeed a subgraph of the original visibility graph), whose topological properties have been shown to be analytically tractable for a large class of different dynamical processes seminalPRE ; analytic . Both the natural and horizontal graphs are undirected, however directed graphs can be easily constructed by by distinguishing ingoing from outgoing links with respect to the arrow of time, something which has proven useful to assess time asymmetries and to quantify time series irreversibility irrev ; irrev2 .
Consider a -dimensional real valued time series , with for any value of , measured empirically or extracted from a -dimensional, either deterministic or stochastic, dynamical system. An -layer multiplex network, that we call the multiplex visibility graph is then constructed, where layer corresponds to the HVG associated to the time series of state variable . We illustrate this procedure for in Fig. 1. Note that in this work we focus on the undirected, horizontal version, but other visibility linking criteria can be analogously used to define different multiplex versions. is represented by the vector of adjacency matrices of its layers , where and if and only if node and node are connected by a link at layer Battiston2014 ; Nicosia2013 . This builds a bridge between multivariate series analysis and the recent developments in the study of multilayer networks dedomenico ; kivela2014 ; Boccaletti2014 ; Battiston2014 ; Bianconi2013 ; NicosiaNonLinear ; NicosiaCorrelations . Among the different possible multiplex measures that with our mapping is now possible to exploit also in the context of multidimensional time series, we focus here on one which allows to detect and quantify inter-layer degree correlations NicosiaCorrelations . In such a way we can characterize information shared across variables (layers) of the underlying high dimensional system, this aspect being indeed of capital importance in fields such as neuroscience or economics and finance. Given a pair of layers and of , respectively characterized by the degree distributions and , we can define an interlayer mutual information as:
| (1) |
where is the joint probability to
find a node having degree at layer and degree
at layer . In general, the higher the more correlated the degree distributions of the two
layers and, therefore, the structure of the associated time
series. If we then average the quantity over every
possible pair of layers of , we obtain a scalar variable
which captures the typical
amount of information flow in the system.
Of course, the values can be considered as the
weights of the edges of a graph of layers ,
this being a projection of the original multiplex
visibility graph into a (single-layer) weighted graph of
nodes, where each node represents one layer. Edges in this
case denote mutual information, but our approach can be
easily generalized so that edges can
represent different types of interdependence, such as
correlation Bullmore2009 , causality grangernetwork ,
etc. Sporns2013 between layers. Hence for this particular
projection, one is actually analyzing the visibility analog of standard
functional networks. We shall indeed see that the multiplex
projection is genuinely different and often works better than other
ways to construct functional networks. This is mainly because the latters
often require, to
compute the weight of each edge, the symbolization of each time series, and
this pre-processing is usually afflicted by several limitations and
ambiguities nonlinear . As we show in the online Supplementary
Information (SI), the technique proposed here also appears to be free
from these well known ambiguities.
II.1 Information flow and phase diagram in Coupled Map Lattices.
As a case study we first consider diffusively coupled map lattices (CMLs), high-dimensional dynamical systems with discrete time and continuous state variables, widely used to model complex spatio-temporal dynamics kaneko in as disparate contexts as turbulence kanekobook , or vacuum fluctuations and dark energy beck . Namely we consider a ring of sites, and we assume that the dynamical evolution of the state of site is determined by:
| (2) |
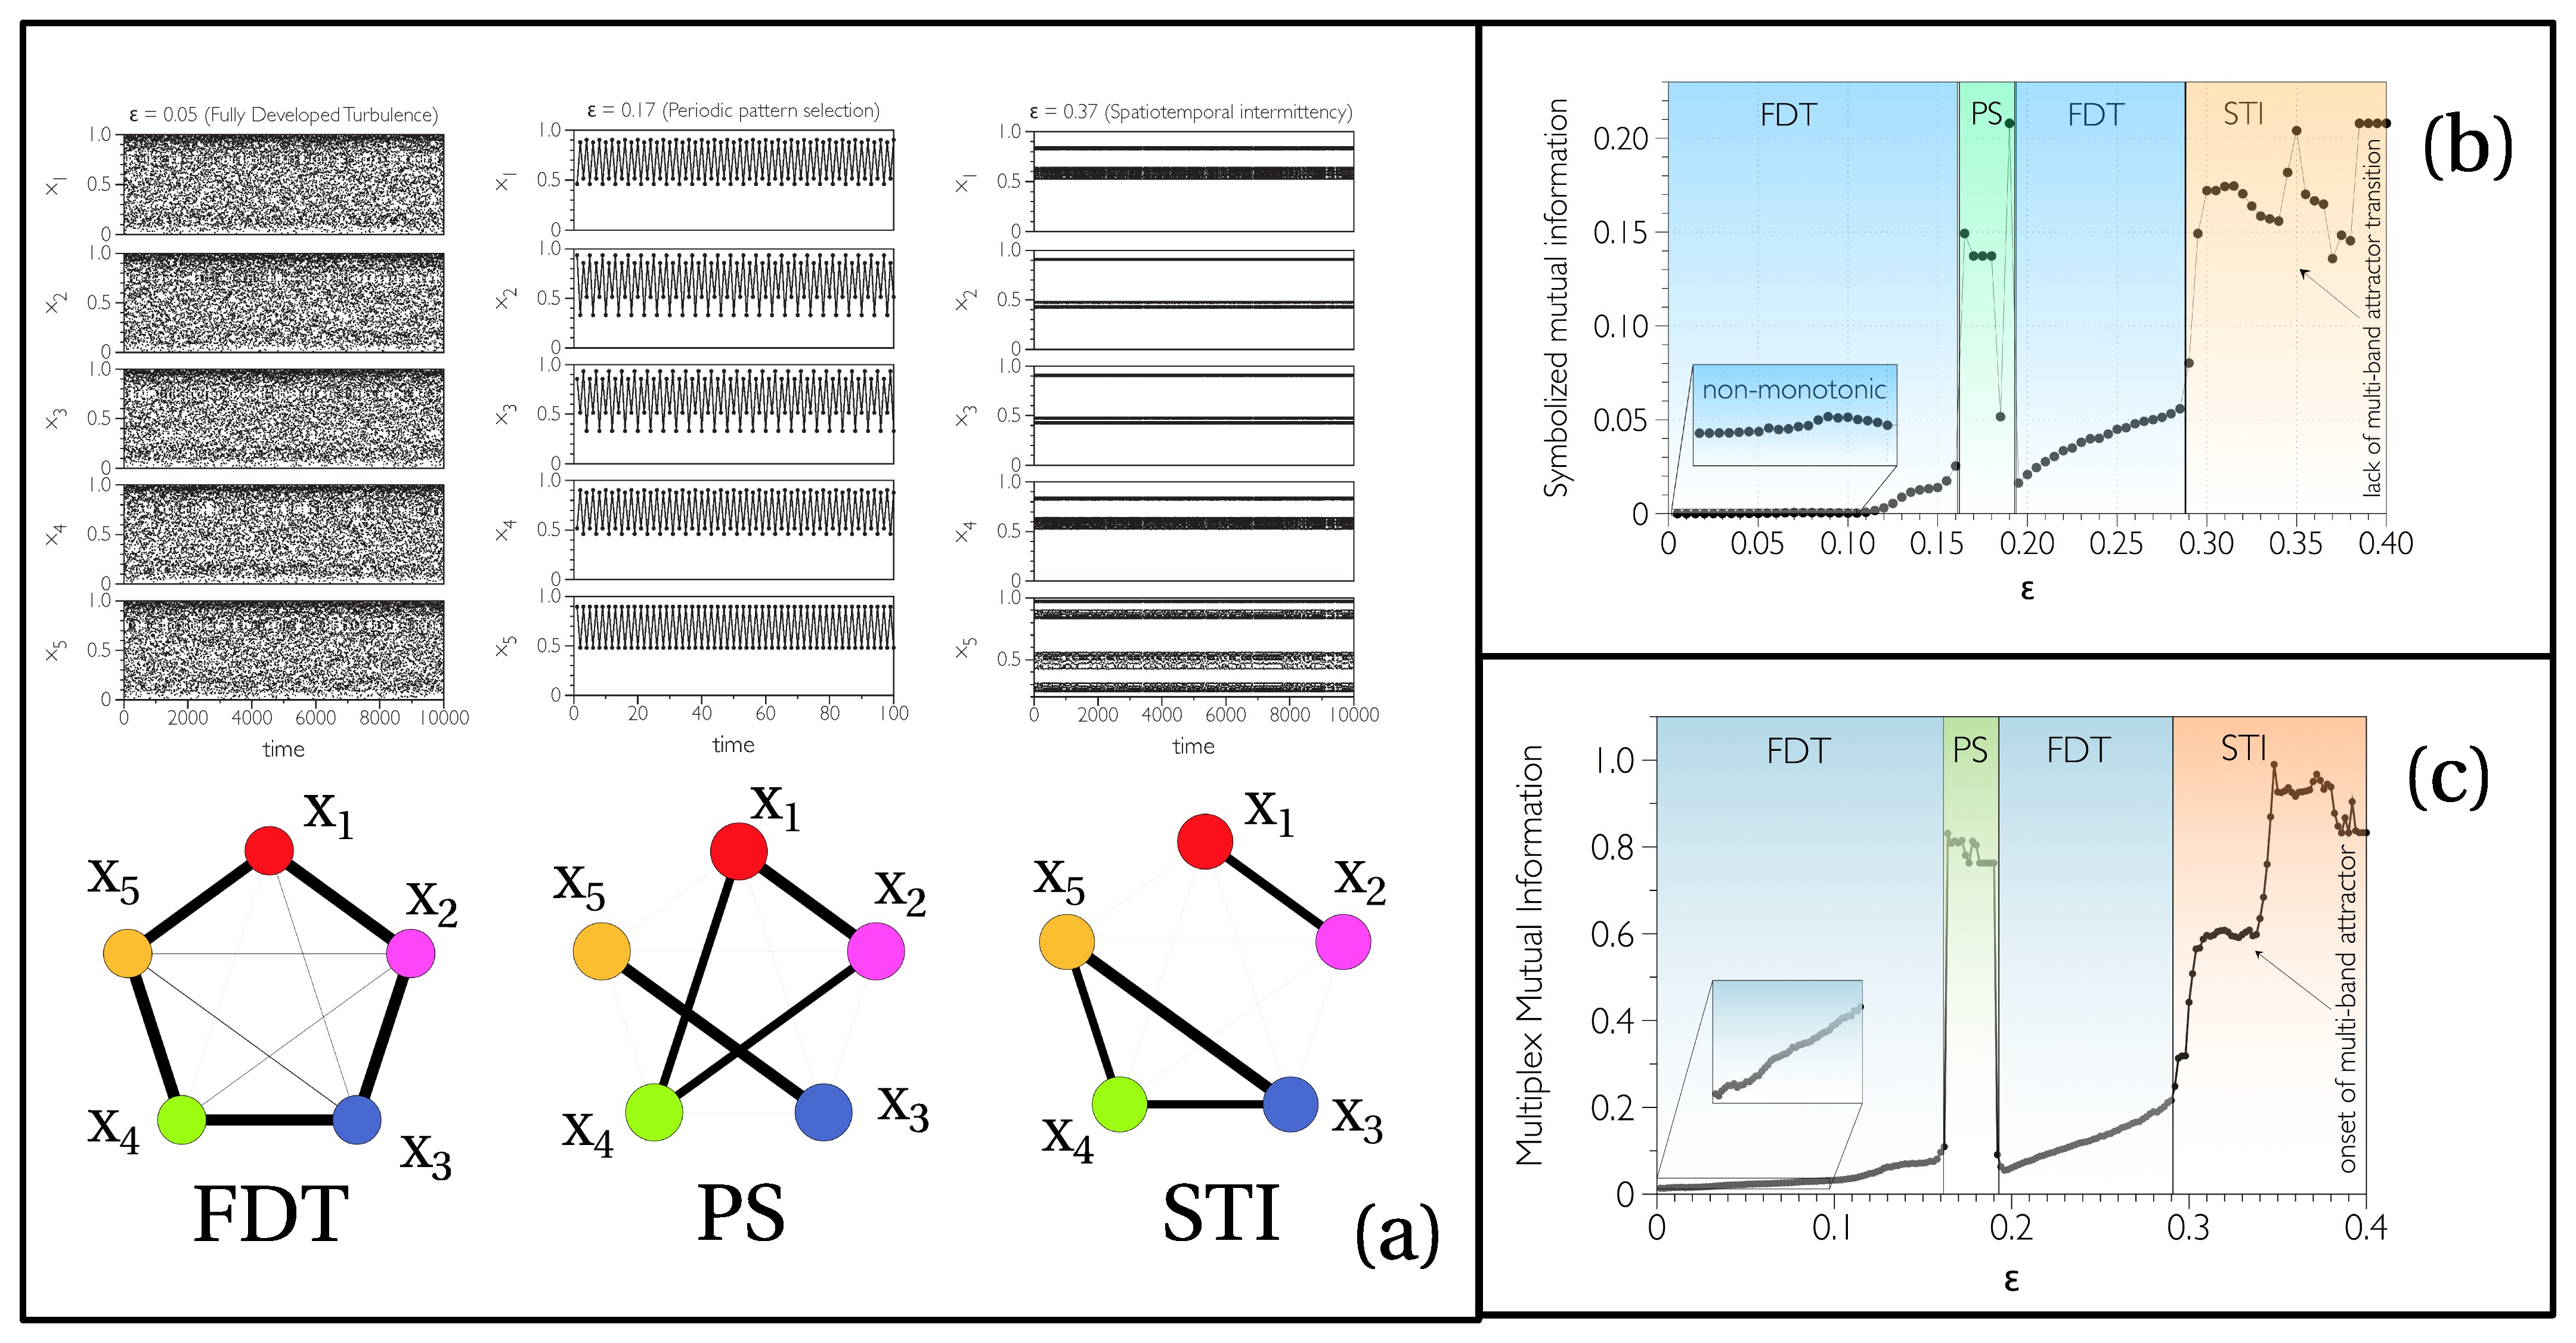
, where is the coupling strength, and is typically a chaotic map. For different values of and CMLs display a very rich phase diagram, which includes different degrees of synchronization and dynamical phases such as Fully Developed Turbulence (FDT, a phase with incoherent spatiotemporal chaos and high dimensional attractor), Pattern Selection (PS, a sharp suppression of chaos in favor of a randomly selected periodic attractor), or different forms of spatio-temporal intermittency (STI, a chaotic phase with low dimensional attractor). The origin of such a rich and intertwined structure comes from the interplay between the local tendency towards inhomogeneity, induced by the chaotic dynamics, and the global tendency towards homogeneity in space, induced by the diffusive coupling. Fig. 2 report the results obtained for a CML of diffusively coupled, fully chaotic logistic maps , which exhibits several transitions from high dimensional chaos, to pattern selection, to several forms of partially synchronized chaotic states when is increased. The plots of Fig. 2 are based on averages over 100 realisations of the CML dynamics. For each realisation, we constructed a multivariate time series of data points (discarding the transient) and we generated the corresponding multiplex visibility graph. In Fig. 2(b) we show how the average mutual information of the multiplex visibility graph associated to the system (see SI for other multiplex measures) is able to distinguish between the different phases. In particular, is a monotonically increasing function of in the FDT phases, and therefore quantifies the amount of information flow among units. Notably, it also detects qualitative changes in the underlying dynamics (such as the chaos suppression in favor of a randomly selected periodic pattern, or the onset of a multi-band chaotic attractor during intermittency) and therefore can be used as a scalar order parameter of the system. For comparison, in Fig.2(c) we also plot the corresponding quantity derived from a standard functional network analysis. Namely, is the average mutual information computed directly on the multivariate time series, after performing the necessary time series symbolization. Although there are qualitatively similarities, subtle aspects such as the monotonic increase of synchronization with in FDT, or the onset of multiband attractors in STI are not captured by (additional details comparing our method to standard functional network approaches can be found in the SI). In panel (a) of the same Figure we also report the projections of the three multiplex networks into the corresponding graphs of layers , whose edge widths are proportional to the values of mutual information between layers and . A simple visual inspection of such graphs reveals the different type of information flow among units, depending on the dynamical phases of the system. In particular, notice that the diffusive nature of the coupling emerges in the ring-like structure of graph corresponding to weakly interacting maps (FDT) (the analysis is extended in SI to globally coupled maps, these being a mean-field version of CML where complete synchronisation is possible, showing that our method correctly detects the onset of this new regime).
II.2 Scaling up the system.
The previous study suggests that
the quantities (see Fig. 2(a))
accurately capture relevant information of the underlying dynamics. To
further explore this aspect and to assess scalability, we considered a
chain of diffusively coupled logistic maps, each governed by
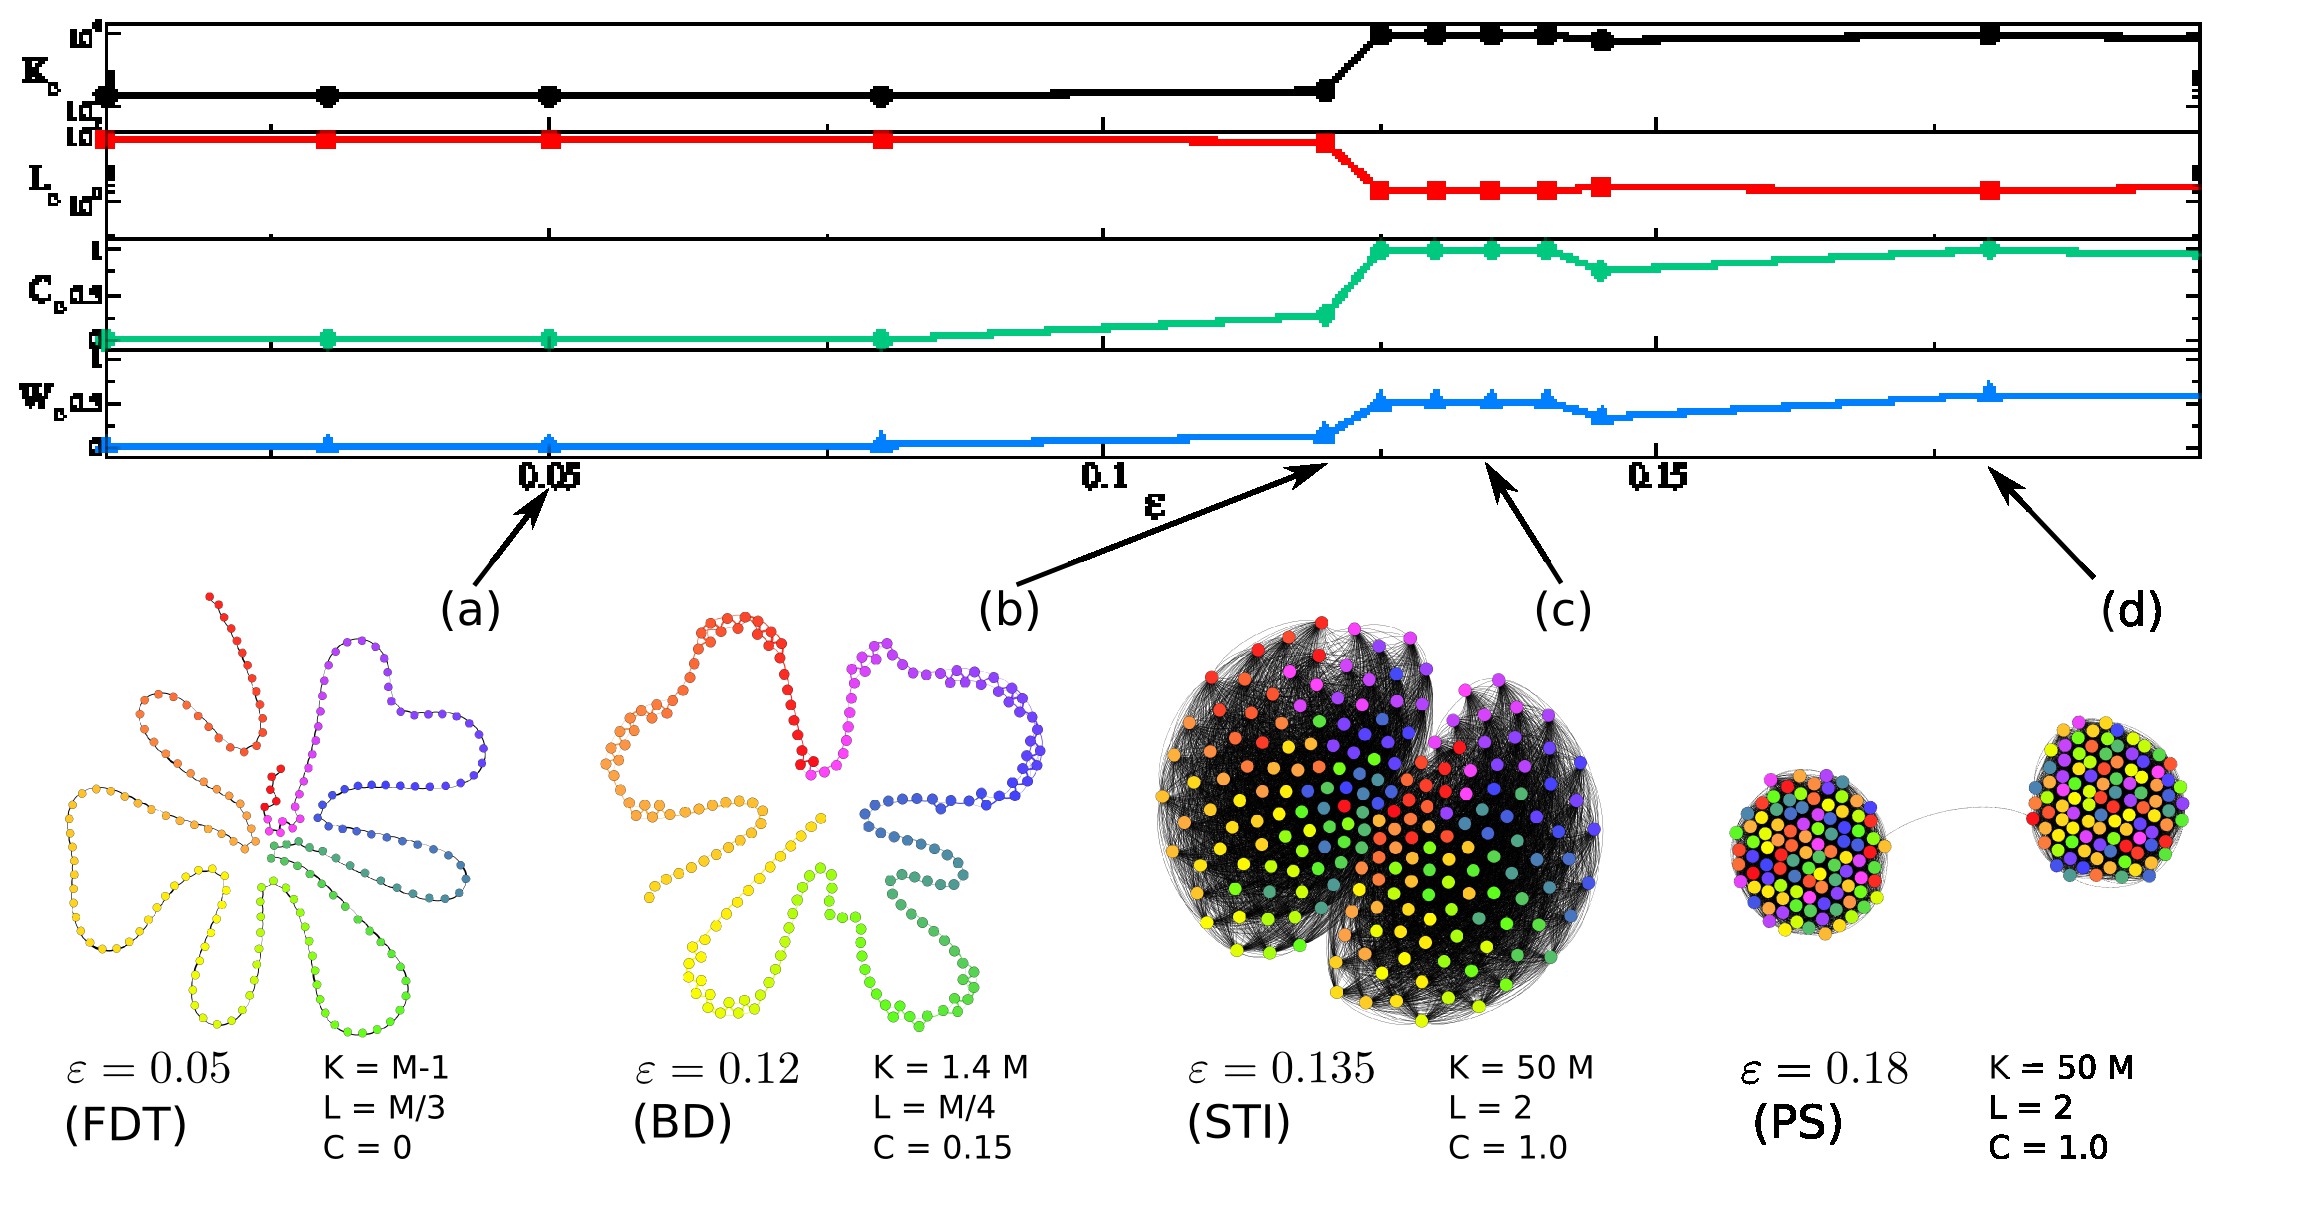
Eq. (2). New short dynamical phases, such as the so called
Brownian motion of Defects (BD) –a transient phase between FDT and
PS–, emerge when the dimension of the system is increased, and as the
description gets more cumbersome, projections and coarse-grained
variables are needed kaneko . Since the graph of layers
is by construction a complete graph (just as any
functional network), for visual reasons in Fig. 3 we
report the structural properties of , the backbone of
obtained starting from an empty graph of nodes and
adding edges sequentially in decreasing order of ,
until the resulting graph consists of a single connected
component. The structure of is unique for each phase
and qualitatively different across phases, thus providing a simple
qualitative way to portrait different dynamics in high-dimensional
systems.
II.3 Multiplex analysis of financial instabilities.
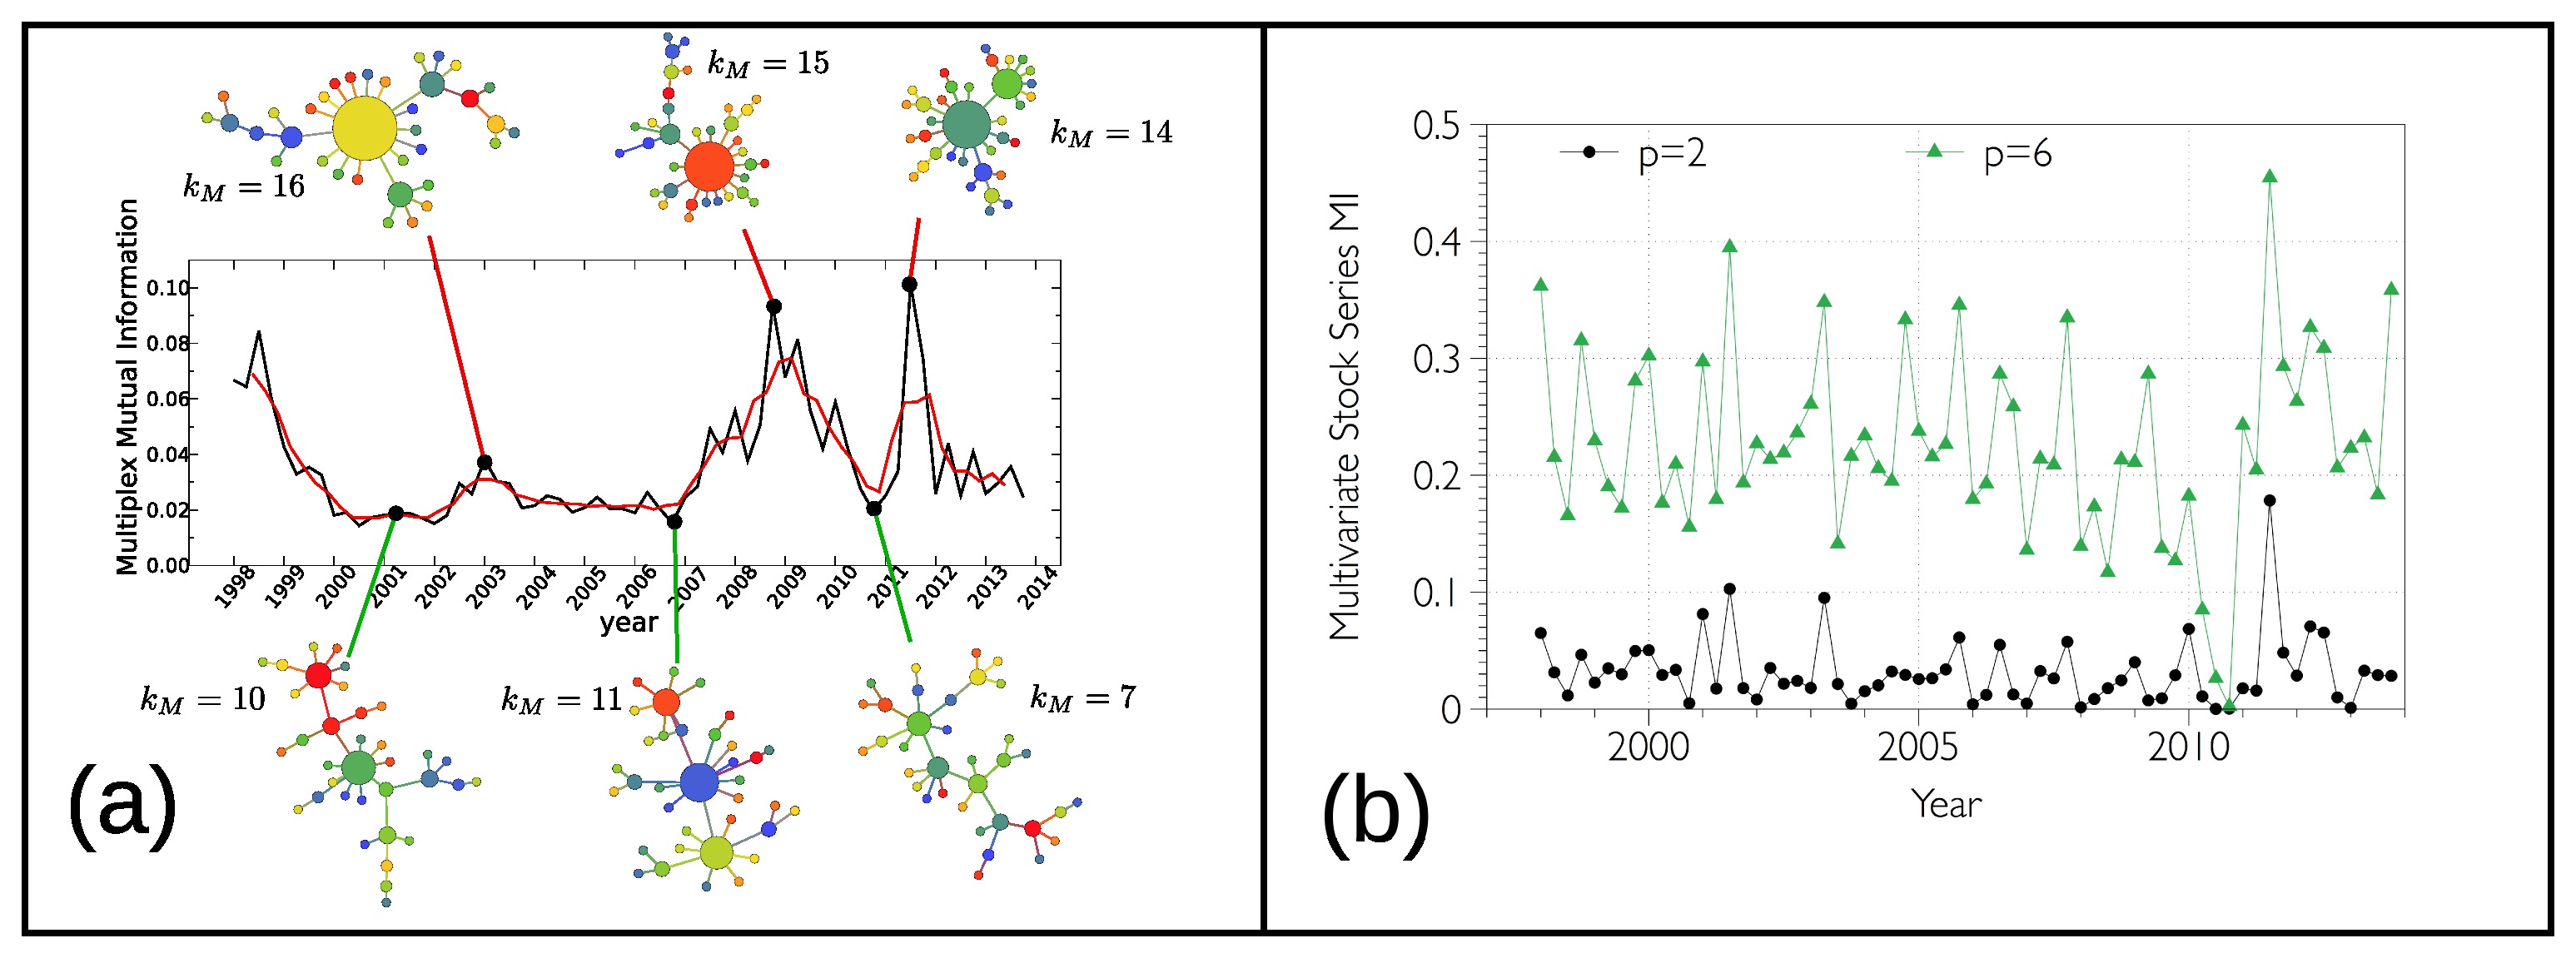
As an example of the possible applications of the multiplex visibility graph approach to the analysis of real-world multivariate time series, we report a study of the prices of financial assets. Namely, we considered the time evolution of stock prices of of the largest US companies by market capitalization from NYSE and NASDAQ (see SI for details) over the period 1998-2013. The time series have a very high resolution (one data per minute), yielding data per company. We divided each multivariate time series into non-overlapping periods of three months (quarters), and we constructed a temporal multiplex visibility graph consisting of 64 multilayer snapshots, each formed by the 35-layer multiplex visibility graph corresponding to one of the 3-months periods. We then investigated the time evolution of the multiplex mutual information among layers, and how this correlates to the presence of periods of financial instability.
In Fig. 4(a) we plot the value of the average multiplex mutual information as a function of time. For comparison we also report in Fig. 4(b) the analogous measure computed directly on the original series, after an appropriate symbolization (see SI for details). We find that the multiplex visibility graph approach captures the onset of the major periods of financial instability (1998-1999, corresponding to the .com bubble, and 2007-2012, corresponding to the great recession that took place as a consequence of the mortgage subprime crisis), which are characterised by a relatively increased synchronisation of stock prices, clearly distinguishing them from the seemingly unsynchronised interval 2001-2007, which in turn corresponds to a more stable period of the economy. In direct analogy with the language used for CMLs, we could say that in periods of financial stability, the system is close to equilibrium, degrees of freedom are evolving in a quasi-independent way, reaching a fully developed turbulent state of low mutual information (hence unpredictable and efficient from a financial viewpoint ). On the other hand, during periods of financial instability (bubbles and crisis) the system is externally perturbed, hence driven away from equilibrium, and the degrees of freedom share larger mutual information (the system is therefore less unpredictable and inefficient from a financial viewpoint). As shown in Figure 4(b), an analogous analysis based on the symbolization of the time series fails to capture all such details (see SI for additional analysis). Finally, as also seen in the case of the multiplex visibility graphs associated to CMLs, the differences in the values of average mutual information corresponding to different phases are indeed related to a different underlying structure of the network of layers. In Fig.4 we show the Maximal Spanning Trees (MST) of the networks of layers associated to six typical time windows Mantegna1999 ; financenet . The three networks at the bottom of the Figure represents periods of financial stability, while those at the top of the Figure correspond to the three local maxima of mutual information. Interestingly, the MSTs in periods of financial instability all have a massive hub which is directly linked to as much as of all the other nodes. Conversely, the degree is more evenly distributed in the MSTs associated to periods of economic stability.
III Discussion
The approach based on multiplex visibility graphs introduced in this
work provides an alternative and powerful
method to analyze multivariate time series. We have first validated
our method focusing on signals whose underlying dynamics
is well known and showing that measures describing the structure
of the corresponding multiplex networks (which are not
affected by the usual problems of standard symbolization
procedures) are able to capture and quantify the
onset of dynamical phases in high-dimensional coupled chaotic maps, as
well as the increase or decrease of mutual information among layers
(maps) within each phase. We then have studied an application to the
analysis of multivariate financial series, showing that
multiplex measures, differently from other standard methods,
can easily distinguish periods of financial stability
from crises, and can thus be used effectively as a support tool in
decision making.
The proposed method is extremely flexible and can be used in all
situations where the dynamics is poorly understood or unknown, with
potential applications ranging from fluid dynamics to neuroscience or
social sciences. In this article we have focused only on a particular
aspect, which is the characterization of the information flow among
the different variables of the system,
and we have consequently based our analysis on the
study of the resulting networks of layers. However, our approach is
quite general, and the mapping of multivariate time series into
multiplex visibility graphs paves the way to the study of the
relationship between specific structural descriptors recently
introduced in the context of multiplex networks and the properties of
real-world dynamical systems. We are confident that our method is
only the first step towards the construction of feature-based
automatic tools to classify dynamical systems of any kind.
References
- (1) Kantz, H., Schreiber, T. Nonlinear Time Series Analysis (Cambridge University Press, Cambridge, 2006).
- (2) Hastie, T., Tibshirani, R., Friedman, J. Elements of Statistical Learning (Springer-Verlag, 2009).
- (3) Albert, R., Barabasi, A.-L. Statistical mechanics of complex networks. Rev. Mod. Phys. 74, 47 (2002).
- (4) Boccaletti, S., Latora, V., Moreno, Y., Chavez, M., Hwang, D. U. Complex networks: structure and dynamics. Phys. Rep. 424, 175 (2006).
- (5) Newman, M. E. J. Networks: An Introduction. (Oxford University Press, Oxford, 2010).
- (6) Zhang, J., Small, M. Complex network from pseudoperiodic time series: topology versus dynamics. Phys. Rev. Lett. 96, 238701 (2006).
- (7) Kyriakopoulos, F., Thurner, S. Directed network representations of discrete dynamical maps, in Lecture Notes in Computer Science 4488, 625–632 (2007).
- (8) Xu, X., Zhang, J., Small, M. Superfamily phenomena and motifs of networks induced from time series. Proc. Natl. Acad. Sci. USA 105, 19601-19605 (2008).
- (9) Donner, R. V., Zou, Y., Donges, J. F., Marwan, N., Kurths, J. Recurrence networks: a novel paradigm for nonlinear time series analysis. New J. Phys. 12, 033025 (2010).
- (10) Donner, R. V., et al. The Geometry of Chaotic Dynamics - A Complex Network Perspective. Eur. Phys. J. B 84, 653-672 (2011).
- (11) Lacasa, L., Luque, B., Ballesteros, F., Luque, J., Nuno, J. C. From time series to complex networks: The visibility graph. Proc. Natl. Acad. Sci. USA 105, 13 (2008).
- (12) Luque, B., Lacasa, L., Luque, J., Ballesteros, F. J. Horizontal visibility graphs: Exact results for random time series. Phys. Rev. E 80, 046103 (2009).
- (13) Lacasa, L. On the degree distribution of horizontal visibility graphs associated to Markov processes and dynamical systems: diagrammatic and variational approaches. Nonlinearity 27, 2063-2093 (2014).
- (14) Gutin, G., Mansour, M., Severini, S. A characterization of horizontal visibility graphs and combinatorics on words. Physica A 390, 12 (2001).
- (15) Lacasa, L., Luque, B., Luque, J., Nuño, J. C. The Visibility Graph: a new method for estimating the Hurst exponent of fractional Brownian motion. Europhys. Lett. 86, 30001 (2009).
- (16) Lacasa, L., Toral, R. Description of stochastic and chaotic series using visibility graphs. Phys. Rev. E 82, 036120 (2010).
- (17) Luque, B., Lacasa, L., Ballesteros, F. J., Robledo, A. Analytical properties of horizontal visibility graphs in the Feigenbaum scenario. Chaos 22, 013109 (2012).
- (18) Luque, B., Ballesteros, F. J., Nunez, A. M., Robledo, A. Quasiperiodic graphs: structural design, scaling and entropic properties. J. Nonlin. Sci. 23 335-342 (2013).
- (19) Nunez, A., Luque, B., Lacasa, L., Gomez, J. P., Robledo, A. Horizontal Visibility graphs generated by type-I intermittency. Phys. Rev. E 87, 052801 (2013).
- (20) Aguilar-San Juan, B., Guzman-Vargas, L. Earthquake magnitude time series: scaling behavior of visibility networks. Eur. Phys. J. B. 86, 454 (2013).
- (21) Donner, R. V., Donges, J. F. Visibility graph analysis of geophysical time series: Potentials and possible pitfalls. Acta Geophysica 60, 589-623 (2012).
- (22) Zou, Y., Small, M., Liu, Z., Kurths, J. Complex network approach to characterize the statistical features of the sunspot series. New J. Phys. 16, 013051 (2014).
- (23) Qian, M. C., Jiang, Z. Q., Zhou, W. X. Universal and nonuniversal allometric scaling behaviors in the visibility graphs of world stock market indices. J. Phys. A 43 335002 (2010).
- (24) Ahmadlou, M., Ahmadi, K., Rezazade, M., Azad-Marzabadi, E. Global organization of functional brain connectivity in methamphetamine abusers. Clinical Neurophysiology 124, 6, 1122 (2013).
- (25) Nuñez, A., Lacasa, L., Luque, B. Visibility algorithms: a short review in Graph Theory (Intech) (2012).
- (26) Bianconi, G. Statistical mechanics of multiplex networks: Entropy and overlap. Phys. Rev. E. 87, 062806 (2013).
- (27) Nicosia, V., Bianconi, G., Latora, V., Barthelemy, M. Growing multiplex networks. Phys. Rev. Lett. 111, 058701 (2013).
- (28) De Domenico, M., et al. Mathematical formulation of multilayer networks. Phys. Rev. X 3, 041022 (2013).
- (29) Kivelä, M., et al. Multilayer networks J. Complex Networks, 2 (3), 203-271 (2014).
- (30) Boccaletti, S., et al. The structure and dynamics of multilayer networks. Phys. Rep. 544(1), 1-122 (2014).
- (31) Battiston, F., Nicosia, V., Latora, V. Structural measures for multiplex networks. Phys. Rev. E 89, 032804 (2014).
- (32) Lacasa, L., Nuñez, A., Roldan, E., Parrondo, J. M. R., Luque, B. Time series irreversibility: a visibility graph approach. Eur. Phys. J. B 85, 217 (2012).
- (33) Donges, J. F., Donner, R. V., Kurths, J. Testing time series irreversibility using complex network methods. Europhys. Lett. 102, 10004 (2013).
- (34) Nicosia, V., Bianconi, G., Latora, V., Barthelemy, M. Non-linear growth and condensation in multiplex networks. Phys. Rev. E 90, 042807 (2014).
- (35) Nicosia, V., Latora, V. Measuring and modelling correlations in multiplex networks. arxiv:1403.1546 (2014).
- (36) Kaneko, K. Pattern dynamics in spatiotemporal chaos: Pattern selection, diffusion of defect and pattern competition intermettency. Physica D 34, 1-41 (1989).
- (37) Kaneko, K. Theory and applications of coupled map lattices (Vol. 12). John Wiley Son Ltd. (1993).
- (38) Beck, C. Chaotic scalar fields as models for dark energy. Phys. Rev. D 69(12), 123515 (2004).
- (39) Bullmore, E., Sporns, O. Complex brain networks: graph theoretical analysis of structural and functional systems. Nat. Rev. Neurosci 10(3), 186–198 (2009).
- (40) Tumminello, M., Lillo, F., Mantegna, R. N. Correlation, hierarchies, and networks in financial markets. Journal of Economic Behavior Organization, 75(1), 40-58 (2010).
- (41) Granger, C. W. J. Investigating causal relations by econometric models and cross-spectral methods. Econometrica 37(3), 424–438 (1969).
- (42) Sporns, O. Structure and function of complex brain networks. Dialogues Clin. Neurosci. 15(3), 247–262 (2013).
- (43) Kaneko, K. Clustering, coding, switching, hierarchical ordering, and control in a network of chaotic elements. Physica D 41, 137-172 (1990).
- (44) Mantegna, R. Hierarchical structure in financial markets. Europhys J B, 11, 193–197 (1999).
Acknowledgments
V.N. and V.L. acknowledge support from the Project LASAGNE, Contract No.318132 (STREP), funded by the European Commission. V.L. acknowledges support from the EPSRC project GALE, EP/K020633/1.
Author contributions statement
All the authors conceived the study, performed the experiments, analysed the results and wrote the paper. All the authors approved the final version of the manuscript.