Supercontinuum optimization for dual-soliton based light sources using genetic algorithms in a Grid platform
F. R. Arteaga-Sierra,1,2,∗ C. Milián,2,3,6 I. Torres-Gómez,1
M. Torres-Cisneros,4 G. Moltó,3 and A. Ferrando2,5
1Centro de Investigaciones en Óptica, A.C., León Gto. 37150, México
2Universidad Politécnica de Valencia, Grupo de Modelización Multidisciplinar Intertech, 46022, Valencia, Spain
3 Instituto de Instrumentación para Imagen Molecular (I3M). Centro mixto CSIC-Universitat Politècnica de València-CIEMAT, camino de Vera s/n, 46022 Valencia, España
4NanoBioPhotonics Group, DICIS, Universidad de Guanajuato, Mexico
5 Departament d’Òptica, Universitat de València, Burjassot (València). 46100, Spain
6Current address: Centre de Physique Théorique, École Polytechnique, CNRS, F-91128 Palaiseau, France
*arteaga@cio.mx
6carles.milian@cpht.polytechnique.fr
Abstract
We present a numerical strategy to design fiber based dual pulse light sources exhibiting two predefined spectral peaks in the anomalous group velocity dispersion regime. The frequency conversion is based on the soliton fission and soliton self-frequency shift occurring during supercontinuum generation. The optimization process is carried out by a genetic algorithm that provides the optimum input pulse parameters: wavelength, temporal width and peak power. This algorithm is implemented in a Grid platform in order to take advantage of distributed computing. These results are useful for optical coherence tomography applications where bell-shaped pulses located in the second near-infrared window are needed.
OCIS codes: (190.4370) Nonlinear optics; (060.5530) Pulse propagation and temporal solitons; (230.6080) Sources; (110.2945) Illumination design; (170.4500) Optical coherence tomography.
References and links
- [1] J. P. Gordon, “Theory of the soliton self-frequency shift,” Opt. Lett. 11, 662–664 (1986).
- [2] F. M. Mitschke and L. F. Mollenauer, “Discovery of the soliton self-frequency shift,” Opt. Lett. 11, 659–661 (1986).
- [3] J. M. Dudley, G. Genty and S. Coen, “Supercontinuum generation in photonic cristal fibers,” Rev. Mod. Phys. 78, 135–1184 (2006).
- [4] D. V. Skryabin and A. V. Gorbach, “Colloquium: looking at a soliton through the prism of optical supercontinuum,” Rev. Mod. Phys. 82, 1287–1299 (2010).
- [5] A. V. Gorbach and D. V. Skryabin, “Light trapping in gravity-like potentials and expansion of supercontinuum spectra in photonic-crystal fibres,” Nat. Photon. 1, 1749-4885 (2007).
- [6] A. Hause, T. X. Tran, F. Biancalana, A. Podlipensky, P. St.J. Russell and F. Mitschke, “Understanding Raman-shifting multipeak states in photonic crystal fibers: two convergent approaches,” Opt. Lett. 35, 2167–2169 (2010).
- [7] A. Hause and F. Mitschke, “Soliton trains in motion,” Phys. Rev. A 82, 043838 (2010).
- [8] T. X. Tran, A. Podlipensky, P. St. J. Russell and F. Biancalana, “Theory of Raman multipeak states in solid-core photonic crystal fibers,” J. Opt. Soc. Am. B 27, 1785–1791 (2010).
- [9] Andrey V. Gorbach and Dmitry V. Skryabin, “Soliton self-frequency shift, non-solitonic radiation and self-induced transparency in air-core fibers,” Opt. Express 16, 4858–4865 (2008).
- [10] C. Milián, D. V. Skryabin and A. Ferrando, “Continuum generation by dark solitons,” Opt. Lett. 34, 2096–2098 (2009).
- [11] C. Milián, A. Ferrando, and D. V. Skryabin, “Polychromatic Cherenkov radiation and supercontinuum in tapered optical fibers,” J. Opt. Soc. Am. B 29, 589-593 (2012).
- [12] F. R. Arteaga-Sierra, C. Milián, I. Torres-Gómez, M. Torres-Cisneros, A. Ferrando, and A. Dávila, “Multi-peak-spectra generation with Cherenkov radiation in a non-uniform single mode fiber,” Opt. Express 22, 2451-2458 (2014).
- [13] S. A. Dekker, A. C. Judge, R. Pant, I. Gris-Sánchez, J. C. Knight, C. M. De Sterke and B. J. Eggleton, “Highly-efficient, octave spanning soliton self-frequency shift using a specialized photonic crystal fiber with low OH loss,” Opt. Express 18, 17766–17773 (2011).
- [14] J. Rothhardt, A. M. Heidt, S. Hädrich, S. Demmler, J. Limpert and A. Tünnermann, “High stability soliton frequency-shifting mechanisms for laser synchronization applications,” J. Opt. Soc. Am. B 29, 1257–1262 (2012).
- [15] A. M. Al-kadry and M. Rochette, “Mid-infrared sources based on the soliton self-frequency shift,” J. Opt. Soc. Am. B 29, 1347–1355 (2012).
- [16] A. C. Judge, O. Bang, B. J. Eggleton, B. T. Kuhlmey, E. C. Mägi, R. Pant and C. Martijn de Sterke, “Optimization of the soliton self-frequency shift in a tapered photonic crystal fiber,” J. Opt. Soc. Am. B 26, 2064–2071 (2009).
- [17] S. Pricking and H. Giessen, “Tailoring the soliton and supercontinuum dynamics by engineering the profile of tapered fibers,” Opt. Express 18, 20151–20163 (2010).
- [18] R. Pant, A. C. Judge, E. C. Magi, B. T. Kuhlmey, M. De Sterke and B. J. Eggleton, “Characterization and optimization of photonic crystal fibers for enhanced soliton self-frequency shift,” J. Opt. Soc. Am. B 27, 1894–1901 (2010).
- [19] G. Moltó, M. Arevalillo-Herráez, C. Milián, M. Zacarés, V. Hernández, and A. Ferrando, “Optimization of supercontinuum spectrum using genetic algorithms on service-oriented grids,” in Proceedings of the 3rd Iberian Grid Infrastructure Conference (IberGrid), pp. 137–147 (2009).
- [20] A. Ferrando, C. Milián, N. González, G. Moltó, P. Loza, M. Arevalillo-Herráez, M. Zacarés, I. Torres-Gómez and V. Hernández, “Designing supercontinuum spectra using Grid technology,” Proc. SPIE 7839, 78390W (2010).
- [21] N. Akhmediev and M. Karlsson, “Cherenkov radiation emitted by solitons in optical fibers,” Phys. Rev. A 51, 2602–2607 (1995).
- [22] J. Wang, Y. J. Geng, B. Guo, T. Klima, B. N. Lal, J. T Willerson and W. Casscells, “Near-infrared spectroscopic characterization of human advanced atherosclerotic plaques,” J. Am. Coll. Cardiol. 39, 1305-1313 (2002).
- [23] Y. M. Wang, J. S. Nelson, Z. P. Chen, B. J. Reiser, R. S Chuck and R. S. Windeler,“Optimal wavelength for ultrahigh-resolution optical coherence tomography,” Opt. Express 11, 1411-1417 (2003).
- [24] G, Humbert, W. J. Wadsworth, S. G. Leon-Saval, J. C. Knight, T. A. Birks, P. St. J. Russell, M. J. Lederer, D. Kopf K. Wiesauer, E. I. Breuer and D. Stifter, “Supercontinuum generation system for optical coherence tomography based on tapered photonic crystal fibre,” Opt. Express 14, 1596-1603 (2006).
- [25] Y. Wang, Y. Zhao, J. S. Nelson, Z. Chen, R. S. Windeler, “Ultrahigh-resolution optical coherence tomography by broadband continuum generation from a photonic crystal fiber,” Opt. Lett. 28, 182–184 (2003).
- [26] F. Spoeler, S. Kray, P. Grychtol, B. Hermes, J. Bornemann, M. Foerst and H. Kurz, “Simultaneous dual-band ultra-high resolution optical coherence tomography,” Opt. Express 15, 10832-10841 (2007).
- [27] A.M. Smith, M.C. Mancini, and S. Nie, “Bioimaging: Second window for in vivo imaging,” Nat. Nanotechnol. 4, 710-711 (2009).
- [28] J.M. Huntley, T. Widjanarko, and P.D. Ruiz, “Hyperspectral interferometry for single-shot absolute measurement of two-dimensional optical path distributions,” Meas. Sci. Technol. 21, 075304 (2010).
- [29] Q. Cao, N.G. Zhegalova, S.T. Wang, W.J. Akers, and M.Y. Berezin, “Multispectral imaging in the extended near-infrared window based on endogenous chromophores,” J. Biomed. Opt. 18, 101318–101318 (2013).
- [30] Y. Kodama and A. Hasegawa, “Nonlinear Pulse Propagation in a Monomode Dielectric Guide,” IEEE J. Quantum Elect. 23, 510-524 (1987).
- [31] R. Driben, B. A. Malomed, A. V. Yulin and D. V. Skryabin, “Newton’s cradles in optics: From -soliton fission to soliton chains,” Phys. Rev. A 87, 063808 (2013).
- [32] S. N. Sivanandam and S. N. Deepa, Introduction to Genetic Algorithms (Springer, 2010).
- [33] F. I. Feldchtein, G. V. Gelikonov, V. M. Gelikonov, R. R. Iksanov, R. V. Kuranov, A. M. Sergeev, N. D. Gladkova, M. N. Ourutina, J. A.Warren, and D. H. Reitze, “In vivo OCT imaging of hard and soft tissue of the oral cavity,” Opt. Express 3, 239?250 (1998).
- [34] V. M. Gelikonov, G. V. Gelikonov, and F. I. Feldchtein, “Two-wavelength optical coherence tomography,” Radiophys. Quantum Electron. 47, 848?859 (2004).
- [35] J.G. Fujimoto, C. Pitris, S. A. Boppart and M.E, Brezinski, “Optical coherence tomography: An emerging technology for biomedical imaging and optical biopsy,” Neoplasia 2, 9-25 (2000).
- [36] J. G. Fujimoto, “Optical coherence tomography for ultrahigh resolution in vivo imaging,” Nat. Biotechnol. 21, 1361–1367 (2003).
- [37] E. Kerrinckx, L. Bigot, M. Douay and Y. Quiquempois, “Photonic crystal fiber design by means of a genetic algorithm,” Opt. Express, 12, pp. 1990–1995 (2004).
- [38] W. Q. Zhang, J. E. Sharping, R. T. White, T. M. Monro and S. Afshar V., “Design and optimization of fiber optical parametric oscillators for femtosecond pulse generation,” Opt. Express 18, 17294–17305 (2010).
- [39] W. Q. Zhang, S. Afshar V. and T. M. Monro, “A genetic algorithm based approach to fiber design for high coherence and large bandwidth supercontinuum generation,” Opt. Express 17, 19311–19327 (2009).
- [40] R. R. Musin and A. M. Zheltikov, “Designing dispersion-compensating photonic-crystal fibers using a genetic algorithm,” Opt. Commun. 281, 567–572 (2008).
- [41] Y. Guo-Bing, L. Shu-Guang, L. Shuo and W. Xiao-Yan, “ The Optimization of Dispersion Properties of Photonic Crystal Fibers Using a Real-Coded Genetic Algorithm,” Chinese Phys. Lett. 28, 064215 (2011).
- [42] G. P. Agrawal, Nonlinear Fiber Optics, 4th ed. (Academic Press. 2007).
- [43] S. Afshar V. and T. M. Monro, “A full vectorial model for pulse propagation in emerging waveguides with subwavelength structures part I: Kerr nonlinearity,” Opt. Express 17, 2298–2318 (2009).
- [44] R. H. Stolen, J. P. Gordon, W. J. Tomlinson and H. A. Haus, “Raman response function of silica-core fibers,” J. Opt. Soc. Am. B 6, 1159–1166 (1989).
- [45] R. B. Agrawal and K. Deb, Simulated Binary Crossover for Continuous Search Space (Technical report, 1994).
- [46] K. Deb, Multi-Objective Optimization using Evolutionary Algorithms (Wiley & Sons, 2001).
- [47] A.N. Bashkatov1, E.A. Genina, V.I. Kochubey, and V.V. Tuchin, “Optical properties of human skin, subcutaneous and mucous tissues in the wavelength range from 400 to 2000 nm,” J. Phys. D: Appl. Phys. 38, 2543–2555 (2005).
- [48] R. Tripathi, N. Nassif, J. S. Nelson, B. H. Park and J. F. de Boer, “Spectral shaping for non-Gaussian source spectra in optical coherence tomography,” Opt. Lett. 27, 406–408 (2002).
- [49] J. A. Izatt and M. A. Choma, Optical Coherence Tomography Technology and Applications (Springer, 2008).
1 Introduction
The Soliton self-frequency shift (SSFS) [1, 2] plays a central role in many effects taking place during supercontinuum (SC) generation in optical fibers (see Refs. [3, 4] for a review on the topic). To mention only a few examples, light trapping [5], multi-peak soliton states [6, 7, 8], emission of Airy waves [9], intense dark-soliton SC [10] or broad and intense blue shifted polychromatic dispersive waves [11, 12], would not be possible (or strong enough) without the SSFS. One of the most notorious feature of the Raman effect in SC generation with femtosecond pulses corresponds to the Raman soliton carrying the lowest frequency. Its large frequency shift from the laser pulse has motivated infra-red (IR) Raman soliton sources [13, 14, 15] and their optimization [16, 17, 18, 19, 20].
In the previous work of Ref. [12], we have shown that fs-pulses traveling in a dispersion engineered single mode fiber (SMF) can generate several pre-defined spectral peaks in the normal group velocity dispersion (GVD) region. These peaks correspond to the narrow band Cherenkov radiation emitted by the bright solitons [21] undergoing Raman red-shift and recoil. Such spectra were important for applications in optical coherence tomography (OCT) with wavelengths in the near infra-red (NIR) window [22, 23, 24]: m.
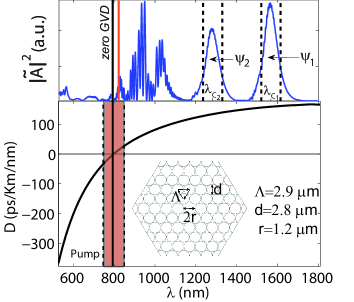
In the present work, we are interested in OCT applications enabled by fiber based illumination [25, 26] in the second near IR window (NIR II) [27, 28, 29] where m, typically in the anomalous GVD regime of highly nonlinear photonic crystal fibers (PCFs). Because of the typical dispersion landscape, sources in the NIR II window may be based on the bright optical solitons arising during SC generation through the intricate soliton fission effect [30, 31]. With this picture in mind, we used an efficient and general computational optimization method based on genetic algorithms (GA) [32] that is capable of finding output spectra [see Fig. 1] exhibiting two peaks centered at pre-defined wavelengths. This type of multi-peak spectral illumination is very often required for OCT applications in the NIR II [29] and the simultaneous presence of the two operating spectral components is a prerequisite for real time imaging [33, 34]. The two peaks we obtain are the first and second Raman solitons presenting a clean bell-shaped spectral profile, essential for OCT [35], with widths providing a decent longitudinal resolution m [36]. To demonstrate the usefulness of this method, we consider in this work the two spectral channels separated by nm (see, e.g., Ref. [29]). The optimization method finds the optimal input pulse parameters, namely central wavelength, , temporal width, , and peak power, , yielding the desired spectra. The obtained peak powers are of up to mW for each spectral band, satisfying the needs for OCT imaging applications [35]. We find by this method the possibility to tune the wavelength of the target spectral channels, what represents an important feature of this strategy since the greatest potential of the given PCF is exploited, specially in situations where limited choice of PCF designs is available.
It is worth mentioning that the use of GAs in optics has indeed proofed useful previously in solving satisfactorily the inverse optimization problem of the one we present here, i.e., the design of PCFs to control SC dynamics, in a wide range of situations [37, 38, 39, 40, 41]. The use of GAs generally requires a large amount of simulations. For this reason we used a distributed computing (Grid) platform to reduce the time required to find the optimal solutions. The advantage of this infrastructure is that it enables the use of the same code in a platform of scalable resources which are adapted according to the needs of the particular problem.
2 Supercontinuum modeling and the Genetic Algorythm
We simulate the nonlinear propagation of the complex electric field envelope, , along the fiber axis, , by integrating numerically (with split-step fourier method) the generalized nonlinear Schrödinger equation (GNLSE) [42],
| (1) |
where the ’s account for the linear fiber dispersion and
| (2) |
is the nonlinearity parameter [43] which has been computed with a FEM solver (comsol) by integrating the electromagnetic components of the modal field at nm along the transverse fiber cross section. and m2/W are the relative permitivitty and nonlinear index of silica glass, respectively. The nonlinear response of the glass is [44], where is the Dirac delta function and the Raman (delayed) contribution is weighted with and described by the damped oscillator
| (3) |
where fs, fs, and is the Heaviside step function. The input pulses used in our simulations are of the form , where (for a fixed ) the input peak power controls the soliton order .
We consider a length cm of the NL-2.4-800 PCF, exhibiting the lowest zero GVD at nm [see details in Fig. 1], convenient for broad band SC generation with Ti:Sapphire lasers. The frequency conversion performance is investigated within the attainable ranges of input pulse parameters: nm, kW, and fs.
For each simulation along the PCF, the GA generates an individual with the genome and evaluates how suitable that individual is from the simulation output through the fitness function (to be minimized) defined as
| (4) |
where is the chosen spectral channel widths and the central frequency. Note that the definition of as a product tends to favor output spectra in the form amongst all solutions with [see Fig. (3) for optimum results]. The optimization process is depicted in Fig. 2(a).
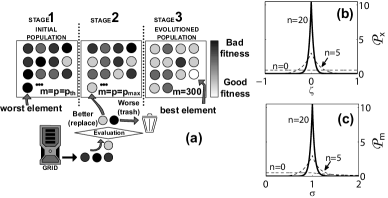
After an initial set of randomly (uniformly distributed) generated individuals (stage ), the genetic operators (GOs) crossover, , and mutation, , are responsible for generating the new offsprings, which are added to the population until the maximum size is reached (stage 2). During stage 3 the population size is kept constant, , and a replace the worst strategy is used, i.e., the offspring is added to the population if or disregarded otherwise. This steady state GA keeps the Grid constantly computing new individuals in parallel and fully exploits the processing power of the Grid. We briefly describe the GOs below.
Cross-over, , is the first GO applied to the current population and generates two childs by combining two randomly chosen parents, , i.e., (being the empty set). We have used simulated binary crossover (SBX) [45] and the operator
| (5) |
where (being the identity matrix). The crossover activators, , set a probability for cross over of per gene. The stochastic variables in this case, [see Fig. 2(b)], are chosen from a uniform random number according to,
| (6) |
The polynomial mutation, , [46] suitable for real coded problems (continuous valued variables), is applied after and generates new genes as ,
| (7) |
where is the interval size of each variable ( fs, nm, kW). Hence, in average only one gene is mutated per individual when mutation is applied: . satisfies the normalized probability distribution [see Fig. 2(c)]
| (8) |
with , peaked around and clearly different from the random generation. For each gene the stochastic variable is chosen from a random :
| (9) |
Statistically, provides diversity to the population and explores the parameter space in the vicinity of the parents. In this particular optimization problem, each individual evaluation typically required s what amounted for about h of CPU time to perform a single run of the GA with individuals [see Fig. 4]. We used a cluster of cores within a Grid infrastructure, which reduced the computation time to minutes. The Grid protocols supporting the GA execution make infrastructure resizable according to the needs of the problem: number of executions, dimensionality of the search space, etc. (see Ref. [19] for details on the Grid).
3 Dual-pulse solitonic source optimization
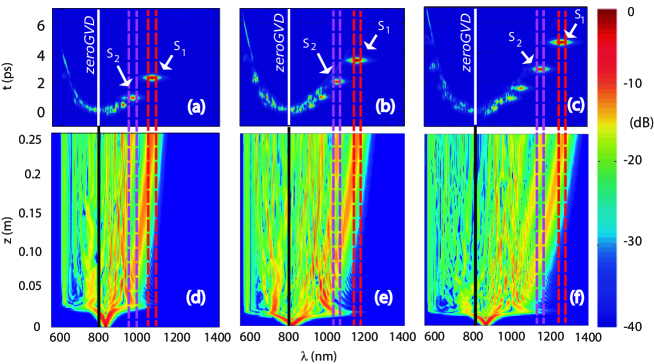
As mentioned above, the desired output spectral channels in this work intend to cover OCT applications in the NIR II window, where transparency of the biological tissues increases and scattering decreases [47]. Because spectral bell-shaped pulses avoid spurious structures in OCT images [48], the bright optical solitons are very good candidates for OCT applications. Figure 3 shows the spectral evolutions (bottom) and output spectrograms (top) corresponding to the best individuals obtained by the GA strategy and fitness function, Eq. 4, described in the previous section. All output spectra shown in Fig. 3 present the two reddest solitonic pulses, ejected from the soliton fission, accurately centered in the predefined channels () delimited by the dashed lines (see Table I for parameter values associated to results in Fig. 3). In Figs. 3(a) and 3(d), the target spectral channels where chosen from Ref. [29] in order to illustrate the solution for a dual-pulse source required in a realistic application. The other two cases, Figs. 3(b,e) and Figs. 3(c,f), demonstrate the tunability of such source, keeping fixed to nm without replacing the PCF but merely adjusting the input pulse parameters. We checked by benchmarks that several runs of the GA with fixed provided systematically very similar optimal results and therefore only one is shown here for each different case.
Regarding OCT applications, another important aspect of the source presented here is that the fs-SC dynamics typically exhibits a very high coherence and negligible shot-to-shot fluctuations [3], known to be detrimental for OCT [35]. Moreover, the two output solitonic pulses ( in Fig. 3) constituting the proposed OCT light source, provide a decent resolution [49] of m for the two solitons, .
| Optimal pulse parameters | Spectral bands | Resolution | Fitness | Shown in | |||
|---|---|---|---|---|---|---|---|
| (fs) | (nm) | (kW) | N | , (nm) | , (m) | () | |
| 90.01 | 834.98 | 5.012 | 20.14 | 1075, 975 | 9.8, 9.5 | 1.138 | Figs. 3(a,d) |
| 70.80 | 817.27 | 12.3501 | 36.24 | 1150, 1050 | 10.6, 9.2 | 1.107 | Figs. 3(b,e) |
| 101.13 | 849.24 | 9.6617 | 26.43 | 1225, 1125 | 10.1, 10.1 | 1.018 | Figs. 3(c,f) |
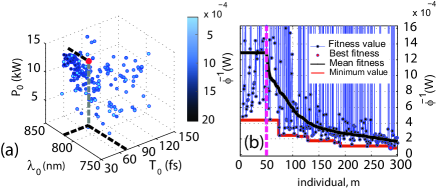
Figure 4(a) shows the chart in the parameter space containing all individuals involved in the optimization process. Data points distributed all over the volume are typically generated by the random stage 1 () and GOs tend to accumulate solutions around small volumes where fitness is typically small, with the overall effect of monotonically decreasing the average fitness value, observed when fitness is represented in order of execution [black curve in Fig. 4(b)]. However, the scattering ability of GOs often results in finding slightly better individuals in nearby regions presenting smaller agglomeration. An important reason for the convergence of our GA towards the optimal solutions is the fact that the operator is given a lower probability of action than (probabilities are and respectively, see previous section). This combination gives both a good diversity and probability to conserve the properties of the best individuals during the execution of the GA.
4 Conclusions
We presented an efficient optimization procedure based on GAs deployed in the Grid platform, providing faster results and potential scalability of the computational resources. The optimization provides the optimum input pulse parameters required to control the SC dynamics in a way that the first two ejected Raman solitons are centered at two pre-defined wavelengths. The results are shown to be of interest for practical OCT applications in the NIR II region where dual frequency, pulsed sources enable in vivo imaging, and avoid spurious results.