Clustering structure of nuclei in deep inelastic processes
Abstract
A clustering aspect is explained for the 9Be nucleus in charged-lepton deep inelastic scattering. Nuclear modifications of the structure function are studied by the ratio , where and are a nucleus and the deuteron, respectively. In a JLab experiment, an unexpectedly large nuclear modification slope was found for 9Be, which could be related to its clustering structure. We investigated a mean conventional part of a nuclear structure function by a convolution description with nucleon momentum distributions calculated by antisymmetrized (or fermionic) molecular dynamics (AMD) and also by a simple shell model. We found that clustering effects are small in the conventional part, so that the JLab result could be associated with an internal nucleon modification or a short-range nuclear correlation which is caused by high densities due to cluster formation.
1 Introduction
Nuclear modifications of the structure function are known as the EMC effect [1], and such effects are shown by the ratio , where and indicate a nucleus and the deuteron, respectively, and is the Bjorken scaling variable. Various mechanisms contribute to the modifications. At large , nucleon Fermi motion in a nucleus gives rise to increase of the ratio . At medium (), nuclear binding is the major source of nuclear effects. In addition, modifications of internal nucleon structure could contribute. At small , the nuclear shadowing effects become prominent. The nuclear structure functions have been measured from small to large for many nuclei, and the nuclear modifications have been determined by global analyses of experimental data [2].
Nuclei are basically described by a shell model, where nucleons are assumed to move in an average central potential created by interactions of all the nucleons in a nucleus. However, cluster structure in a nucleus is not easily described by the shell model with a limited number of shells. We know that some nuclei in the region of the mass number have clustering configurations. It is interesting to study whether such clustering features appear in the nuclear structure functions .
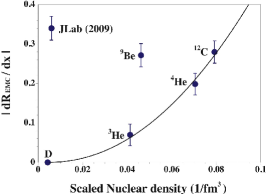
In 2009, an anomalously large nuclear effect was reported by the JLab measurement on the beryllium-9 structure function as shown in Fig. 1 [3], where the slope is shown as a functions of the scaled average nuclear density. The scaled means that the factor is multiplied for removing the struck nucleon. Although other data are on the smooth curve, the beryllium-9 data is much larger than the one expected from its average nuclear density.
It is known that the beryllium-9 has a clustering configuration with two nuclei and surrounding neutron clouds. Therefore, such an unexpected nuclear modification could come from the cluster formation in the nucleus. We investigated such a possibility by using a convolution description for the structure function with nucleon momentum distributions calculated by antisymmetrized molecular dynamics (AMD) and also by a simple shell model for comparison [4]. Then, possible reasons are suggested for the large slope of 9Be due to the cluster formation in the nucleus.
2 Clustering effects in nuclear structure functions
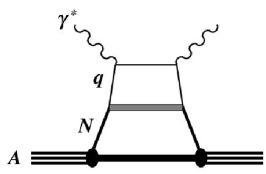
The standard method for describing the nuclear structure functions is to use the convolution description [5] for describing a mean conventional part. The structure function is given by the nucleonic one convoluted with a nucleon momentum distribution in the nucleus [1, 5] as shown in Fig. 2:
| (1) |
where is the momentum fraction with a light-cone momentum .
The momentum density is calculated by two methods, antisymmetrized molecular dynamics (AMD) [6] or fermionic molecular dynamics (FMD) [7], and a simple shell model for comparison. The AMD and FMD are essentially the same, so that we use the notation AMD hereafter. The AMD is a variational method, and its advantage is that there is no a priori assumption on nuclear structure whether it is a shell or cluster-like configuration. A nuclear wave function is given by the Slater determinant of single-particle wave functions
| (2) |
Here, a nucleon is described by the single-particle wave function where and indicate spin and isospin states, respectively. The function is the space part of the wave function, and it is assumed to be given by the Gaussian functional form:
| (3) |
where is a parameter to express the extent of the wave packet. The center of the wave packet is given by , where is a complex variational parameter. The variational parameters are then determined by minimizing the system energy with a frictional-cooling method. We use effective interactions which could describe gross properties of nuclei:
| 2-body: | ||||
| 3-body: | ||||
| LS: | (4) |
where , , , , , , , , and are constants.
The momentum distributions of Eq. (1) are also calculated in a simple shell model, where the potential is the harmonic-oscillator type (), for clarifying cluster effects by comparing two results. Its wave function is separated into radial- and angular-dependent parts: where , , and are spherical coordinates, and , , and are radial, azimuthal, and magnetic quantum numbers, respectively. The function is the spherical harmonics, and the radial wave function is given by
| (5) |
where is the Laguerre polynomial, and is defined by .
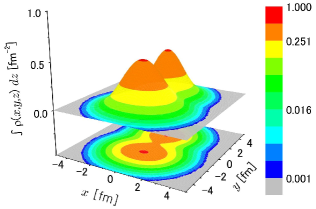
As a result, we obtain the two-dimensional spacial density of the 9Be nucleus in Fig. 3. It obviously indicates the existence of two clusters, together with surrounding neutron clouds. In a simple shell model, such clusters do not appear, and the density is a monotonic distribution. If the averages are taken over polar and azimuthal angles and , the distributions becomes the ones in Fig. 4. After the averages, the cluster structure is no longer apparent. Because the nucleons are confined mainly in two separate regions, the radial distribution is shifted toward large- region for 9Be in Fig. 4 as shown by the solid curve in comparison with the dashed one.
![[Uncaptioned image]](/html/1408.0660/assets/x4.png)
![[Uncaptioned image]](/html/1408.0660/assets/x5.png)
Figure 4. Spatial distributions. Figure 5. Momentum distributions.
The momentum distributions in Fig. 5 are calculated from the spacial distributions. Both AMD and shell-model results are shown for 4He and 9Be. The momentum distribution of the AMD is shifted toward the high-momentum region in 9Be, which is caused by the fact that the dense clusters are formed within the 9Be nucleus. If nucleons are confined in the small space regions of the clusters as indicated by the AMD, it leads to an increase of high momentum components.
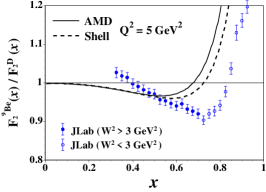
The modifications of the momentum distributions should affect the nuclear structure function in Eq. (1), and the results are shown for the structure function in Fig. 6. There are two theoretical curves by the AMD and shell model. In general, the theoretical ratios are consistent with the data in the sense that the ratio decreases at medium and it increases at large . These decrease and increase are caused by the nuclear binding and the nucleon’s Fermi motion, respectively. However, the simple convolution model is not sufficient to explain the experimental data. The differences should be attributed to the effects of short-range nucleon-nucleon correlations and modifications of internal nucleon structure. The correlation effects change the theoretical ratios toward the experimental data at . Since we are interested in an order-of-magnitude estimate of clustering effects, we did not step into such details in this work. In any case, the differences of the two curves, namely the clustering effects, are not large and they are of the same order of experimental errors. In Fig. 6, we found that the clustering effects are rather small in the mean conventional part of . Therefore, there should be other sources for the large slope of 9Be. We consider that the nuclear structure functions consist of the mean conventional part and the remaining one depending on the maximum local density:
| (6) |
The first part was calculated by the convolution model as shown in Fig. 6, and the second part seems to be important for explaining the JLab 9Be result. The second term is associated with the modification of internal nucleon structure and/or a short-range correlation caused by the cluster formation.
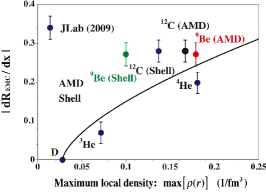
Although we do not step into detailed calculations in this work, we would like to find whether such an idea works. If the physics mechanism behind the JLab 9Be result is related to the cluster formation, observables could be interpreted by the cluster densities. For such estimates, we calculated maximum local densities by both AMD and shell models, rather than the average nuclear densities. In Fig. 7, the JLab data are plotted by the maximum local densities calculated in the AMD and shell model. The maximum densities are almost the same in the nuclei, 3He, 4He, and 12C, whereas the AMD density is much different from the shell-model one for 9Be. According to the shell model with a limited number of shells, the cluster formation, namely the large densities, cannot be described, and it leads to a small maximum density of 9Be in Fig. 7. It is also interesting to find that there is also a small cluster effect in the 12C. From Fig. 7, we find that all the data are on the smooth curve if the density is calculated by the AMD for 9Be; however, it is far away from the curve if it is evaluated by the shell model. The figure indicates that the large nuclear modification slope of 9Be should be related to the high densities created by the cluster formation.
The JLab measurement could be the first result on a clustering aspect of a nucleus in high-energy nuclear reactions. It could be associated with internal nucleon modifications and/or short-range nuclear correlations, which are caused by the high densities due to the cluster configuration. In future, there will be measurement for other nuclei, such as 6Li, 7Li, 10B, and 11B [8], so that much detailed information will become available.
3 Summary
The large nuclear modification slope of the structure function was found for 9Be, which has a typical cluster configuration. We showed that the clustering effects are rather small in the mean conventional part by using the convolution model for the structure functions with the momentum distributions calculated in the AMD and also in the shell model. The JLab result should be associated with the high-density formation due to the clusters in the 9Be nucleus. We showed it by plotting the JLab data as a function of the maximum local density of a nucleus. We have not clarified the physics origin behind its result. However, it is likely to be modifications of internal nucleon structure in the nuclear medium and/or short-range nucleon-nucleon correlations in the dense clusters. There is an approved experiment at JLab to measure the EMC effects in the mass region , so that much details will be investigated in the near future for possible clustering effects in deep inelastic scattering (DIS). The cluster physics has been investigated mainly in low energy nuclear reactions; however, DIS processes could shed light on new aspects in both cluster physics and nuclear structure functions. Cluster physicists have an opportunity to play a major role in high-energy hadron physics.
Acknowledgements
This work was supported by the MEXT KAKENHI Grant Number 25105010.
References
References
- [1] D. F. Geesaman, K. Saito, and A. W. Thomas, Ann. Rev. Nucl. Part. Sci. 45, 337 (1995).
- [2] M. Hirai, S. Kumano, and M. Miyama, Phys. Rev. D 64, 034003 (2001); M. Hirai, S. Kumano, and T.-H. Nagai, Phys. Rev. C 70, 044905 (2004); 76, 065207 (2007).
- [3] J. Seely et al., Phys. Rev. Lett. 103, 202301 (2009).
- [4] M. Hirai, S. Kumano, K. Saito, and T. Watanabe, Phys. Rev. C 83, 035202 (2011).
- [5] M. Ericson and S. Kumano, Phys. Rev. C 67, 022201 (2003).
- [6] Y. Kanada-En’yo, M. Kimura, and H. Horiuchi, C. R. Physique 4, 497 (2003).
- [7] H. Feldmeier and J. Schnack, Rev. Mod. Phys. 72, 655 (2000).
- [8] Jefferson Lab PAC-35 proposal, PR12-10-008, J. Arrington et al. (2009).