Shock formation in the collapse of a vapor nano-bubble
Abstract
In this Letter a diffuse-interface model featuring phase change, transition to supercritical conditions, thermal conduction, compressibility effects and shock wave propagation is exploited to deal with the dynamics of a cavitation bubble. At variance with previous descriptions, the model is uniformly valid for all phases (liquid, vapor and supercritical) and phase transitions involved, allowing to describe the non-equilibrium processes ongoing during the collapse. As consequence of this unitary description, rather unexpectedly for pure vapor bubbles, the numerical experiments show that the collapse is accompanied by the emission of a strong shock wave in the liquid and by the oscillation of the bubble that periodically disappears and reappears, due to transition to super/sub critical conditions. The mechanism of shock wave formation is strongly related to the transition of the vapor to supercritical state, with a progressive steepening of the compression wave to form the shock which is eventually reflected as an outward propagating wave in the liquid.
pacs:
Vapor bubble collapse is a fascinating classical problem Rayleigh (1917) involving vapor-liquid phase transition and extreme pressures and temperatures Taleyarkhan et al. (2002); Ohl (2010). Typical experiments concern ultra-fast imaging and the analysis of light and sound emitted after the collapse Pecha and Gompf (2000); Sankin et al. (2005); Weninger et al. (2000), see also the review Brenner et al. (2002). Both free cavitation bubbles and nano bubbles at solid walls are increasingly investigated Brenner and Lohse (2008); Weijs and Lohse (2013); Zhang et al. (2013). In ordinary conditions, gas bubble nucleation is associated with the metastability of the mixture of liquid and dissolved gas which, once the free energy barrier between the two states is overcome and the critical nucleus is formed, evolves toward a finite size bubble. The same mechanism is at work in forming pure vapor bubbles when the (ultra pure) liquid is kept in metastable conditions Davitt et al. (2010), i.e. its pressure is below the equilibrium vapor pressure at the given temperature. In these conditions, away from solid walls (see e.g. Giacomello et al. (2013) for the role of asperities on solid surfaces as a catalyst of bubble nucleation), local density fluctuations can generate the critical vapor nucleus from which the eventual bubble is formed.
Intermingled phenomenologies, Brennen (2013); Plesset and Prosperetti (1977), such as interface dynamics Keller and Kolodner (1956); Plesset and Chapman (1971), thermodynamics of phase change Fujikawa and Akamatsu (1980), and dissolved gas diffusion Akhatov et al. (2001), are a challenge to theoretical modeling of cavitation. The available descriptions combine two distinct adjoining regions, liquid and vapor phase, respectively, with vapor pressure taken to be the saturation pressure Hao and Prosperetti (1999) and phase transition accounted for through suitable kinetic equations and latent heat release Akhatov et al. (2001).
Contrary to available models, the diffuse interface approach discussed in the present Letter encompasses all phases (liquid, vapor and supercritical) and phase transitions involved, embedding capillary forces, compressibility effects and shock wave propagation. The approach enables an unprecedented analysis of collapse, where the bubble interface speed may exceed the speed of sound. This leads to the formation of a shock wave focused towards the bubble that is successively reflected back in the liquid. Latent heat of condensation and rapid compression locally bring the vapor in supercritical conditions. This explains the observed rebounds usually considered a typical feature of incondensable gas bubbles. Indeed, the liquid-vapor interface may disappear and reappear again, according to the local thermodynamic conditions.
The physical model. We exploit an unsteady diffuse interface description Anderson et al. (1998) of the multiphase flow based on the van der Waals gradient approximation of the free energy functional Dell’Isola et al. (1995); Jamet et al. (2001)
| (1) |
where is a coefficient controlling surface tension and interface thickness. For a van der Waals fluid, the free energy per unit volume at temperature and density is
| (2) |
with , the gas constant, the constant volume specific heat, and the van der Waals coefficients, with a suitable constant Zhao et al. (2011). The evolution is governed by the conservation equations for mass , momentum , and total energy, , where is the thermal conductivity. The stress tensor, , with the pressure and the classical viscous component, features the diffused capillary stress (see Supplemental Material (SM) see Supplemental Material at http://correct.site.url for details ),
accounts for surface tension , defined starting from the deviatoric component of the equilibrium contribution () to the stress tensor, , as the integral along a one-dimensional cut normal to the interface
with the normal distance across the interface, and the unit normal to the cut (tangent to the interface). In fact, the integral is restricted to the region of thickness where is substantially concentrated, resulting in see Supplemental Material at http://correct.site.url for details ; Cahn and Hilliard (1958), where and denote liquid and vapor, respectively.
The thermodynamic condition identifies completely the bulk state, and Eq. (2) provides the latent heat released during the phase change, , with the entropy per unit mass. As a consequence, the present model intrinsically features the phase transition whenever the local thermodynamic conditions are appropriate, as shown by the temperature equation
| (3) |
Along the phase transition, the factor , basically consists of the amount of heat required to change the state by . Assuming, for the sake of definiteness, an isothermal transformation in subcritical conditions, the integral of this term from vapor to liquid state is indeed the latent heat . Consistently with physical expectation, the van der Waals model prescribes a latent heat release only in subcritical conditions. In supercritical conditions, the same term is related to the isochoric thermal pressure coefficient , with the specific volume. Clearly, during the actual evolution, the thermodynamic transformation followed by a material element is not isothermal, the actual transformation being dictated by mass, momentum and energy conservation.
The model can in principle be extended to a more sophisticated equation of state (EoS) than the van der Waals’, when a direct comparison with experiments is sought for, see, e.g., Moss et al. (1994) where an empirical EoS is used to include dissociation and ionization effects which become relevant in the late stage of the collapse.
Simulation details. The system of conservation laws to be solved constitutes a quite non-standard problem that calls for specialized numerical techniques. We list here a few issues to provide a flavor of the numerics used in the simulations, see Supplemental Material, Section B see Supplemental Material at http://correct.site.url for details for a more complete discussion of the numerical method: i) The extremely thin liquid-vapor interface calls for a high numerical resolution; ii) Liquid, vapor, and supercritical fluid compressibility gives rise to shock waves propagating in a non-uniform, multiphase environment; iii) The system manifests a compound nature, partly controlled by acoustics (hyperbolic behavior) and partly induced by viscosity and capillarity (diffusion and dispersion, respectively); iv) Although the sound speed, , is well defined in most of the phase space (), a region exists below the spinodal where . This hybrid behavior Affouf and Caflisch (1991) is cause of failure for the standard hyperbolic solvers.
Bubble dynamics and shock evolution. The model described above is used to perform numerical simulations of spherically symmetric, pressure-induced bubble collapse. A vapor nano-bubble with radius is initially in equilibrium and the collapse is initiated by an overpressure enforced on the liquid, , where is the liquid equilibrium pressure. Cases differing for overpressure and for thermal conductivity, measured by , are considered to analyze their effects on the collapse dynamics. In all cases the initial temperature is and the surface tension is , corresponding to a realistic value for water. Here and throughout the subscript denotes critical values.
Along the evolution, the bubble radius is measured as the distance of the liquid region from the center of the bubble,
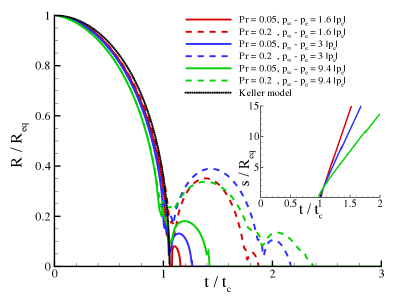
see Fig. 1 where data are shown for different and . The dynamics consists of a sequence of rebounds and collapses associated with shock formation. The collapse time of a macroscopic bubble is estimated as , with the bubble equilibrium pressure, where capillary, viscous and compressibility effects are neglected Brennen (2013); Plesset and Prosperetti (1977). For nano-bubbles, however, surface tension is crucial and the numerical results suggest the scaling
Before the first collapse, the radius evolution is independent of thermal conductivity with a slight sensitivity to the overpressure. Although predicted by models of incondensable gas bubbles Plesset and Prosperetti (1977), rebounds are missed by simplified models which neglect the inner vapor dynamics. The rebounds are affected by thermal conductivity and overpressure, Fig. 1. The radius where the first collapse phase ends, and the successive rebound starts, increases with the overpressure, suggesting the presence of an incondensable gaseous phase inside the bubble. The increase of the overpressure leads to faster dynamics, see the expression of , resulting in increased pressure inside the bubble. An enhanced thermal conductivity, solid lines in Fig. 1, reduces the subsequent oscillations of the bubble by diffusing thermal energy from the hotter bubble to the colder liquid, recovering the isothermal Keller model with no-rebounds in the limit .
The shock position is provided in the inset of Fig. 1. The seemingly different velocity is an artifact of the -dependent time scale . In fact is fairly constant. Away from the bubble, the shock propagates in the still liquid that, after the expansion wave, relaxed back to , . The shock speed is determined by the state ahead of the shock () and by an additional parameter, the density behind the shock, say, see Courant and Friedrichs (1976) and Zhao et al. (2011) for details concerning a van der Waals fluid. The small compressibility of the liquid , allows the linearization , where is the unperturbed sound speed in the liquid and . It turns out that for the cases explicitly reported here (more precisely, ).
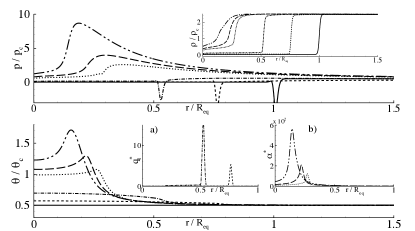
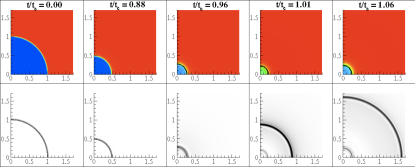
The main plot in the top panel of Fig. 2 shows the pressure profile through the bubble center for the initial phase of the process up to the bubble collapse. The corresponding density profiles are provided in the inset. Initially (solid, dashed and dash-dotted lines), the location of the interface is identified by an extremely sharp density drop. The bubble shrinks while the vapor density, pressure, and temperature (main plot in the bottom panel) increase. Successively, the shrinkage accelerates, the gaseous phase is compressed, its temperature raises and the fluid transitions to supercritical conditions (, ). During this phase the inner vapor core is surrounded by a shell of supercritical fluid whose density increases through a strong density gradient to eventually adjoin the external liquid. Later, the vapor disappears altogether, transformed into a low density supercritical fluid. Subsequently pressure and temperature peaks in the profile keep increasing. The late collapse phase is dominated by a strong pressure wave propagating in a homogeneous supercritical fluid which focuses into a converging shock (see Supplemental Material, Section C see Supplemental Material at http://correct.site.url for details for the comparison with a supercritical converging shock). Pressure and temperature extrema are reached at the first collapse time , when the inner low density core disappears.
In the inset of the bottom row of Fig. 2 we analyze the thermal aspects, Eq. (3), in particular the heat release rate . Let us consider the splitting , where is the characteristic function of the coexistence region ( for states below the coexistence curve and otherwise). The contribution due to the phase change is and the corresponding heat release rate is displayed in inset a) of Fig. 2 where is too small to be appreciated in the plot. At later times, inset b), the fluid in the bubble becomes supercritical, i.e. , and the term becomes substantial (for ideal gases , while in general , where thermal compressibility and thermal expansion coefficient are and , respectively).
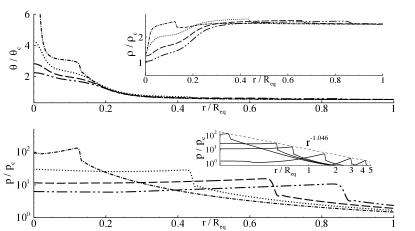
After reaching the bubble center, the shock is reflected and propagates toward the liquid, Fig. 3. The pressure peaks ahead of the shock follows the scaling law , inset of Fig. 3, as predicted by the compressible Hickling-Plesset model Hickling and Plesset (2004) for incondensable gas bubbles. After reflection, the fluid near the bubble center expands back and reduces quickly its temperature and pressure coming back to vapor with reappearance of the bubble. The expansion continues up to a maximum radius when the motion reverts and the process repeats itself.
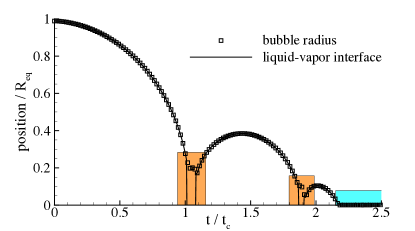
As already mentioned, during the dynamics the liquid-vapor interface may disappear and reappear several times. In Fig. 4 the interface position, defined only when vapor contiguous to the liquid exists, is compared with the bubble radius, which is well defined also when the inner fluid becomes supercritical. The time intervals corresponding to supercritical conditions are highlighted in orange. Soon after the shock emission, the inner core transitions back into vapor and the liquid-vapor interface appears again. The phenomenon repeats until a full condensation is achieved.
Discussion & conclusions.
| 1.43 | 1764 | 8.58 | 31.7 |
|---|---|---|---|
| 0.95 | 339 | 4.53 | 22 |
| 0.63 | 190 | 3.53 | 15.9 |
| 0.073 | 52.8 | 2.01 | 6.6 |
Phase change and transition to supercritical conditions play a crucial role in the collapse of a vapor nanobubble. Indeed, independently of the intensity of the initial overpressure, a strong pressure and temperature increase is experienced that induces the transition to incondensable gaseous state. As a consequence, a vapor bubble substantially resembles an incondensable gas bubble, making the boundary between the two kinds less sharply defined than usually assumed. The pressure and temperature peaks increase with as the strength of the emitted shock wave does, see Table 1. At fixed thermal conductivity, a limiting overpressure exists below which the bubble condenses altogether. Above the critical overpressure oscillations set in, with the bubble periodically reforming and emitting a shock upon collapse. From the above considerations it should be expected that a collapsing bubble could trigger a synchronized collapse of its neighbors. Indeed, the pressure at the distance from the bubble center is substantially larger than the initial overpressure, Table 1. Accounting for the decay of the pressure peak, the pressure of the wave exceeds the initial overpressure in a region extending for, typically, .
The present model for vapor-bubbles collapse can be extended under several respects: a) Incondensable gas dissolved in the liquid can be taken into account by extending the basic free energy functional (1) to include the composition of the mixture; b) More realistic transport coefficients can be assumed, e.g. dependence of viscosity and thermal conductivity on thermodynamic conditions can be included; c) A more general EoS can be adopted to take into account dissociation and ionization effects which are expected to quantitatively modify the dynamics of the collapse, reducing peak temperature and pressure, while maintaining the overall phenomenology basically unchanged.
Acknowledgments. The research leading to these results has received funding from the European Research Council under the European Union’s Seventh Framework Programme (FP7/2007-2013) / ERC Grant agreement n. [339446].
References
- Rayleigh (1917) L. Rayleigh, The London, Edinburgh, and Dublin Philosophical Magazine and Journal of Science 34, 94 (1917).
- Taleyarkhan et al. (2002) R. P. Taleyarkhan, C. West, J. Cho, R. Lahey, R. Nigmatulin, and R. Block, Science 295, 1868 (2002).
- Ohl (2010) C.-D. Ohl, Physics 3, 65 (2010).
- Pecha and Gompf (2000) R. Pecha and B. Gompf, Physical review letters 84, 1328 (2000).
- Sankin et al. (2005) G. Sankin, W. Simmons, S. Zhu, and P. Zhong, Physical review letters 95, 034501 (2005).
- Weninger et al. (2000) K. Weninger, C. Camara, and S. Putterman, Physical Review E 63, 016310 (2000).
- Brenner et al. (2002) M. P. Brenner, S. Hilgenfeldt, and D. Lohse, Reviews of modern physics 74, 425 (2002).
- Brenner and Lohse (2008) M. P. Brenner and D. Lohse, Physical review letters 101, 214505 (2008).
- Weijs and Lohse (2013) J. H. Weijs and D. Lohse, Physical review letters 110, 054501 (2013).
- Zhang et al. (2013) X. Zhang, H. Lhuissier, O. R. Enríquez, C. Sun, and D. Lohse, Langmuir 29, 9979 (2013).
- Davitt et al. (2010) K. Davitt, A. Arvengas, and F. Caupin, EPL (Europhysics Letters) 90, 16002 (2010).
- Giacomello et al. (2013) A. Giacomello, M. Chinappi, S. Meloni, and C. M. Casciola, Langmuir 29, 14873 (2013).
- Brennen (2013) C. E. Brennen, Cavitation and bubble dynamics (Cambridge University Press, 2013).
- Plesset and Prosperetti (1977) M. S. Plesset and A. Prosperetti, Annual Review of Fluid Mechanics 9, 145 (1977).
- Keller and Kolodner (1956) J. B. Keller and I. I. Kolodner, Journal of Applied physics 27, 1152 (1956).
- Plesset and Chapman (1971) M. S. Plesset and R. B. Chapman, J. Fluid Mech 47, 283 (1971).
- Fujikawa and Akamatsu (1980) S. Fujikawa and T. Akamatsu, Journal of Fluid Mechanics 97, 481 (1980).
- Akhatov et al. (2001) I. Akhatov, O. Lindau, A. Topolnikov, R. Mettin, N. Vakhitova, and W. Lauterborn, Physics of Fluids 13, 2805 (2001).
- Hao and Prosperetti (1999) Y. Hao and A. Prosperetti, Physics of Fluids (1994-present) 11, 2008 (1999).
- Anderson et al. (1998) D. Anderson, G. McFadden, and A. Wheeler, Annual review of fluid mechanics 30, 139 (1998).
- Dell’Isola et al. (1995) F. Dell’Isola, H. Gouin, P. Seppecher, et al., Comptes Rendus de l Académie des Sciences-Series IIB-Mechanics 320 (1995).
- Jamet et al. (2001) D. Jamet, O. Lebaigue, N. Coutris, and J. Delhaye, Journal of Computational Physics 169, 624 (2001).
- Zhao et al. (2011) N. Zhao, A. Mentrelli, T. Ruggeri, and M. Sugiyama, Physics of fluids 23, 086101 (2011).
- (24) see Supplemental Material at http://correct.site.url for details, .
- Cahn and Hilliard (1958) J. Cahn and J. Hilliard, J. Chem. Phys 28, 258 (1958).
- Moss et al. (1994) W. C. Moss, D. B. Clarke, J. W. White, and D. A. Young, Physics of Fluids (1994-present) 6, 2979 (1994).
- Affouf and Caflisch (1991) M. Affouf and R. E. Caflisch, SIAM Journal on Applied Mathematics 51, 605 (1991).
- Courant and Friedrichs (1976) R. Courant and K. O. Friedrichs, Supersonic flow and shock waves, Vol. 21 (Springer, 1976).
- Hickling and Plesset (2004) R. Hickling and M. S. Plesset, Physics of Fluids (1958-1988) 7, 7 (2004).