Unraveling the variability of Ori E
Abstract
Ori E (HD 37479) is the prototypical helium-strong star shown to harbor a strong magnetic field, as well as a magnetosphere consisting of two clouds of plasma. The observed optical () light curve of Ori E is dominated by eclipse features due to circumstellar material, however, there remain additional features unexplained by the Rigidly Rotating Magnetosphere (RRM) model of Townsend & Owocki. Using the technique of magnetic Doppler imaging (MDI), spectropolarimetric observations of Ori E are used to produce maps of both the magnetic field topology and various elemental abundance distributions. We also present an analysis utilizing these computed MDI maps in conjunction with NLTE TLUSTY models to study the optical brightness variability of this star arising from surface inhomogeneities. It has been suggested that this physical phenomena may be responsible for the light curve inconsistencies between the model and observations.
keywords:
stars: magnetic fields, stars: rotation, stars: early-type, stars: circumstellar matter, stars: individual: HD 37479, techniques: spectroscopic, techniques: polarimetric, ultraviolet: stars1 Introduction
The B2Vp star Ori E (HD 37479) has long been known as the prototypical He-strong magnetic Bp star. Because of its status, it has been one of the most well studied of such stars, exhibiting numerous types of observed variability all modulated on the stellar rotation period. The combination of high rotation speed () and a strong, global magnetic field (kG) makes Ori E an excellent laboratory to study the interaction of magnetism, rotation, and mass-loss; three essential parameters to determine the stellar evolutionary course. With this enigmatic object in mind, Townsend & Owocki (2005) developed their Rigidly Rotating Magnetosphere (RRM) model to describe the circumstellar environment of a oblique magnetic rotator in which rapid rotation keeps magnetically trapped material supported against gravity via centrifugal forces, with material accumulating at the intersection between the rotational and magnetic equators.
This analytical model, applied to the specific case of Ori E by Townsend et al. (2005), produced a prediction of two co-rotating “clouds” of plasma, thought to be responsible for several observed variations, including Hα emission and what appear to be eclipses in the optical photometric light curve. Good agreement was found between observations and model computed data, mainly because of the implementation of an offset dipolar magnetic configuration to achieve an asymmetry in the size of the two plasma clouds to better fit the observations. Regardless, the fit to the photometric light curve by this purely circumstellar model was still unable to reproduce one major feature, a brightening of the star directly after the second cloud passes across the stellar surface. This discrepancy suggests important physics are missing from the model, and led to a mass effort to obtain new, current data to determine the origin of this feature. New and historical photometry demonstrate that the stellar rotation rate is decreasing due to the influence of the magnetic field on angular momentum of the system Townsend et al. (2010). MOST photometry revealed a precise, stable brightness variation, confirming the asymmetry of the eclipses and the presence of additional brightening unfit by the RRM model (Townsend et al. 2013). A set of high resolution spectropolarimetric data of Ori E was analysed by Oksala et al. (2012) to determine line profile variability and to more precisely calculate the variation of the longitudinal magnetic field. These authors also showed that the de-centered dipole invoked by Townsend et al. (2005) is not compatible with the observed circular polarisation signatures.
In light of these substantial changes in our view of Ori E, the constraints and parameters used in the RRM model must also be revisited. Ultimately our goal is to achieve a model such that we properly understand the separate contributions to the variability from the star and the magnetically confined material. In this work, we present two first steps towards this aim, magnetic Doppler imaging (MDI) and a synthetic light curve analysis.
2 Magnetic Doppler Imaging
We obtained a total of 18 high-resolution (R=65000) broadband (370-1040 nm) spectra of Ori E in November 2007 with the Narval spectropolarimeter on the 2.2m Bernard Lyot telescope (TBL) at the Pic du Midi Observatory in France and in February 2009 with the spectropolarimeter ESPaDOnS on the 3.6-m Canada-France-Hawaii Telescope (CFHT), as part of the Magnetism in Massive Stars (MiMeS) Large Program (Wade et al. 2011).
Magnetic Doppler imaging (MDI), previously employed to study Ap/Bp stars, investigates both the surface inhomogeneities of various elements and the magnetic field topology assuming rotational variation of line profiles with time. We applied the MDI code INVERS10, developed by Piskunov & Kochukhov (2002), to our set of spectra to determine, for Ori E, the stellar magnetic field and surface abundance features of a number of different elements.
2.1 Magnetic Field
The Stokes and Stokes line profiles of He i 5867 Å and 6678 Å were used to determine the best fit magnetic topology for Ori E. With the longitudinal magnetic field curve computed by Oksala et al. (2012) as an additional constraint in addition to the multipolar regularization, the derived magnetic field configuration suggests a magnetic field with both a dipole with polar strength kG and orientation angles and , and a quadrupole component with strength kG. The quadrupole axis is offset from the dipole where the positive and negative poles are clearly not separated by 180∘.
2.2 Surface Abundances
With the derived magnetic field topology set as a fixed parameter, INVERS10 was then used to compute the distribution of various chemical elements on the surface of the star. The set of high resolution time-series spectra of Ori E contains lines suitable for modeling the abundances of Fe, Si, C, and He. Other chemical elements are present in the spectrum, but their line strength was too weak for accurate determination of any surface structure. He lines required a slightly more rigorous treatment, and were fit with INVERS13 (for more details see Kochukhov et al. 2012, 2013).
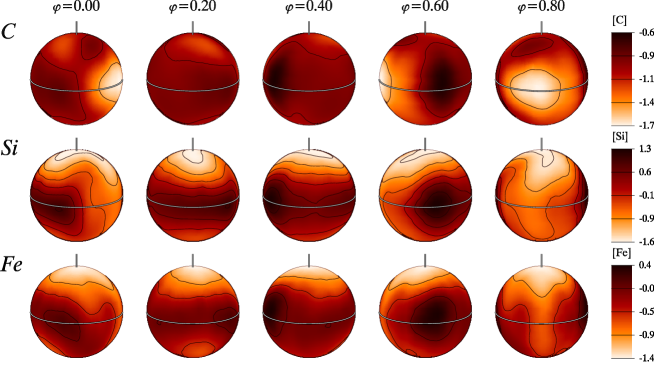
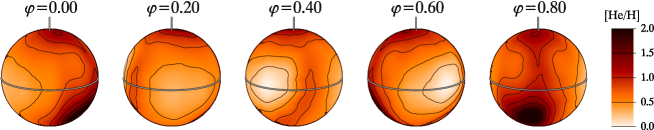
The Stokes spectral lines were fit to good agreement between the observations and the model fits for all of these lines. Figure 1 displays spherical maps of the abundance distribution for Fe, Si, and C, with He displayed in Figure 2. The maps indicate that the metals all show a similar pattern over the stellar surface. The minimum abundances are found at rotational phase 0.8, in both a spot at the equator and at the top pole. An equatorial spot at phase 0.5 has the maximum value on the surface. The He abundance map indicates a large spot of overabundance at phase 0.8, located in the lower hemisphere. The minimum abundance is located at phase 0.6, with a normal, solar level of He. The spot of enhanced He does not appear to be correlated with the location of the magnetic poles. Note the anti-correlation between the strength of metals and He, previously established by Oksala et al. (2012) from EW variations.
3 Synthesis of Strömgren photometric light curves
The output from the MDI abundance analysis produces tables of a grid of values over the stellar surface for various latitudes, which can then be used as input to determine the brightness variation due to the presence of inhomogeneous spots. Krtička et al. (2007) have used this technique for the case of the He-strong star HD 37776, and find excellent agreement between synthetic and observed light curves. The output of MDI for Ori E was used as input for a similar treatment, in which grids of TLUSTY model atmospheres (Hubeny & Lanz 1995; Lanz & Hubeny 2007) and SYNSPEC synthetic spectra were computed, using a fixed and , but with varying abundance values.

The radiative flux in a band , at a distance from the star, with radius is (Mihalas 1978)
| (1) |
The specific band intensity is obtained by interpolating between intensities at each surface point, calculated from the grid of synthetic spectra. The magnitude difference in a given band is defined as
| (2) |
where is calculated from Eq. 1 and is the reference flux obtained under the condition that the mean magnitude difference over the rotational period is zero.
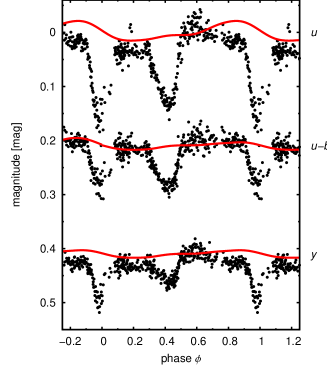
To obtain predicted light curves, the magnitude differences were computed for each individual rotational phase. For each element, an individual light curve was computed, with the results plotted in the left side of Figure 3. Finally, a light curve representative of the photospheric contribution to the brightness variation is produced by combining the effects from all element contributions (right side of Figure 3). He dominates this final produce due to its extreme abundance compared to the relatively smaller abundance changes in metals. As He has its maximum brightness at phase 0.8, it is clear that the photosphere is not responsible for the excess brightness in the observed photometric light curve seen at phase 0.6.
4 Conclusions
We have used new spectropolarimetric observations to study the elemental surface structure and magnetometry of the prototypical Bp star Ori E. The analysis and results presented in Section 3 clearly demonstrate that photospheric inhomogeneities on the stellar surface are not responsible for the light curve feature not fit by the RRM model. This conclusion indicates that there are remaining physics missing, likely in the treatment of the circumstellar model, which at present is quite simple. However, the model for comparison in this case lacks the proper magnetic model determined in Section 2.1. Currently, work is progressing on updating the RRM model to be more consistent with the observed physical properties of the star. This work will allow for a more accurate determination of whether the model needs to include additional physical processes, such as scattering.
References
- Hesser et al. (1977) Hesser, J. E., Ugarte, P. P., & Moreno, H. 1977, ApJ 216, L31
- Hubeny & Lanz (1995) Hubeny, I. & Lanz, T. 1995, ApJ 439, 875
- Kochukhov et al. (2013) Kochukhov, O., Mantere, M. J., Hackman, T., & Ilyin, I. 2013, A&A 550, A84
- Kochukhov et al. (2012) Kochukhov, O., Wade, G. A., & Shulyak, D. 2012, MNRAS 421, 3004
- Krtička et al. (2007) Krtička, J., Mikulášek, Z., Zverko, J., & Žižńovský, J. 2007, A&A 470, 1089
- Lanz & Hubeny (2007) Lanz, T. & Hubeny, I. 2007, ApJS 169, 83
- Mihalas (1978) Mihalas, D. 1978, Stellar atmospheres, 2nd edition, W. H. Freeman and Co., San Fransisco
- Oksala et al. (2012) Oksala, M. E., Wade, G. A., Townsend, R. H. D., et al. 2012, MNRAS 419, 959
- Piskunov & Kochukhov (2002) Piskunov, N. & Kochukhov, O. 2002, A&A 381, 736
- Townsend et al. (2010) Townsend, R. H. D., Oksala, M. E., Cohen, D. H., Owocki, S. P., & ud-Doula, A. 2010, ApJ 714, L318
- Townsend & Owocki (2005) Townsend, R. H. D. & Owocki, S. P. 2005, MNRAS 357, 251
- Townsend et al. (2005) Townsend, R. H. D., Owocki, S. P., & Groote, D. 2005, ApJ 630, L81
- Townsend et al. (2013) Townsend, R. H. D., Rivinius, T., Rowe, J. F., et al. 2013, ApJ 769, 33
- Wade et al. (2011) Wade, G. A., Alecian, E., Bohlender, D. A., et al. 2011, in C. Neiner, G. Wade, G. Meynet, & G. Peters (eds.), IAU Symposium, Vol. 272 of IAU Symposium, pp 118–123
KhalackCould you please comment about possible errors in the simulated light curve caused by taking into account just contribution from horizontal stratification only four elements?
OksalaWe consider all element contributions from lines that we are able to detect a significant spectral feature with variability. As He dominates the light curve structure, any elements with minimal abundances will not contribute any significant amount.
TkachenkoWhen do you the light curve synthesis, do you assume a global model atmosphere, or you have a grid of models with each model in it being specific to a given surface element?
OksalaA grid of models are computed for each combination of varied abundance for all four elements. Each ”grid” surface element is correlated with the appropriate model based on the output MDI maps.