Ranking the Economic Importance of Countries and Industries
Abstract
In the current era of worldwide stock market interdependencies, the global financial village has become increasingly vulnerable to systemic collapse. The recent global financial crisis has highlighted the necessity of understanding and quantifying interdependencies among the world’s economies, developing new effective approaches to risk evaluation, and providing mitigating solutions. We present a methodological framework for quantifying interdependencies in the global market and for evaluating risk levels in the world-wide financial network. The resulting information will enable policy and decision makers to better measure, understand, and maintain financial stability. We use the methodology to rank the economic importance of each industry and country according to the global damage that would result from their failure. Our quantitative results shed new light on China’s increasing economic dominance over other economies, including that of the USA, to the global economy.
I Introduction
The growth of technology, globalization, and urbanization has caused world-wide human social and economic activities to become increasingly interdependent helbing2010fundamental ; havlin2012challenges ; san2012challenges ; helbing2012systemic ; lazer2009life ; king2011ensuring ; lorenz2011social ; yamasaki2012complex ; meng2009production ; rinaldi2001identifying ; solomon2003pioneers ; levy2010scale ; klimek2012empirical . From the recent financial crisis it is clear that components of this complex system have become increasingly susceptible to collapse. Integrated models, currently in use, have been unable to predict instability, provide scenarios for future stability, or control or even mitigate systemic failure. Thus, there is a need of new ways of quantifying complex system vulnerabilities as well as new strategies for mitigating systemic damage and increasing system resiliency farmer2009economy ; lux2009economics . Achieving this would also provide new insight into such key issues as financial contagion forbes2001measuring ; forbes2002no and systemic risk bodie2002investments ; billio2010econometric ; bisias2012survey and would provide a way of maintaining economic and financial stability in the future.
It is clear from the recent crisis that different sectors of the economy are strongly interdependent. The housing bubble in the USA caused a liquidity freeze in the international banking system, which in turn triggered a massive slowdown of the real economy costing many trillions of dollars and threatening the financial integrity of the European Union. This demonstrates the high level of dependence between different components in the world economic system. Because strong nonlinearities and feedback loops make economic systems highly vulnerable, we need to understand the behavior of the interacting networks that comprise the economy. How do they interact with each other, and what are their vulnerabilities? One may consider an industry in two countries respectively, for example, electrical equipment industry in China and the USA, and ask which industry is more important to economic stability, electrical equipment in China or that in the USA? Is electrical equipment in China more critical for global economy stability when the production in electrical equipment in China is reduced, and how it will impact the industries within the country and industries abroad.
To answer these questions, we employ recent advances in the theory of cascading failures in interdependent networks buldyrev2010catastrophic ; gao2011networks ; li2012cascading . In the case of interdependent networks, a malfunction of only a few components can lead to cascading failures and to a sudden collapse of the entire system. This is in contrast to single isolated networks, which tend to collapse gradually parshani2010interdependent . These recent results indicate the central importance of interconnectivity and interdependency to the stability of the entire system. There have been studies of the complex set of coupled economic networks garas2010worldwide ; schweitzer2009economic ; huang2013cascading ; hidalgo2008network . However, the importance of countries and industries in the stability of the global economy have not been analyzed, and there is a need for useful methods to quantify and rank their economic importance and influence.
The input-output (IO) model is a technique that quantifies interdependency in interconnected economic systems. Wassily Leontief leontief2004wassily first introduced the IO model in 1951, for which he received the Nobel Prize in Economics in 1973. It can be used to study the effect of consumption shocks on interdependent economic systems isard1960methods ; lahr2001input ; ten2005economics ; miller2009input ; santos2006inoperability ; pokrovskii2012econodynamics ; leontiev1986input . Analysis of IO data is performed using such techniques as the hypothetical extraction method (HEM) miller2001taxonomy ; temurshoev2010identifying . Although HEM can measure the relative stimulative importance of a given industry by calculating output with and without the industry being examined, it does not quantify each industry’s full spectrum of importance to the stability of global economic system. For example, if an industry in a given country collapses completely due to natural disaster or civil unrest it will no longer be able to consume products supplied by other industries. This can cause cascading failure in the economic system if the other industries cannot function when the cash flow from the failed industry is removed. By measuring how widely the damage spreads, we will rank here an industry’s importance within the world-wide economic system.
In this paper we examine the interdependent nature of economies between and within 14 countries and the rest of the world (ROW). We use an “input-output table” timmer2012world and focus on economic activity during the period 1995–2011. From the table we analyze data from 14 countries (Australia, Brazil, Canada, China, Germany, Spain, France, UK, India, Italy, Japan, Korea, Russia, and USA) and from the rest of the world (ROW). The economic activity in each country is divided into 35 industrial classifications. Each cell in the table shows the output composition of each industry to all other 525 industries and its final demand and export to the rest of the world (see Ref. wiotdata ). We construct an output network using the 525 industries as nodes and the output product values as weighted links based on the input-output table, and focus on the output product value for each industry.
Our goal is to introduce a methodology for quantifying the importance of a given industry in a given country to global economic stability with respect to other industries in countries that are related to this industry. Thus, we study the inflow and outflow of money between each set of 35 industries and the ROW in each of the 14 countries (see the Data section for more detail). We use the theory of cascading failures in interdependent networks to gain valuable information on the local and global influence on global stability of different economic industries, a methodology that can provide valuable new insights and information to present-day policy and decision makers.
II World Input-Output Table Data
The database we use in this study is the World Input-Output Table (WIOT) wiotdata . It provides data for 27 European countries, 13 other countries, and the rest of the world (ROW) for the period 1995–2011. For our sample, we select the 14 countries with the largest domestic input and the largest import in production in 2011 and also the ROW (adding the remaining 26 countries into the ROW). Using this sample, we construct a new input-output industry-by-industry table. For sake of simplicity, we assume that each industry produces only one unique product. In the WIOT, the column entries represent an industry’s inputs and the row entries represent an industry’s outputs. The rows in the upper sections indicate the intermediate or final use of products. A product is intermediate when it is used in the production of other products (intermediate use). The final use category includes domestic use (private or government consumption and investment) and exports. The final element in each row indicates the total use of each product. The industry columns in the WIOT contain information on the supply of each product. The columns indicate the values of all intermediate, labor, and capital inputs used in production. Total supply of the product in the economy is determined by domestic input plus final demand. The IO table contains negative numbers as outputs for various reasons timmer2012world , but their fraction is fairly small and their values are small as well. For simplicity, we set these negative numbers as zero in our analysis.
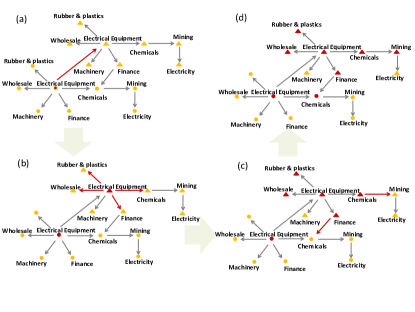
Based on the supply of the product for each industry, it is possible to construct a directed product supply network. Then we reverse the direction of the links in the network (see schematic representation in Fig. 1), and the network represents the money outflow from one industry to another; e.g., electrical equipment industry is pointing to machinery industry because electrical equipment industry buys a product from machinery industry. The links are weighted according to the value of products from machinery industry as its output electrical equipment industry as its input.
III Industry tolerance
In order to quantify and rank the influence of industries in the stability of this global network, we perform a cascading failure tolerance analysis buldyrev2010catastrophic . Our model is described as follows. Suppose industry A fails, other industries can no longer sell their products to industry A and thus they lose that revenue. The revenue industry B is reduced by a fraction , which is defined as industry B’s revenue reduction caused by the failure of industry A divided by that industry B’s total revenue. The tolerance fraction is the threshold above which an industry fails. This occurs when reduced revenue fraction is larger than tolerance fraction . Here we assume that (i) is the same for all industries and that every industry fails when its and (ii) the failure of an industry in country A does not reduce the revenue of the other industries in the same country A because they are able to quickly adjust to the change.
The methodology can be schematically illustrated as follows: In step 1, industry in country fails. This causes other industries in other countries to fail if their . Assume that in step 2 industries , , and fail. The failure of these industries in step 2 will reduce other industries’ revenue and cause more industries including those in country to have a reduced fraction . Thus in step 3 there is an increased number of industries whose . Eventually the system reaches a steady state in which no more industries fail. The surviving industries will all have a reduced revenue fraction that is smaller than the tolerance fraction, i.e., . Figure 1 demonstrates this process, and the subfigures show the steps in the cascading failure.
To determine how much the failure of each industry would impact the stability of the economic network, we change the tolerance fraction from 0 to 1 and measure the fraction of surviving industries left in the network. When the tolerance fraction approaches 0, any revenue reduction caused by the failure of one industry can easily destroy almost all the other industries in the network, and the network will collapse. When the tolerance fraction approaches 1, all the industries can sustain a large reduction of revenue and the failure of one industry will not affect the others.
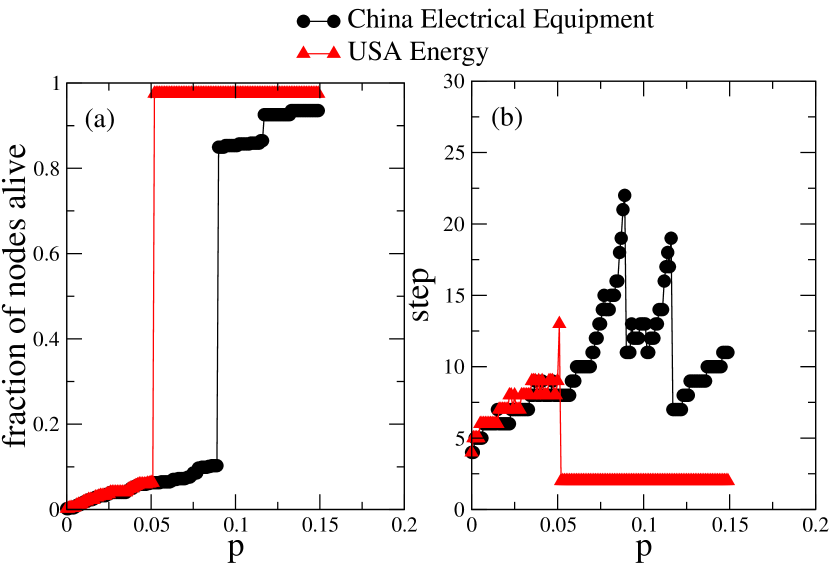
Figure 2(a) shows the failures of electrical equipment industry in China and energy industry in the United States for the 2009 WIOT and shows the fraction of the largest cluster of connected and functional industries as a function of the tolerance fraction after the Chinese electrical equipment industry becomes malfunction and is removed from the network due to a large shock to this industry. The shock could result from different causes, such as natural environmental disaster, government policy changes, insufficient financial capability. The removal of China electrical equipment industry will cause revenue reduction in other industries because China electrical equipment industry is not able to buy products and provide money to other industries. When is small, the industries are fragile and sensitive to the revenue reduction, causing most of the industries fail, and the number of the surviving industries is very small. When is large, the industries can tolerate large revenue reduction and are more robust when revenue decreases. The number of the surviving industries tends to increase abruptly at a certain value as increases. Figure 2(b) shows the number of cascading steps that elapse before a stable state is reached as a function of tolerance fraction after removing the Chinese electrical equipment industry or the USA energy industry. The number of steps reaches a peak when approaches criticality parshani2010interdependent .
Here we analyze for each of the 525 industries this important parameter, the critical tolerance threshold . Our goal is to determine the threshold at which global network subject to collapse becomes stable and most of the industries in the network survive after initial failures. To this end, we assume that the is the critical threshold below which less than 30% of industries survive. When , more than 30% of the remaining industries survive after the failure cascade in the system is over. When , the survival rate of the remaining industries is 30% or less. The higher this threshold, the higher the impact of a failing industry will be on the vulnerability of the global network. Without losing generalization, we also take different fraction of surviving industries to set in simulations. For example, when the is the threshold below which 50% of industries survive, the importance of industries and countries maps are shown as in supplementary information. The correlation of values in simulations using 50% fraction of surviving industries and 30% surviving industries is 1 and the are identical in both scenarios. Thus, we find that the critical threshold is not sensitive to the chosen fraction in this industry network, for values below 50%. The following in this study is defined as the critical threshold below which less than 30% of industries survive.
We use this methodology to test how the failure of an individual industry in a given country impacts the stability of the entire system. Thus, of an industry is our measure of the importance of this industry in the global economic network.
Using the tolerance threshold , we can quantify and rank the economic importance of each industry. We measure the tolerance threshold of 35 industries in 14 countries between 1995 and 2011. We calculate the tolerance of each industry according to how much it affects the entire network, i.e., all 35 industries in all 14 countries.
IV Importance of Country and Industry
The proposed methodology provides the means to quantify and rank the importance of each industry to the stability of the global economic network or the importance of each country in the global economic network.
We define the importance of each country by averaging all the 35 industries within the country for a specific year,
| (1) |
where is the number of industries. To rank the importance of a given country, we average the tolerance across industries as shown in Eq. 1.
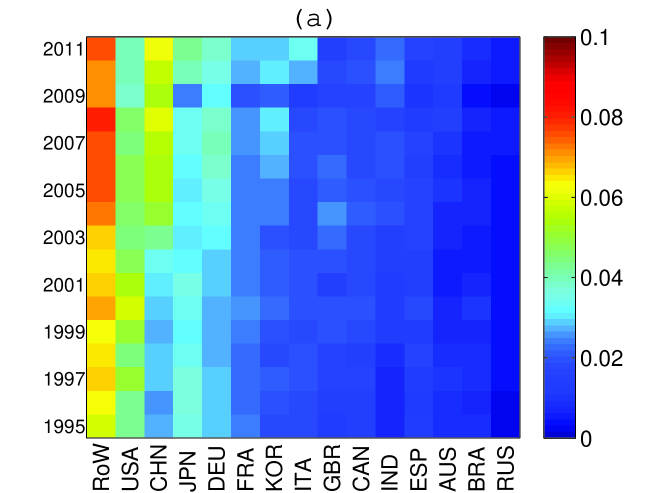
Figure 3(a) shows the importance of all countries for different years where the average in Eq. 1 is taken over the four largest values, in order to consider the strongest industries. Note that the rest of the world (RoW) is the most important ”country” since it includes many countries other than the 14 countries included in the sample. Countries in RoW provide products that are crucial inputs to these 14 countries and their industries. We also define the importance of the individual industries in terms of the average of their ,
| (2) |
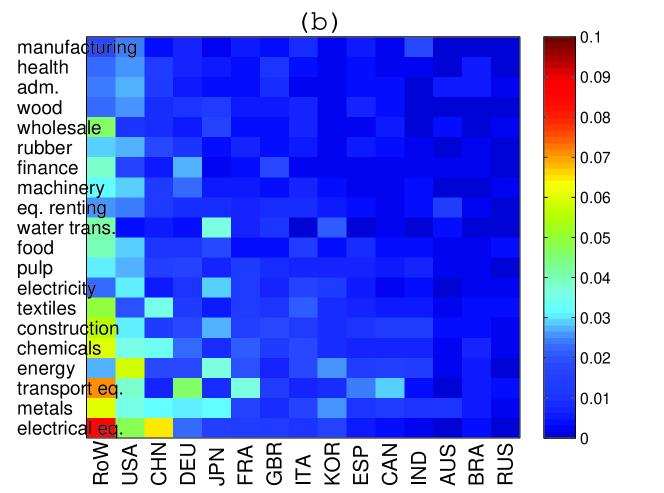
where denotes years. Figure 3(b) shows the average tolerance of industry over all years (1995-2011) for the individual countries. For the sake of clarity, we plot only the top 20 industries with respect to the average of values for all the countries. Note that the electrical equipment industry is the most important when we average the tolerance fraction across 17 years. The energy industry in the United States, for example, is relatively high because the United States is the world’s largest energy consumer.
V Robustness and stability of economic structure
We use the critical tolerance threshold to measure the importance of each industry in the global economic network. We can also rank each industry according to their tolerance for each separate country—the tolerance of industry in country . By comparing industry order rankings for different years, we can study the similarity in economic environment across a period of 17 years.
To do this we use the Kendall coefficient kendall1938new , which measures rank correlation, i.e., the similarity in data orderings when ranked by each quantity. Let be a set of observations of the random variables and respectively. Any pair of observations and is concordant if the ranks for both elements agree, that is if and or if and . Otherwise the pair is discordant. If or , the pair is neither concordant nor discordant. The Kendall coefficient is defined as
| (3) |
where is the number of concordant pairs and is the number of discordant pairs. The coefficient is in the range . When the agreement between the two rankings is perfect, the coefficient is 1. When the disagreement between the two rankings is perfect, the coefficient is . If and are independent, the coefficient is approximately zero.
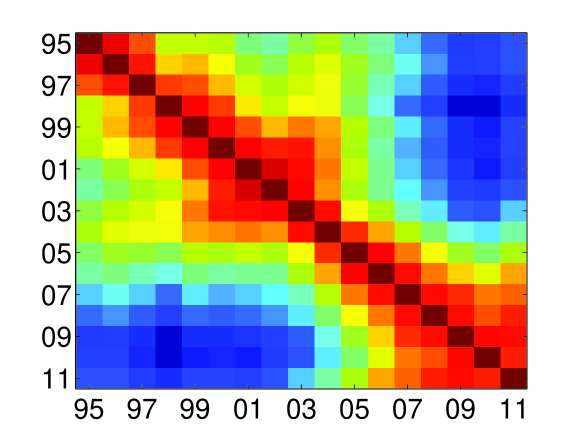
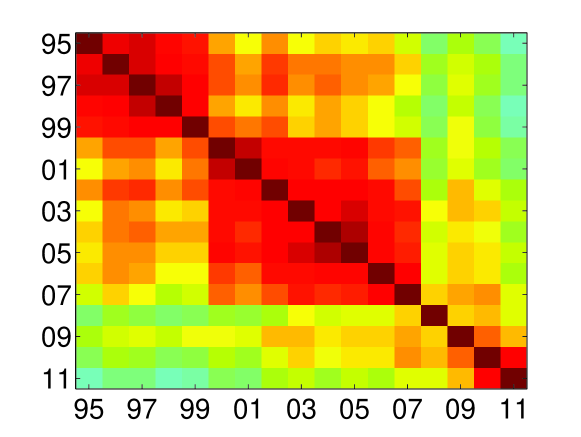
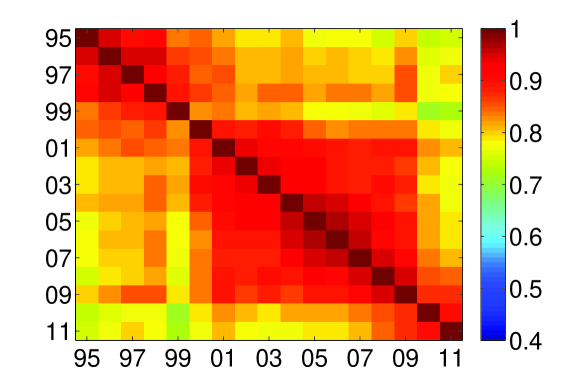
We use the Kendall to investigate the evolution of the economic structure of each country in our sample. For each year, we rank the industries in each country according to their tolerance values, and calculate the Kendall for every year pair. Figure 4 shows the values of the Kendall for all pairs of years, for China (Fig. 4(a)), USA (Fig. 4(b)), and Germany (Fig.4(c)), using a color code ranging from blue, for low similarity, to red, for high similarity (see Supplementary Information for all other countries). For these three countries, we find different behaviors in terms of the stability and consistency of the economic structures. For the case of China, we observe that the structure changes significantly, with high values of the Kendal correlation (represented using red) only presenting for previous 23 years (as can be observed from the diagonal of elements of Fig. 4(a)). However, in the case of the USA, it is possible to observe three periods in terms of stability of the economic structure: 1995-1999, 2000-2007, and 2008-2011 (see Fig. 4(b)). The first marks the period leading to the ”dot.com” crisis, which was followed by a significant change in the US market structure. The second marks the period leading unto the financial crisis, which again was followed by a significant change in the US market structure. Finally, the third marks the period following the financial crisis, which shows no stable period in terms of market structure. Finally, in the case of Germany, we observe only two periods: 1995-1999, and 2000-2011 (see Fig. 4(c)). The first period can be also attributed to that apparent in the case of the USA, however possibly to a lesser extent and also resulting from the introduction of the Euro currency. However, in the case of Germany we do not observe a change in structure following the recent financial crisis, which highlights the degree of stability in the German economy.
VI The rise of China
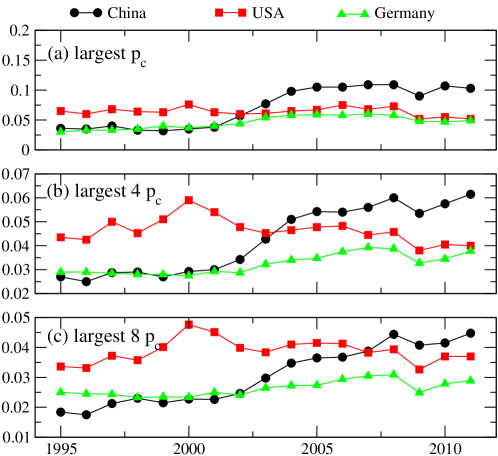
Due to the fact that economic influence is dynamic across time, we ask whether the methodology presented here can provide new information on the increase or decline of economic importance. In each year we calculate the individual industry tolerance as described above. We then calculate the average tolerance of each country for a given year. Figure 5 shows the average of of country for the 17-year period investigated. In Figure 5(a), we show the largest tolerance in China, the USA and Germany along 17 years. Figure 5(b) shows the average of 4 largest industries , and Figure 5(c) shows the average of 8 largest in each country.
We find that the average tolerance of China becomes larger than that of the USA after 2003, which is most pronounced in Figure 5(b). The USA tolerance first increases from 1995 to 2000, then decreases from 2000 to 2009, with a slight increase in 2010-2011. Germany’s tolerance in general increase in the investigated period and shows certain fluctuations between 2000 and 2005. Note that for the USA the change across time is minor but that the economic importance of China increases significantly. The economic importance of China relative to that of the USA shows a consistent increase from year to year, illustrating how the economic power structure in the world’s economy has been changing during time.
To further validate these results, we compare the total product output (see Figure 6, red triangle) and average tolerance (see Figure 6, black circles) for China, USA, and Germany, as a function of time. The product output (see Figure 6, red triangle) value is the total money flow a country supplies to the other countries plus value added in the products, which also indicates its total trade impact on foreign countries. Studying Figure 6, we find that generally speaking the total outputs of the three investigated countries grows throughout time, with that of the USA and China being higher in value than that of Germany (see Figure 6, right y-axis). However, by comparing the tolerance , we find three different behaviors. First, for the case of China (Figure 6(a)), we find that both the tolerance and total outputs are growing in time, and observe that in the early 2000’s there was a jump in the tolerance , following by a sharp increase in the total output. Secondly, for the case of the USA (Figure 6(b)), we find that while the total output is increasing in time, the tolerance is in a decreasing trend. Finally, for the case of Germany (Figure 6(c)), we find that while the total import is increasing in time, the tolerance is rather stable with small fluctuations.
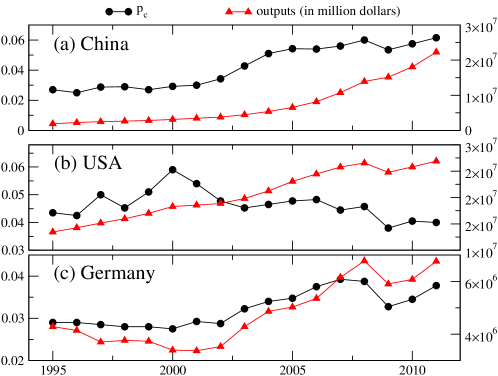
This provides further evidence into the change in influence of these three important economies - that of China is increasing, that of the US is declining, and that of Germany is rather constant across time. Comparing the total output to the tolerance provides further evidence that the tolerance measurement of country’s impact reveals the underlying economic evolving dependencies which is not obvious from the simple measurement of total output capability.
VII Conclusions
We developed a framework to quantify interdependencies in the world industrial network and measure risk levels in global markets. We use the methodology to rank the economic importance of each industry and country according to the global damage that would result from their failures. Using network science to investigate input-output data of money flows between different economic industries, it becomes possible to stress test the global economic network and identify vulnerabilities and sources of systemic risk. Our quantitative results shed new light on China’s increasing economic influence over other economies, including that of the USA. The resulting information will enable policy and decision makers to better measure, understand, and maintain financial stability.
Acknowledgements.
We would like to thank the European Commission FET Open Project FOC 255987 and FOC-INCO 297149 for financial support. We wish to thank the ONR, DTRA, DFG, EU project, Multiplex and LINC, EU projects, the Keck Foundation, and the Israel Science Foundation for financial support.References
- (1) D. Helbing and S. Balietti. Fundamental and real-world challenges in economics. Science and Culture, 76(9-10):1680262, 2010.
- (2) S. Havlin, D. Y. Kenett, E. Ben-Jacob, A. Bunde, R. Cohen, H. Hermann, JW Kantelhardt, J. Kertész, S. Kirkpatrick, J. Kurths, et al. Challenges in network science: Applications to infrastructures, climate, social systems and economics. European Physical Journal-Special Topics, 214(1):273, 2012.
- (3) M. San Miguel, J.H. Johnson, J. Kertesz, K. Kaski, A. Díaz-Guilera, R.S. MacKay, V. Loreto, P. Erdi, and D. Helbing. Challenges in complex systems science. The European Physical Journal Special Topics, 214:245–271, 2012.
- (4) D. Helbing. Systemic risks in society and economics. Social Self-Organization, pages 261–284, 2012.
- (5) David Lazer, Alex Sandy Pentland, Lada Adamic, Sinan Aral, Albert Laszlo Barabasi, Devon Brewer, Nicholas Christakis, Noshir Contractor, James Fowler, Myron Gutmann, et al. Life in the network: the coming age of computational social science. Science (New York, NY), 323(5915):721, 2009.
- (6) G. King. Ensuring the data-rich future of the social sciences. Science, 331(6018):719, 2011.
- (7) Jan Lorenz, Heiko Rauhut, Frank Schweitzer, and Dirk Helbing. How social influence can undermine the wisdom of crowd effect. Proceedings of the National Academy of Sciences, 108(22):9020–9025, 2011.
- (8) Kazuko Yamasaki, Takeshi Fujiwara, Kousuke Yoshizawa, Shuhei Miyake, Zeyu Zheng, Xiang Gao, and Naoko Sakurai. The complex network study of money and co2 emission flows between industrial sectors in asian countries using input-output table. In Proceedings of International Conference on Business Management & IS, number 1, 2012.
- (9) Bo Meng and Satoshi Inomata. Production networks and spatial economic interdependence: An international input-output analysis of the asia-pacific region. 2009.
- (10) Steven Rinaldi, James Peerenboom, and Terrence Kelly. Identifying, understanding, and analyzing critical infrastructure interdependencies. Control Systems, IEEE 21(6): 11-25, 2001.
- (11) S. Solomon, and M. Levy. Pioneers on a New Continent: Physics and Economics , Quantitative Finance, 3, 1, 12-16, 2003.
- (12) M. Levy. Scale-Free Human Migration and the Geography of Social Networks , Physica A, 389, 4913-4917, 2010.
- (13) P. Klimek, R. Hausmann, and S. Thurner. Empirical confirmation of creative destruction from world trade data. PLoS One, 7(6) 2012.
- (14) J. Doyne Farmer and Duncan Foley. The economy needs agent-based modelling. Nature, 460(7256):685–686, 2009.
- (15) T. Lux and F. Westerhoff. Economics crisis. Nature Physics, 5(1):2–3, 2009.
- (16) Kristin Forbes and Roberto Rigobon. Measuring contagion: conceptual and empirical issues. In International financial contagion, pages 43-66. Springer, 2001.
- (17) Kristin J Forbes and Roberto Rigobon. No contagion, only interdependence: measur- ing stock market comovements. The Journal of Finance, 57(5):2223-2261, 2002.
- (18) Z. Bodie, A. Kane, and A. J. Marcus. Investments. McGraw-Hill/Irwin, 2002.
- (19) Monica Billio, Mila Getmansky, Andrew W Lo, and Loriana Pelizzon. Econometric measures of systemic risk in the finance and insurance sectors. Technical report, National Bureau of Economic Research, 2010.
- (20) Dimitrios Bisias, Mark Flood, Andrew Lo, and Stavros Valavanis. A survey of systemic risk analytics. US Department of Treasury, Office of Financial Research, (0001), 2012.
- (21) S.V. Buldyrev, R. Parshani, G. Paul, H.E. Stanley, and S. Havlin. Catastrophic cascade of failures in interdependent networks. Nature, 464(7291):1025–1028, 2010.
- (22) J. Gao, S.V. Buldyrev, H.E. Stanley, and S. Havlin. Networks formed from interdependent networks. Nature Physics, 8(1):40–48, 2011.
- (23) Wei Li, Amir Bashan, Sergey V Buldyrev, H Eugene Stanley, and Shlomo Havlin. Cascading failures in interdependent lattice networks: The critical role of the length of dependency links. Physical Review Letters, 108(22):228702, 2012.
- (24) Roni Parshani, Sergey V Buldyrev, and Shlomo Havlin. Interdependent networks: reducing the coupling strength leads to a change from a first to second order percolation transition. Physical review letters, 105(4):048701, 2010.
- (25) A. Garas, P. Argyrakis, C. Rozenblat, M. Tomassini, and S. Havlin. Worldwide spreading of economic crisis. New journal of Physics, 12(11):113043, 2010.
- (26) F. Schweitzer, G. Fagiolo, D. Sornette, F. Vega-Redondo, A. Vespignani, and D.R. White. Economic networks: The new challenges. Science, 325(5939):422–425, 2009.
- (27) X. Huang, I. Vodenska, S. Havlin, H.E. Stanley Cascading failures in bi-partite graphs: model for systemic risk propagation. Scientific reports, 3, 2013.
- (28) C. Hidalgo, and R. Hausmann. A Network View of Economic Development. Developing Alternatives, 12(1), 5-10, 2008.
- (29) Wassily W Leontief, Erik Dietzenbacher, and Michael L Lahr. Wassily Leontief and input-output economics. Cambridge University Press, 2004.
- (30) Walter Isard. Methods of regional analysis: an introduction to regional science. Technical report, 1960.
- (31) Michael L Lahr and Erik Dietzenbacher. Input-output analysis: frontiers and extensions. Palgrave, 2001.
- (32) Thijs Ten Raa. The economics of input-output analysis. Cambridge University Press, 2005.
- (33) Ronald E Miller and Peter D Blair. Input-output analysis: foundations and extensions. Cambridge University Press, 2009.
- (34) Joost R Santos. Inoperability input-output modeling of disruptions to interdependent economic systems. Systems Engineering, 9(1):20–34, 2006.
- (35) Vladimir N Pokrovskii. Econodynamics: the theory of social production, volume 12. Springer, 2012.
- (36) Wassily Leontiev. Input output economics. Oxford University Press, 1986.
- (37) Ronald E Miller and Michael Lahr. A taxonomy of extractions. Regional Science Perspectives In Economic Analysis: A Festschrift In Memory of Benjamin H. Stevens, Michael L. Lahr, Ronald E. Miller, eds., Elsevier Science, pages 407-441, 2001.
- (38) Umed Temurshoev. Identifying optimal sector groupings with the hypothetical extraction method. Journal of Regional Science, 50(4):872-890, 2010.
- (39) Marcel Timmer and AA Erumban. The world input-output database (wiod): Contents, sources and methods. WIOD Background document available at www. wiod. org, 2012.
- (40) World input-output data table, http://www.wiod.org.
- (41) Maurice G Kendall. A new measure of rank correlation. Biometrika, 30:81-93, 1938.