Study of hadron interactions in a lead-emulsion target
Abstract
Topological and kinematical characteristics of hadron interactions have been studied using a lead-emulsion target exposed to 2, 4 and 10 GeV/ hadron beams. A total length of 60 m tracks was followed using a high speed automated emulsion scanning system. A total of 318 hadron interaction vertices and their secondary charged particle tracks were reconstructed. Measurement results of interaction lengths, charged particle multiplicity, emission angles and momenta of secondary charged particles are compared with a Monte Carlo simulation and appear to be consistent. Nuclear fragments emitted from interaction vertices were also detected by a newly developed emulsion scanning system with wide-angle acceptance. Their emission angle distributions are in good agreement with the simulated distributions. Probabilities of an event being associated with at least one fragment track are found to be greater than 50 for beam momentum GeV/ and are well reproduced by the simulation. These experimental results validate estimation of the background due to hadron interactions in the sample of decay candidates in the OPERA oscillation experiment.
C30, C32, H14, H16
1 Introduction and overview
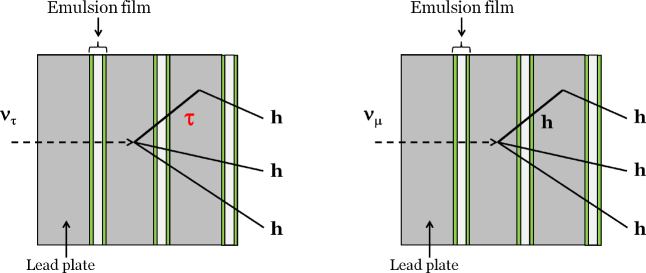
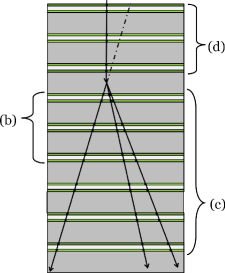
The neutrino oscillation channel is considered to be the dominant underlying process in the atmospheric neutrino sector. To prove this, the detection, in an initially pure beam, of the lepton produced in a charged current interaction is essential and provides a clear signature of the oscillation. The nuclear emulsion is the only particle detector which can detect decays by resolving their short flight path (1; 2). The ongoing oscillation experiment, OPERA (3; 4; 5), employs the emulsion cloud chamber (ECC) technique to provide both a large target mass and an excellent spatial resolution. Furthermore, appearance can be used to probe new physics, such as non-standard interactions and light sterile neutrino scenarios (6; 7). An ECC brick is composed of layers of emulsion films interleaved with heavy material plates. In the ECC brick, a secondary hadron produced in neutrino interactions could interact with the heavy materials and mimic a hadronic decay of the lepton, as shown in Figure 1. Hence such a secondary hadron interaction could be a source of background for decays. Expected number of hadron interactions as background in the sample of decay candidates is evaluated with a Monte Carlo simulation, which must be validated by experimental data 111 The momentum region relevant to the hadron interaction background in the OPERA experiment is around 2 GeV/ to 10 GeV/..
A high speed automated microscope system, S-UTS (8), has been developed to analyze particle tracks in emulsion films. This system allows to follow beam particle tracks for a long distance and measure their interactions with large statistics. In addition, a new type of automated emulsion scanning system (9) has recently been developed to detect nuclear fragments emitted with large angles.
We have studied hadron interactions in an ECC brick exposed to 2, 4 and 10 GeV/ hadron beams and have compared experimental results with those of the Monte Carlo simulation.
2 Detectors and beam exposure
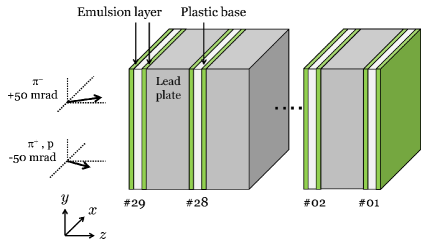
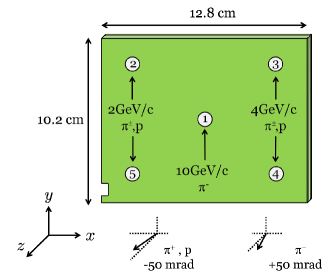
We exposed an ECC brick to 2, 4, 10 GeV/ secondary hadron beams at CERN PS-T7 beam line in May 2001. The brick was composed of 29 emulsion films (10) (44 µm thick emulsion layers on both sides of a 205 µm thick plastic base) interleaved with 28 lead plates, 1 mm thick. The brick was 12.8 cm wide, 10.2 cm high and 3.7 cm thick. It was put on a turntable and tilted in the horizontal plane by an angle with respect to the beam of mrad as shown in Figure 2. The relative beam momentum spread, , is (11). The negatively (positively) charged beams are mainly composed of pions (pions and protons) with small contamination from electrons (positrons). The exposure conditions; composition, momentum, tilt angle, spot size, mean density integrated over the spot size are summarized in Table 1.
|
| Spot | Composition | [GeV/] | Angle [mrad] | Spot size [mm] | Mean density [/cm2] |
|---|---|---|---|---|---|
| 1 | 10 | 50 | |||
| 2 | 2 | 50 | |||
| 3 | 4 | 50 | |||
| 4 | 4 | 50 | |||
| 5 | 2 | 50 |
3 Measurement and analysis method
3.1 Beam tracks
We scanned the whole area of all the emulsion films by using S-UTS. Firstly track segments, so called micro tracks, were detected on each layer of emulsion films. Positions () and slopes () of the micro tracks were measured. Base tracks were reconstructed by connecting two corresponding micro tracks (reconstructed in emulsion layers) across the plastic base. The slope acceptance of S-UTS is , where is the track angle with respect to the perpendicular of the emulsion film (the axis). The track finding efficiency, the probability to find a base track in a film, is evaluated to be by examining whether a base track exists or not in the middle of 5 consecutive films.
The positions () and slopes () of base tracks were measured with respect to the microscope’s coordinate system. After connection of base tracks among emulsion films are performed, we adjust rotation, slant, parallel translation and distance between every pair of adjacent two emulsion films, so that differences of track positions and slopes in two films are minimized. Residuals of positions and slopes are µm and respectively.
Good quality beam tracks are selected by requiring they have track segments found in all 3 most upstream films and their slope in the most upstream film is compatible with the average slope within 0.004 (1 ) where the average is calculated from all the measured beam track slopes. For further analysis to be compared with the simulation, good negatively charged pion () tracks with these conditions were selected in the area of cm2 from 1st, 4th and 5th spots 222 The 2nd and 3rd beam spots were not used because their mean densities were too high for the analysis., each corresponding to 10, 4 and 2 GeV/, as shown in Figure 2. On the other hand, positively charged hadron beams are mainly composed of s and protons, which cannot be differentiated in this momentum range. Relative abundance is not known precisely. Therefore positively charged hadrons are not easy to be compared with the simulation.
3.2 Interactions
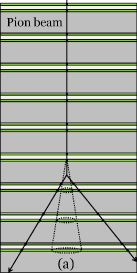
The beam tracks in the ECC brick are composed of successive track segments and some of them are missing due to inefficiency or hadron interactions. The reconstructed tracks are followed down until no track segments found in 3 consecutive films (Figure 3, Left), then a beam particle is supposed to interact at the lead plate just downstream the film where the last track segment is found. The last track segment and its extrapolated position in the film downstream the supposed interaction position, the vertex film, are visually inspected. If the last track segment is confirmed that it is a real track and no track is found in the vertex film, the interaction is then considered as confirmed. If a track exists near the predicted position in the vertex film, we measure its position and slopes manually and the beam track is followed further downstream. For beam tracks escaping from the downstream face of the brick, a straight line fit is applied to detect a kink topology somewhere in the brick. If a kink with mrad is found, it is also considered as an interaction.
3.3 Secondary particles
Each confirmed interaction is subject to the secondary particle track search inside the area of cm2 in 6 downstream films of the interaction vertex. Secondary particle tracks are sought under the following conditions, as shown in Figure 3 right.
The angular acceptance of secondary particle track search is , which is limited by the ordinary S-UTS performance. For a secondary particle candidate found in at least 1 of the first 3 downstream films including the vertex film, we require the minimum distance of the candidate track with respect to the parent beam track to be less than () µm taking into account both the measurement error and the error due to the multiple Coulomb scattering (MCS) of the tracks, where the (µm) is the distance of the position from the nearest emulsion layer. The scanning data have a lot of fake tracks due to low energy Compton electrons and random noises. In order to reject such fake tracks, we demand the condition that base tracks exist in out of the 6 downstream films and they can be reconstructed as a single secondary track. If base tracks matching with the secondary track candidate exist in 2 films out of the 3 upstream films, it is considered as a passing-through track which is not relevant to the interaction vertex.
Once a secondary track candidate is found, it is checked by visual inspection in 3 films: 1 upstream and 2 downstream films of the interaction vertex, in order to eliminate the possibility of a passing-through track or an electron track originated from conversion in a downstream lead plate. The efficiency of the secondary particle track search was evaluated to be 99.2% by applying the S-UTS track finding efficiency to the conditions in the whole procedure described above.
|
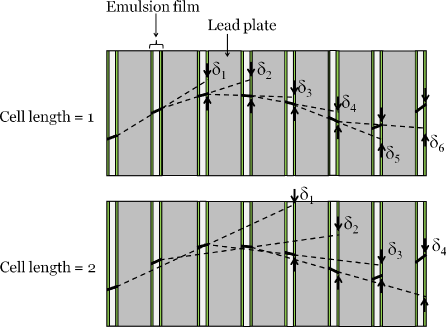
Momenta of secondary tracks are estimated by measuring their multiple Coulomb scattering in the brick. There are two methods in the multiple scattering measurements, the coordinate method (12) and the angular method (13). We use the coordinate method because it is more accurate when small multiple scattering signal is expected although it requires precise alignment among the emulsion films. We define the second difference in one projection by:
| (1) |
where the base track position at th film () is (), as shown in Figure 4. A similar expression can be written in the other projection, (), and data in the two projections are used as independent measurements of the second difference. The multiple scattering signal is related to the momentum by (14; 15):
| (2) |
where , , and are the particle velocity, distance traversed, and radiation length in the material respectively. On the other hand, it is measured from second differences and their errors :
| (3) |
where means the average over the available data. Since the multiple scattering measurement is statistical estimation of the particle momentum, it needs a sufficient number of data. To obtain reliable estimation, we apply the coordinate method only when at least 14 emulsion films are available for the position measurements.
3.4 Nuclear fragments
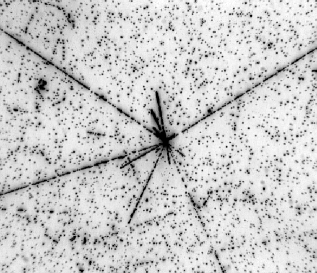
If a secondary particle has a value of , the particle is observed as a heavily ionizing track or a nuclear fragment, as shown in Figure 5. Nuclear fragments emitted from hadron interactions have also been sought by a newly developed automatic emulsion scanning system (9). The acceptance to the track slopes are much improved up to . Since nuclear fragments are emitted almost isotropically, the new scanning system with a wider angular acceptance is suitable in order to detect the nuclear fragments with a good efficiency. The system has a large field of view, µm2, and has a track finding efficiency of practically 100% for nuclear fragments (9).
Searched area is defined as mm2 of both upstream and downstream films of each interaction vertex and its angular acceptance is . Since the nuclear fragments have low energy (few tens of MeV), they are expected to suffer large multiple scattering. Therefore the loose condition, µm is imposed. Here the “Impact Parameter” is defined as the perpendicular distance between the path of a track and the vertex which is reconstructed by the beam and secondary tracks. The (µm) is the distance between the vertex and the nearest emulsion layer where the nuclear fragment track is measured. A narrower condition, µm, is imposed in the case of 10 GeV/ interactions because the beam density is high. To remove fake tracks, each found track candidate is required to be a base track and is confirmed by visual inspection.
4 FLUKA simulation
A FLUKA 333The FLUKA version 2011.1 was used in this study. (16; 17) based Monte Carlo simulation was employed for comparison. 30,000 negatively charged beam pions each were generated for momentum of = 2, 4 and 10 GeV/. The generated beam pions, of which directions were spread using observed distributions in this experiment, entered the brick. Some of them interacted with the brick material according to their cross sections and produced secondary particles including nuclear fragments by using the PEANUT model (18) of hadron interactions. Exposed density, position and slope measurement errors, detection efficiency of base tracks were adjusted to be the same as real experimental conditions.
Then the simulation analysis has been performed by the same methods and tools that are used for the real data. Secondary particles with () are defined as relativistic particles (non-relativistic particles, i.e. nuclear fragments).
5 Results and discussion
5.1 Interaction length
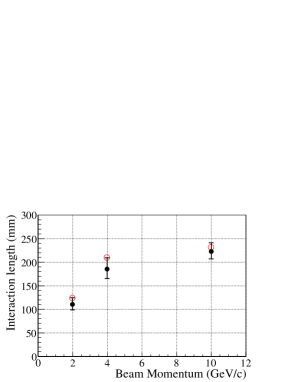
In total, 318 interactions (77 for 2 GeV/, 68 for 4 GeV/, 173 for 10 GeV/) have been found from the interaction measurements. Out of the found interactions of 2 GeV/ (10 GeV/), one (three) took place in the base of a film and one (one) in an emulsion layer of a film. All the others occurred in the lead plates. The statistics of the interaction measurements are summarized in Table 2 and evaluated interaction lengths are also presented. The interaction length, , is calculated as follows:
| (4) |
where is the thickness of a lead plate and an emulsion film ( µm), is the number of found interactions and is the sum of the numbers of followed tracks in all analyzed films. Figure 6 shows momentum dependence of the interaction length, which is in good agreement with the Monte Carlo simulation within the statistical errors.
| [GeV/] | 2 | 2 (MC) | 4 | 4 (MC) | 10 | 10 (MC) |
|---|---|---|---|---|---|---|
| Tracks | 584 | 11301 | 913 | 9260 | 2205 | 13746 |
| Total [mm] | 8506 | 191794 | 12620 | 162009 | 38534 | 240922 |
| Interactions | 77 | 1544 | 68 | 773 | 173 | 1040 |
| [mm] |
5.2 Topological characteristics
The multiplicity and kink angle distributions of relativistic charged secondary particles are shown in Figure 7. Topological characteristics are summarized in Table 3 and they are compared with those of simulated data. As the beam momentum increases, the average number of secondary particles becomes larger. In the case of inelastic interactions, the higher is the momentum, the smaller is the emission angle. This tendency can be seen for 4 GeV/ and 10 GeV/ interactions, while it is not so for 2 GeV/ interactions and others. This might be explained by the fact that fraction of elastic interactions is larger in 2 GeV/ interactions (14). For the average multiplicity , the agreement between the experimental data and the simulated data is not so good in 2 GeV/ interactions. The other experimental data agree well with the simulation data.
| [GeV/ ] | 2 | 2 (MC) | 4 | 4 (MC) | 10 | 10 (MC) |
|---|---|---|---|---|---|---|
| Events | 77 | 1544 | 68 | 773 | 173 | 1040 |
| 0.48 | 0.65 | 0.93 | 1.03 | 2.45 | 2.41 | |
| 1-prong events | 33 | 915 | 29 | 372 | 26 | 216 |
| [rad] | 0.13 | 0.13 | 0.23 | 0.21 | 0.20 | 0.15 |
| 3-prong events | 0 | 3 | 2 | 32 | 44 | 246 |
| [rad] | - | 0.36 | 0.32 | 0.30 | 0.27 | 0.24 |
Ginwidth=


5.3 Nuclear fragment association
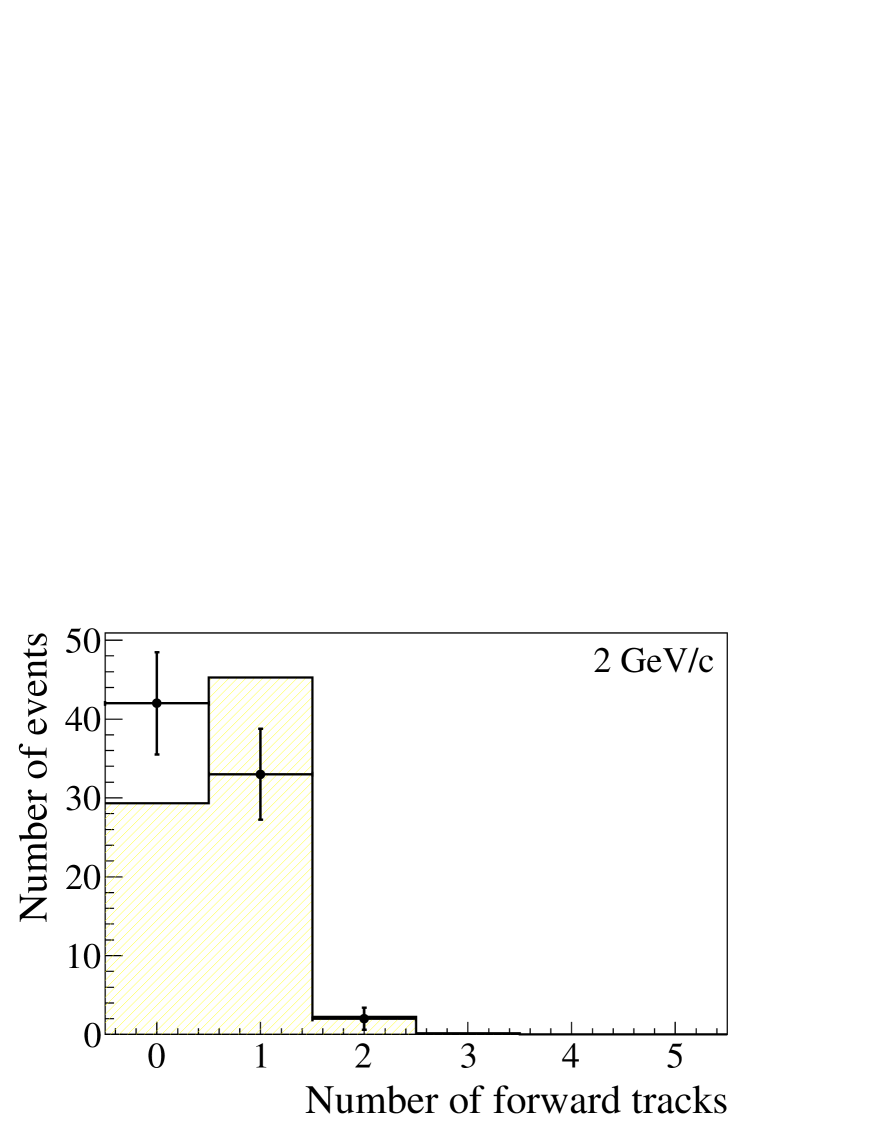
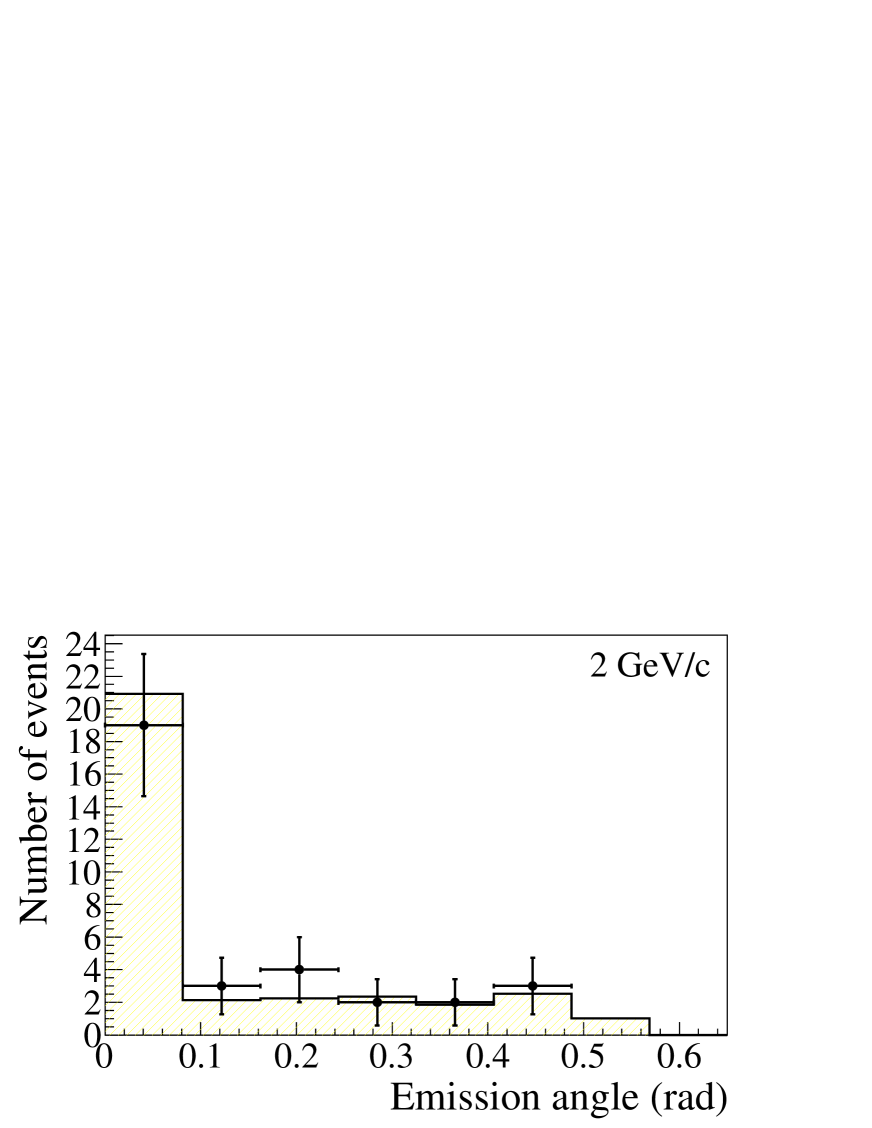
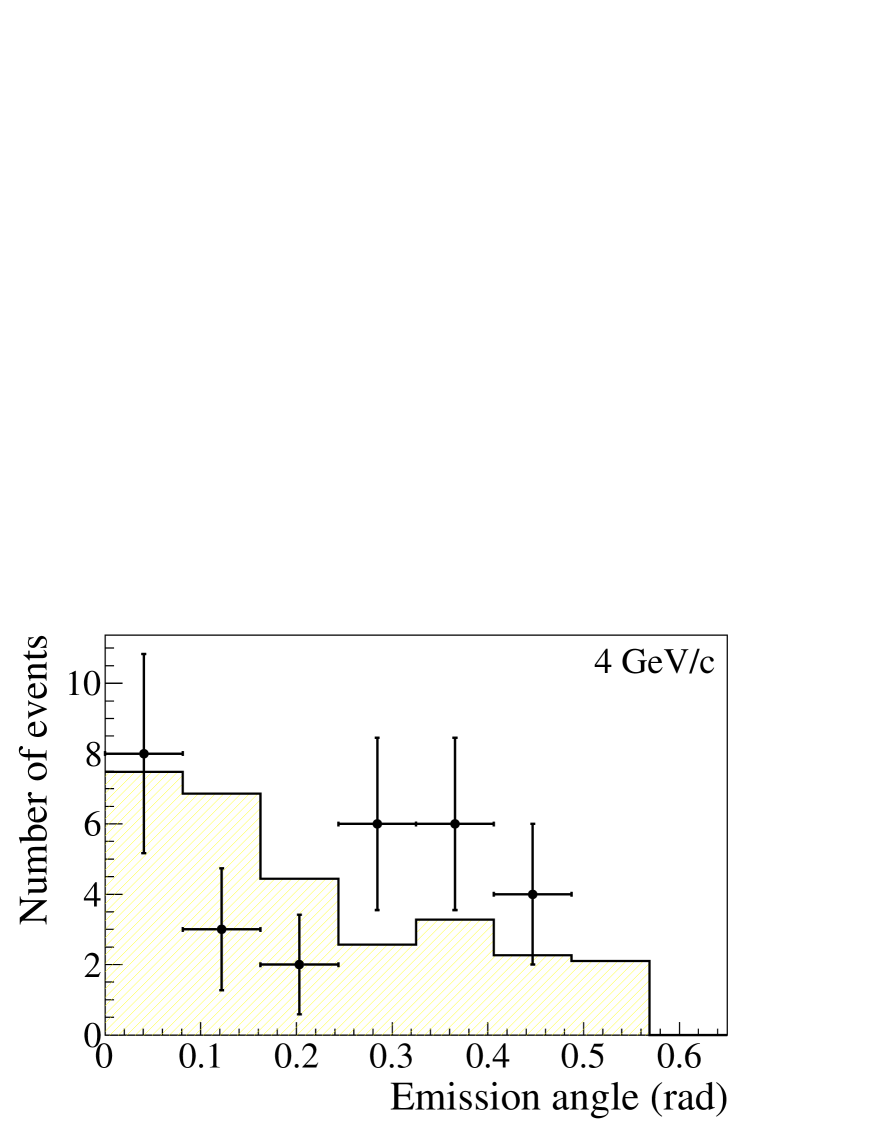
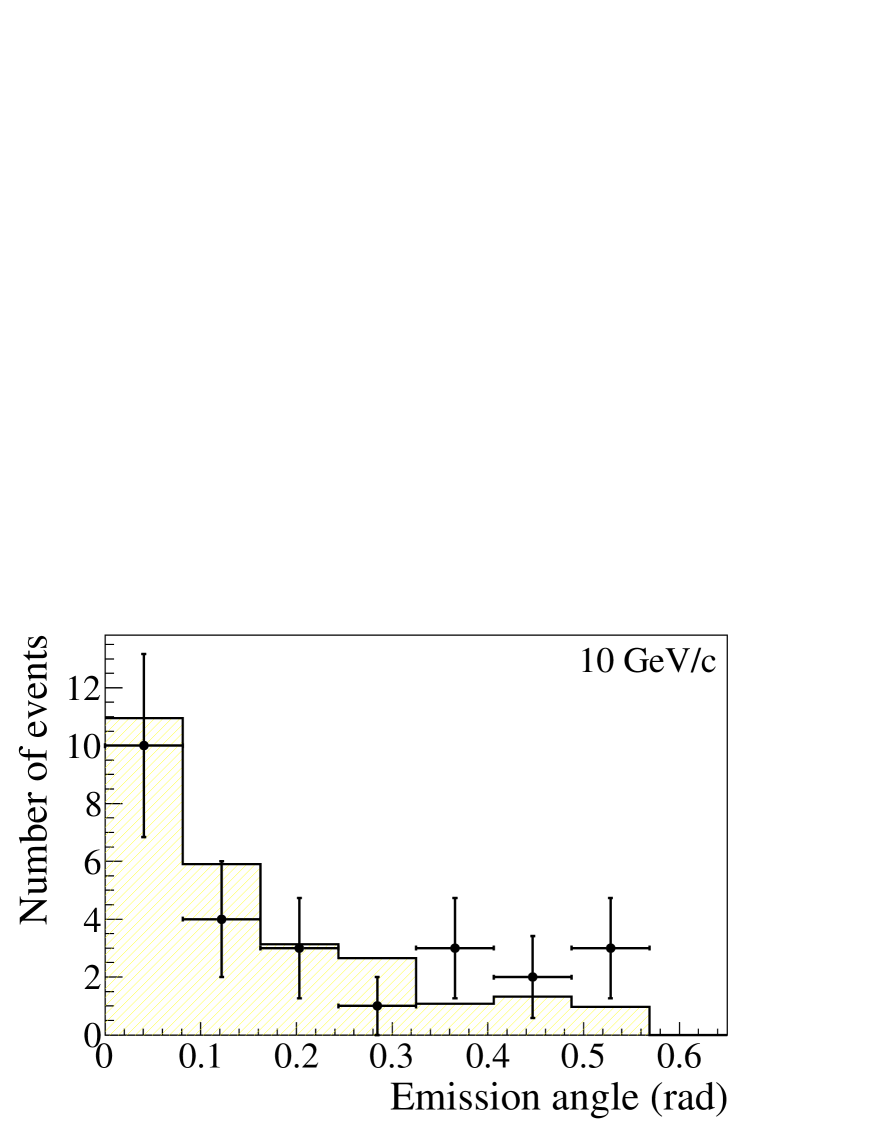
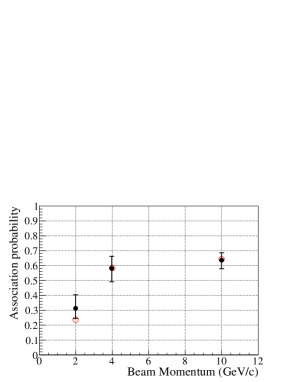
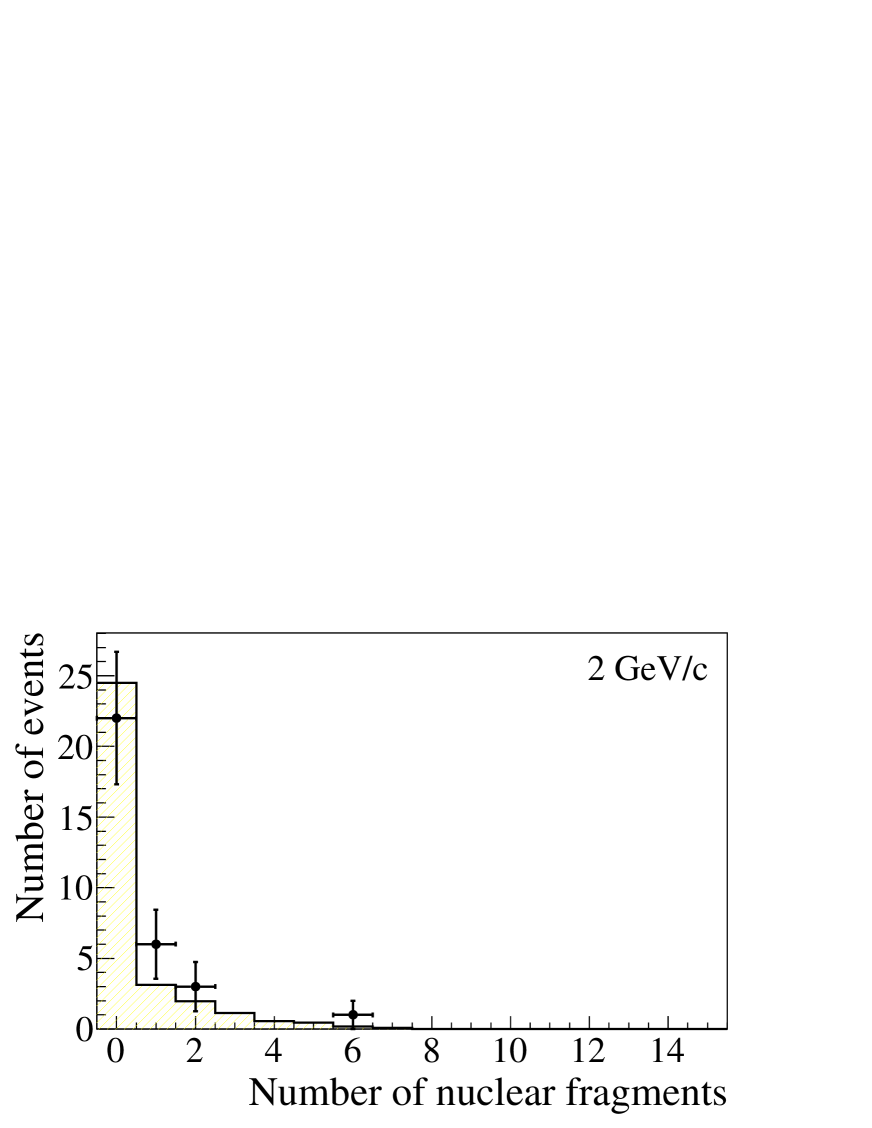
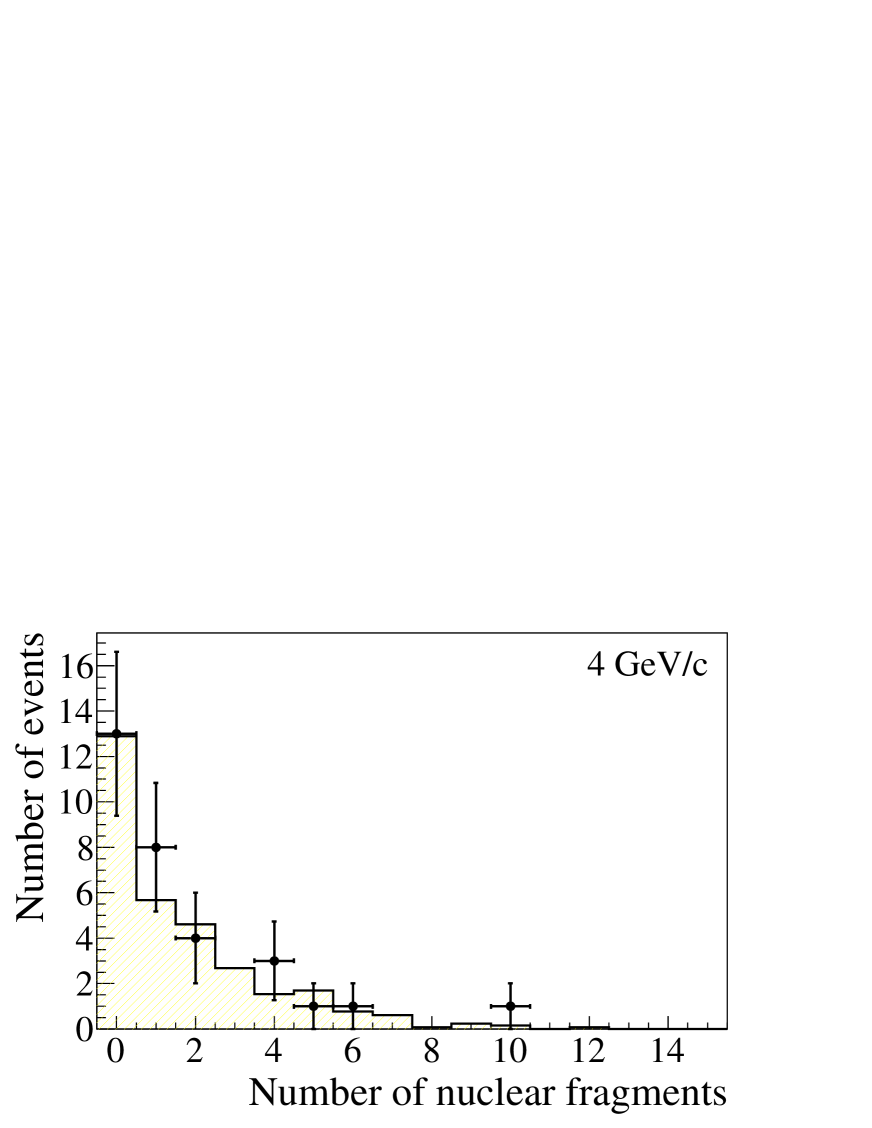
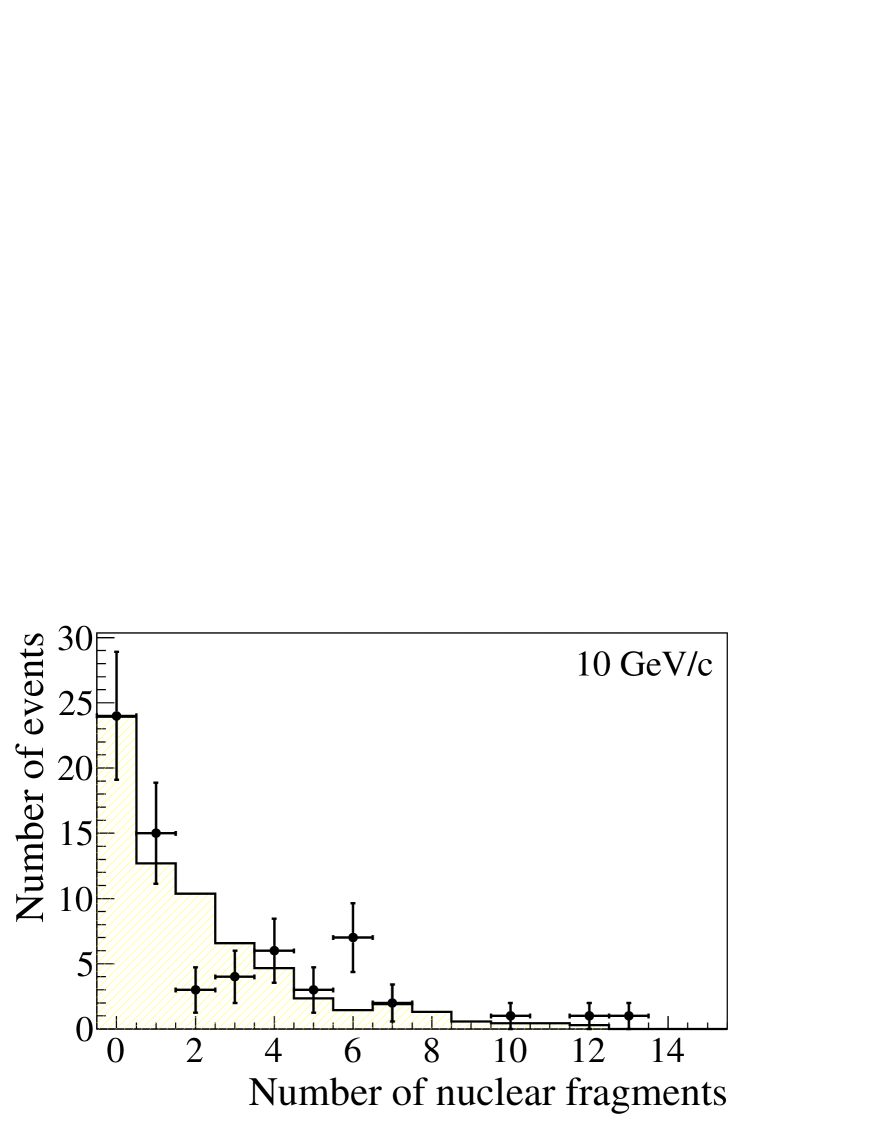
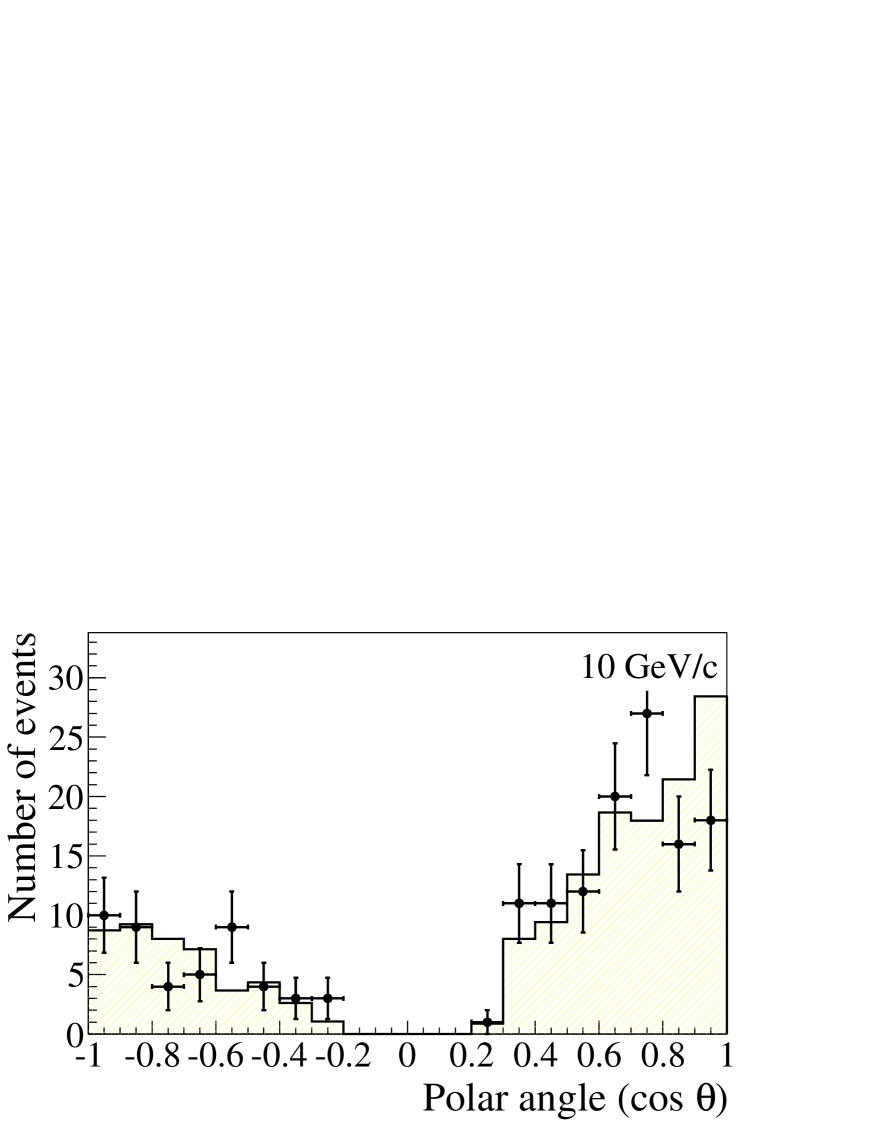
We present measurement results of nuclear fragments for 1-prong and 3-prong events, which are relevant to topologies of the hadronic decay, and corresponding results for simulated data in Table 4. Here numbers of events associated with at least one heavily ionizing particle, pointing to the vertex, found in either the upstream film or the downstream film of the vertex are listed. The probability is the fraction of fragment associated events in the 1-prong or 3-prong events. Figure 8 shows the association probability as a function of the beam momentum, where data of 1-prong and 3-prong events are merged, together with simulation results. At least one nuclear fragment particle is associated with about a half of events for beam momentum greater than 4 GeV/. The experimental data of the fragment association probability are well reproduced by the simulation with differences less than 10%. The number of background nuclear fragment tracks was estimated to be 0.035 tracks/event by scanning around dummy vertices with the same conditions. Figure 9 shows good agreement in multiplicity and polar angle distributions of nuclear fragments between experimental data (dots with error bars) and simulated data (histogram).
| [GeV/ ] | 2 | 4 | 10 | |||
|---|---|---|---|---|---|---|
| Prong | 1 | 3 | 1 | 3 | 1 | 3 |
| Events | 32 | 0 | 29 | 2 | 25 | 41 |
| Fragment associated | 10 | 0 | 16 | 2 | 15 | 27 |
| Probability [%] | - | |||||
| Events (MC) | 908 | 0 | 372 | 32 | 214 | 246 |
| Fragment associated (MC) | 213 | 0 | 219 | 17 | 127 | 169 |
| Probability (MC) [%] | - | |||||
Ginwidth=


5.4 Kinematical characteristics
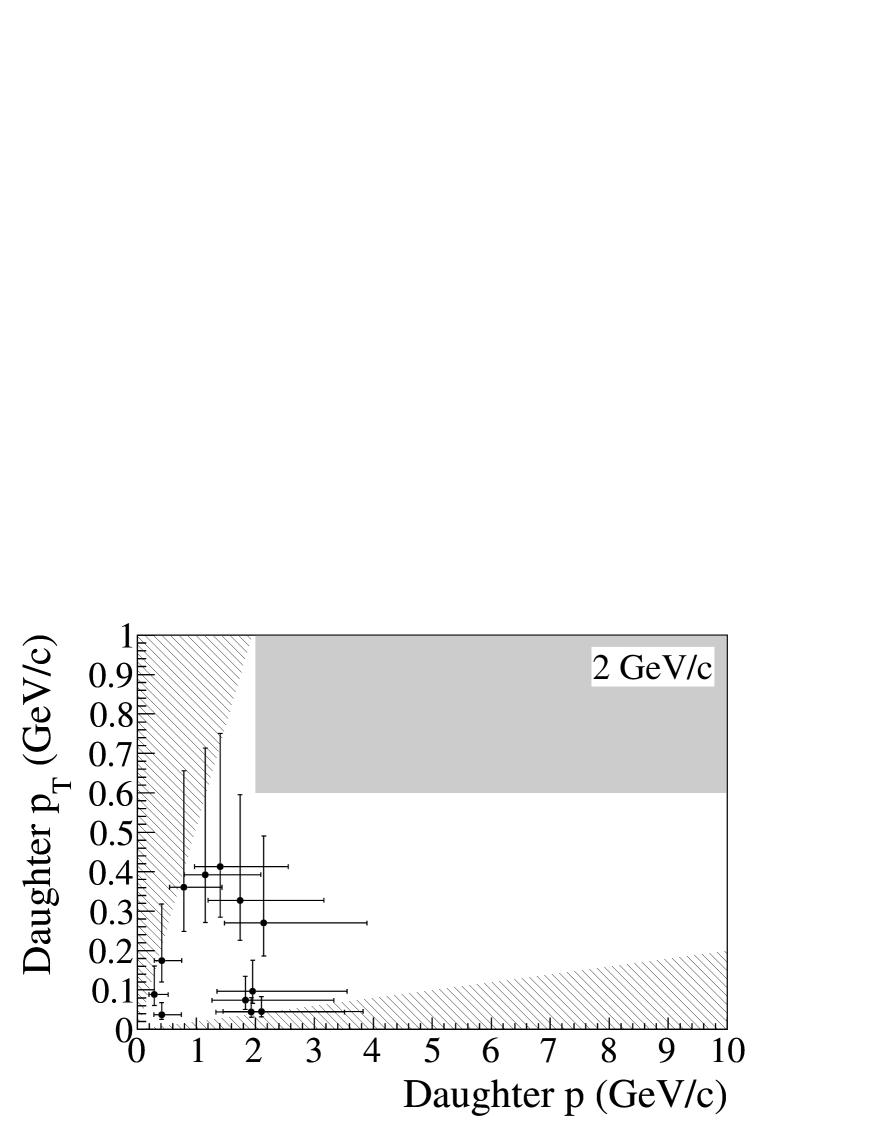
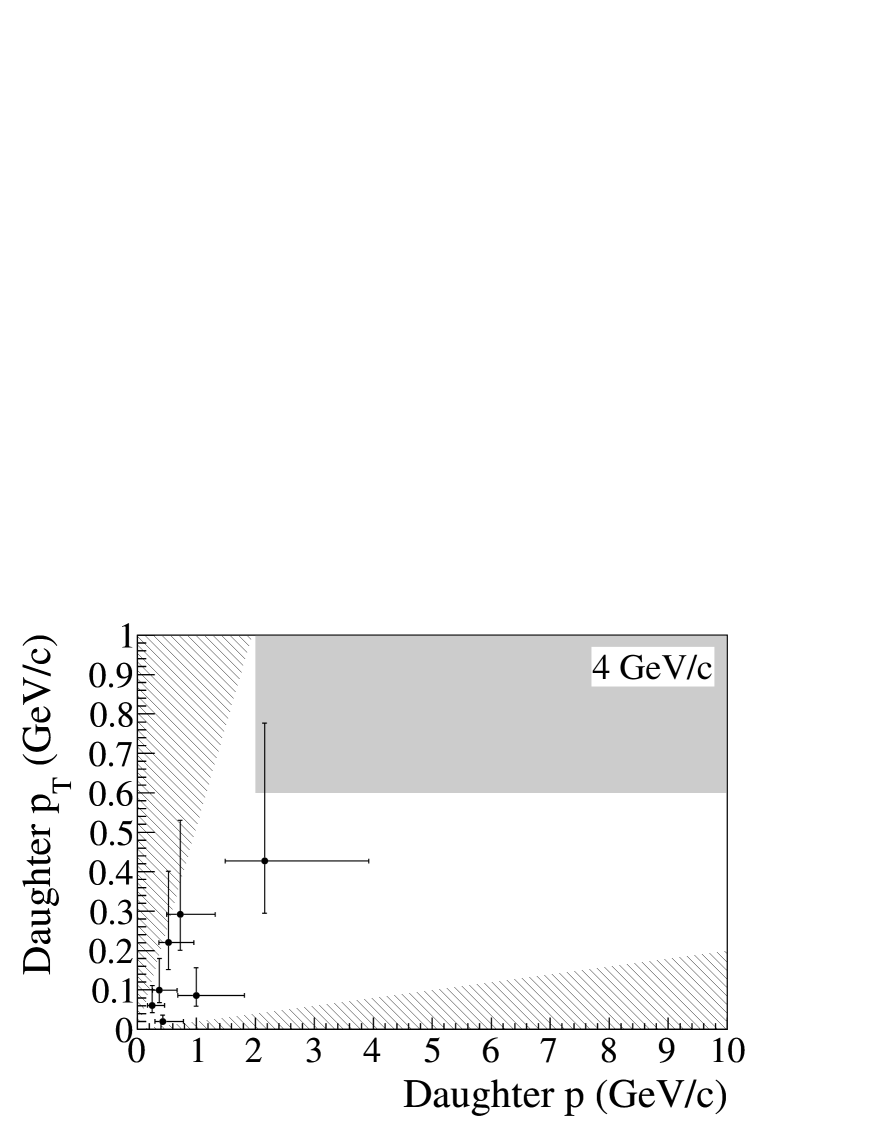
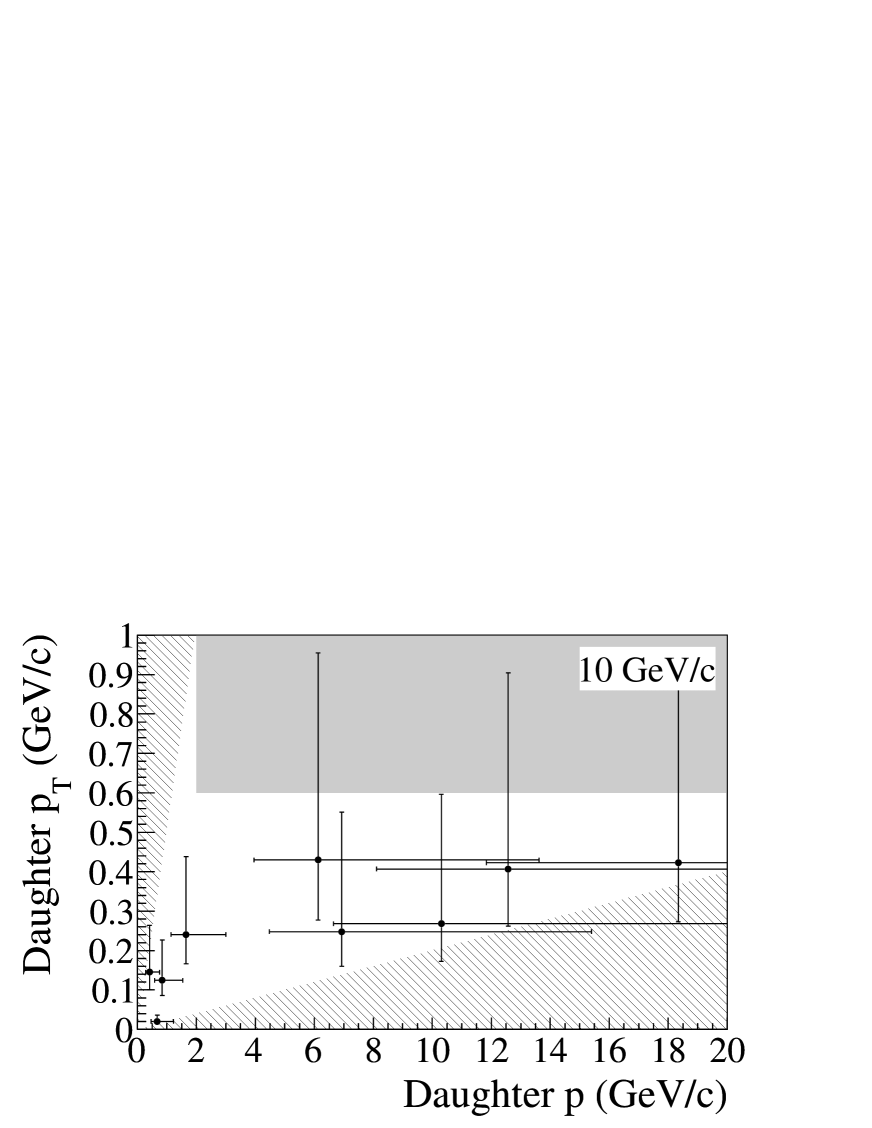
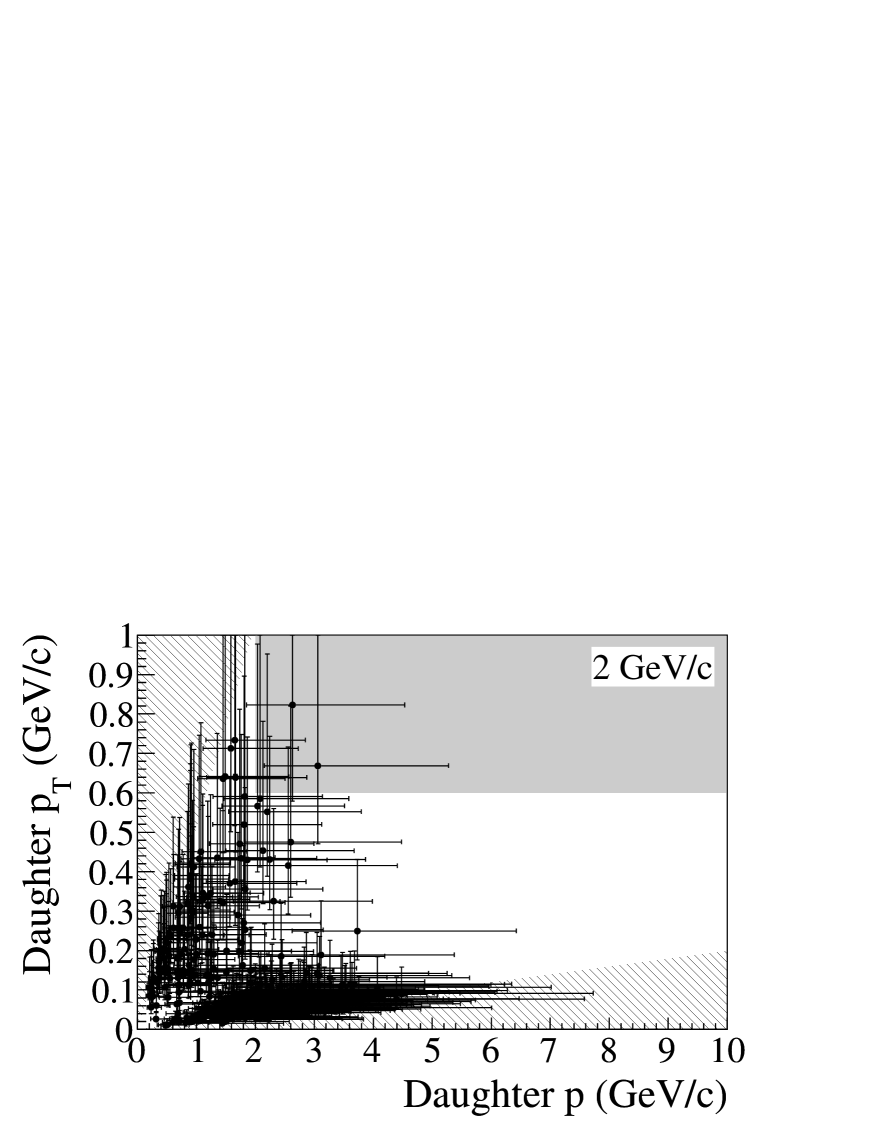
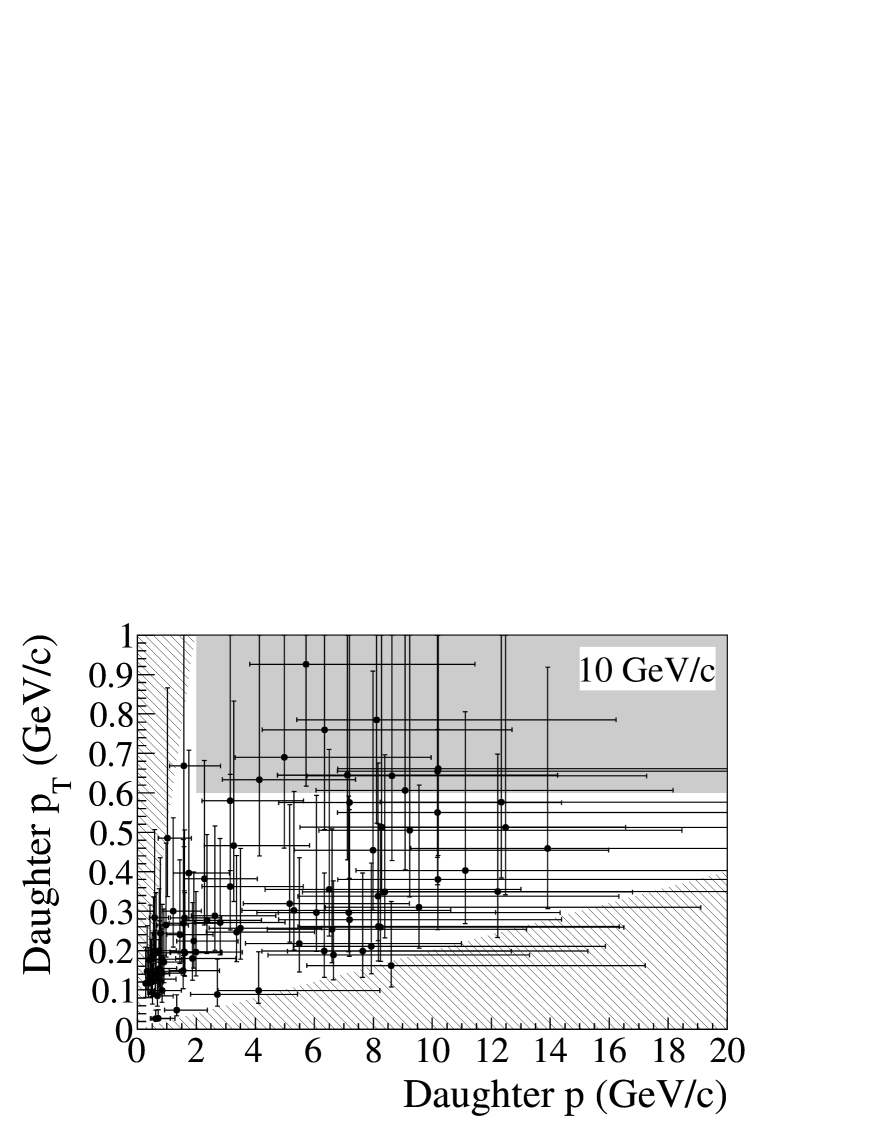
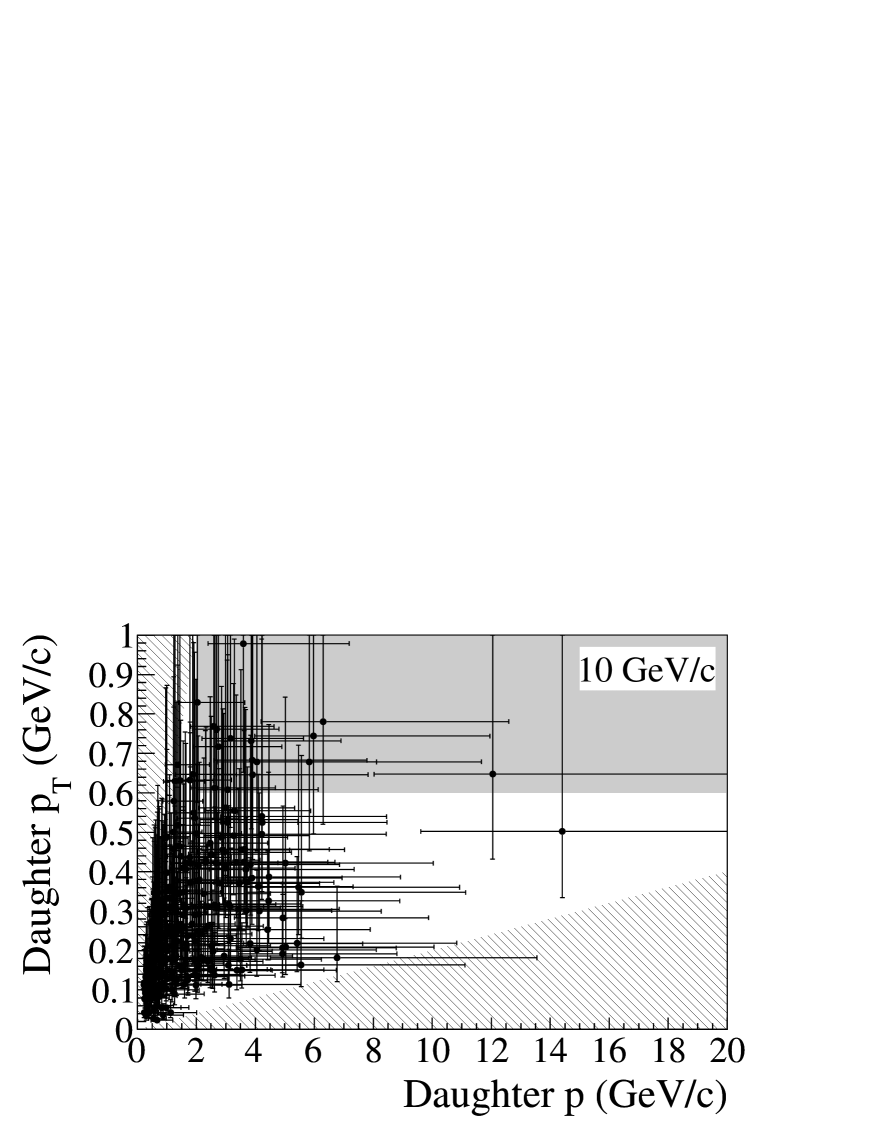
In OPERA, for candidates decaying into a single charged hadron, kinematical selection cuts; GeV/ and GeV/ are required (19; 20) 444 The cut on is 0.3 GeV/ if there is a converted attached to the secondary vertex. In this analysis, no attempt is made to find s because the numbers of lead plates and emulsion films are limited.. Scatter plots of versus of the secondary particles of 1-prong hadron interactions are shown together with those of simulated data in Figure 10. For comparison, scatter plots of versus of the secondary particles of 10 GeV/ 3-prong interactions are also shown in Figure 11. Statistics are limited because only secondary tracks for which more than 14 lead plates are available as scattering materials are able to be momentum-reconstructed. In this condition, error of the momentum measurement was estimated to be at by using the multiple scattering measurements of beam pions with known momentum, i.e. 2, 4, 10 GeV/, under the same condition. In Figure 10, the dark area defines the domain in which decay candidates are selected and the hatched area defines the domain rejected by the selection cuts ( rad) and S-UTS angle acceptance (). Table 5 summarizes the fraction of secondary particles in the selection domain for the events in which secondary particle momenta are measurable. Comparisons between experimental and simulated data show generally good agreement, however the final statistics of the tracks in the selection domain are not sufficient to obtain quantitative results on how good the agreement is. We will therefore consider an alternative method to estimate the goodness of the agreement in the next subsection.
Ginwidth=

Ginwidth=

| [GeV/ ] | 2 | 4 | 10 | |||
|---|---|---|---|---|---|---|
| Prong | 1 | 3 | 1 | 3 | 1 | 3 |
| Tracks measurable | 12 | 0 | 7 | 0 | 10 | 54 |
| Tracks in selection domain | 0 | 0 | 0 | 0 | 1 | 1 |
| Fraction [%] | - | - | ||||
| Tracks measurable (MC) | 393 | 1 | 127 | 34 | 93 | 299 |
| Tracks in selection domain (MC) | 2 | 0 | 9 | 0 | 13 | 19 |
| Fraction (MC) [%] | ||||||
5.5 Goodness of agreement between the experimental and the simulated data
The numbers of secondary particles in the domain where decay candidates are selected are too few to evaluate the goodness of the agreement between the experimental and the simulated data. So we try to widen the selection condition for comparison. We select 1-prong hadron interaction events with 0.30, 0.15 and 0.06 rad for 2 GeV/, 4 GeV/ and 10 GeV/, respectively. These angles correspond to GeV/.
There are some events in the domains defined by these conditions, as shown in Table 6. We use these samples to check the agreement between the experimental and the simulated data.
In Table 6, numbers of simulated data (MC) were normalized to the total track length followed for each beam momentum in this experiment. Then the statistical error and the relative difference are defined as follows,
| (5) | |||||
| (6) |
where and are numbers of the experimental data and the simulated data respectively. It is found that all the relative differences are less than 30% and can be understood within the statistical errors although statistics is not sufficient for 2 GeV/. We therefore conclude that the agreement between the experimental and the simulated data has been confirmed at the 30% level for beam momentum GeV/.
| [GeV/ ] | 2 | 2 (MC) | [] | 4 | 4 (MC) | [] | 10 | 10 (MC) | [] |
|---|---|---|---|---|---|---|---|---|---|
| Events | 77 | 68.5 | 12 | 68 | 60.2 | 13 | 173 | 166.0 | 4 |
| 1-prong | 33 | 40.6 | -19 | 29 | 29.1 | 0 | 26 | 34.6 | -25 |
| After cut | 6 | 7.5 | -20 | 19 | 15.3 | 24 | 17 | 23.7 | -28 |
6 Conclusions
Topological and kinematical characteristics of hadron interactions have been studied by using an ECC brick exposed to 2, 4, 10 GeV/ pion beams. High speed automated microscope system was employed to analyze the nuclear emulsion films. A total of 318 hadron interactions were found and reconstructed by following 60 m tracks in the brick. Secondary charged particle tracks from interaction vertices were also followed and reconstructed. Charged particle multiplicity of each event and emission angle of each secondary particle were measured and their distributions were found to be in good agreement with a FLUKA Monte Carlo simulation. Nuclear fragments were also searched for by newly developed automated microscope system with a wide view. We measured the probability for the interaction vertices to be associated with nuclear fragments and found it to be greater than 50% for beam momentum GeV/. The experimental data of the fragment association probability are well reproduced by the simulation with differences less than 10%. When possible, the momentum of the secondary particle was measured by using the coordinate method. Fractions of 1-prong and 3-prong hadron interactions being in the domain where hadron decays are selected are measured and found to be consistent with the simulation at the 30% level for beam momentum GeV/. We conclude that the FLUKA based simulation reproduces well the experimental distributions of 2, 4, and 10 GeV/ interactions in the ECC brick. This result can be applied in neutrino oscillation experiments to evaluate the hadronic background contaminations on lepton decays. Since the background contaminations originate from all charged hadron interactions, mainly , and proton interactions, positively charged hadron interactions should also be investigated. This will be the subject of further studies.
Acknowledgments
We wish to thank P. Vilain for his careful reading of the manuscript and for his valuable comments. We wish to express our gratitude to the colleagues of the Fundamental Particle Physics Laboratory, Nagoya University for their cooperation. For the beam exposure, we gratefully acknowledge the support of the PS staff at CERN. We warmly acknowledge the financial support from the Japan Society for the Promotion of Science (JSPS), the Promotion and Mutual Aid Corporation for Private Schools of Japan, and Japan Student Services Organization.
References
- (1) K. Kodama et al., (DONUT Collaboration), \PLB504,218,2001
- (2) K. Kodama et al., (DONUT Collaboration), Nucl. Instrum. Methods Phys. Res., Sect. A 493, 45 (2002).
- (3) M. Guler et al., (OPERA Collaboration), An appearance experiment to search for oscillations in the CNGS beam: experimental proposal, CERN-SPSC-2000-028, LNGS P25/2000 (2000).
- (4) M. Guler et al., (OPERA Collaboration), Status Report on the OPERA Experiment, CERN/SPSC 2001-025, LNGS-EXP 30/2001 add. 1/01 (2001).
- (5) R. Acquafredda et al., (OPERA Collaboration), J. Instrum., 4, P04018 (2009).
- (6) O. Yasuda, arXiv:1211.7175 [hep-ph].
- (7) T. Ota, J. Phys. Conf. Ser., 408, 012021 (2013).
- (8) K. Morishima, T. Nakano, J. Instrum., 5, P04011 (2010).
- (9) T. Fukuda et al., J. Instrum., 8, P01023 (2013).
- (10) T. Nakamura et al., Nucl. Instrum. Methods Phys. Res., Sect. A 556, 80 (2006).
-
(11)
D.J. Simon et al., SECONDARY BEAMS FOR TESTS IN THE PS EAST EXPERIMENTAL AREA,
PS/PA-EP Note 88-26 (1988), PS/PA/Note 93-21 (1993),
http://ps-div.web.cern.ch/ps-div/Reports/PA9321/. - (12) K. Kodama et al., Nucl. Instrum. Methods Phys. Res., Sect. A 574, 192 (2007).
- (13) N. Agafonova et al., (OPERA Collaboration), New J. Phys., 14, 013026 (2012).
- (14) J. Beringer et al. (Particle Data Group), \PRD86,010001,2012
- (15) M. Kimura et al., Nucl. Instrum. Methods Phys. Res., Sect. A 711, 1 (2013).
- (16) A. Ferrari, P.R. Sala, A. Fassò, and J. Ranft, FLUKA: a multi-particle transport code, CERN-2005-10 (2005), INFN/TC_05/11, SLAC-R-773.
- (17) G. Battistoni, S. Muraro, P.R. Sala, F. Cerutti, A. Ferrari, S. Roesler, A. Fassò, J. Ranft, The FLUKA code: Description and benchmarking, Proceedings of the Hadronic Shower Simulation Workshop 2006, Fermilab 6–8 September 2006, M. Albrow, R. Raja eds., AIP Conference Proceeding 896, 31-49, (2007).
- (18) F. Ballarini et al., Nuclear models in FLUKA: present capabilities, open problems and future improvements, SLAC-PUB-10813 (2004).
- (19) N. Agafonova et al., (OPERA Collaboration), \PLB691,138,2010
- (20) N. Agafonova et al., (OPERA Collaboration), New J. Phys., 14, 033017 (2012).