Nuclear magnetic resonance inverse spectra of InGaAs quantum dots: Atomistic level structural information
Abstract
A wealth of atomistic information is contained within a self-assembled quantum dot (QD), associated with its chemical composition and the growth history. In the presence of quadrupolar nuclei, as in InGaAs QDs, much of this is inherited to nuclear spins via the coupling between the strain within the polar lattice and the electric quadrupole moments of the nuclei. Here, we present a computational study of the recently introduced inverse spectra nuclear magnetic resonance technique to assess its suitability for extracting such structural information. We observe marked spectral differences between the compound InAs and alloy InGaAs QDs. These are linked to the local biaxial and shear strains, and the local bonding configurations. The cation-alloying plays a crucial role especially for the arsenic nuclei. The isotopic line profiles also largely differ among nuclear species: while the central transition of the gallium isotopes have a narrow linewidth, those of arsenic and indium are much broader and oppositely skewed with respect to each other. The statistical distributions of electric field gradient (EFG) parameters of the nuclei within the QD are analyzed. The consequences of various EFG axial orientation characteristics are discussed. Finally, the possibility of suppressing the first-order quadrupolar shifts is demonstrated by simply tilting the sample with respect to the static magnetic field.
pacs:
75.75.-c, 76.60.Gv, 76.60.PcI Introduction
The valuable expertise gained on nuclear spins in quantum dots (QDs) over the past decade has revolutionized the traditional research on semiconductor physics.urbaszek13 ; chekhovich13 ; taylor03 ; deng05 ; lai06 ; hogele12 ; yang13 ; economou14 ; marohn95 ; gammon97 ; kikkawa00 ; makhonin10 ; kuznetsova14 ; munsch13 ; chekhovich12 ; makhonin11 ; dzhioev07 ; huang10 ; bulutay12 ; verbin12 ; fallahi10 ; hogele12 ; chekhovich14 For instance, solid-state quantum memories, a vital component for quantum information technologies, count on the long coherence times of nuclear spins.taylor03 In addition to storing the quantum state, nuclear spins potentially can act as the central processing unit as in ensemble computingcory97 ; vandersypen01 that can also be extended to quadrupolar nuclei,yusa05 or, they can present an ideal testbed for quantum control as an integral part of an exciton-nuclei feedback loop.lai06 ; hogele12 ; yang13 ; economou14
Another emerging utility of QD nuclear spins is for the materials science as a targeted nanoscale diagnostic tool. On this front, there have been recent advances in analytical techniques such as cross-sectional scanning tunneling microscopy,bruls02 coherent x-ray diffraction-based three-dimensional mapping,kegel00 ; yacoby02 and the atom probe tomography.kelly07 Routinely, the nuclear magnetic resonance (NMR) had been one of the preferred choices in identifying below the parts-per-million-level concentration of rare constituents.levitt-book This, however works on macroscopic samples still of molar sizes. When it comes to probing a single QD, the applicability of the conventional NMR is hampered because of the insufficient equilibrium magnetizations within such small volumes. Added to this, is the low sensitivity inherent in detection by the magnetic induction of precessing magnetization.marohn95 If instead, the already proven optical orientation framework is pursued, the electron spin can efficiently polarize the nuclear spins within the QD through the contact hyperfine interaction.paget84 This nuclear polarization, known as the Overhauser field, acts back on the exciton and shifts its energy as it recombines, leaving a trace on the photoluminescence (PL). Overall, this makes up the recipe for the NMR of a single QD, which is termed as the optically detected NMR (ODNMR).gammon97 For the detection, it relies on the measurement of either the Overhauser field-shifted excitonic PL with a eV-resolution,gammon97 or the Faraday rotation in the reflected probe beam with a sensitivity below 1 mrad.kikkawa00
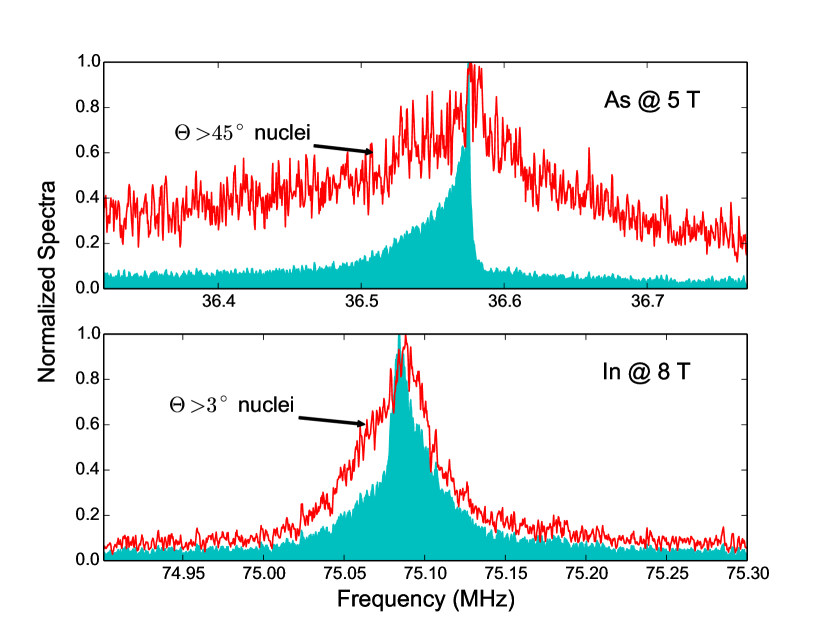
It is also desirable to use ODNMR on the widely accessible self-assembled QDs (SAQDs). However, an issue that is prevalent in SAQDs is that they inherently possess an inhomogeneous and anisotropic strain.petroff03 In a III-V semiconductor crystal lattice, such a strain field causes local electric field gradients (EFG) with which a quadrupolar spin- nucleus, i.e., with , interacts because of its electric quadrupole moment.cohen57 ; das58 This quadrupole interaction (QI) splits the nuclear spin degeneracy even in the absence of an external magnetic field, and severely broadens the resonances. This has posed a challenge for employing standard ODNMR in SAQDs giving rise to poor signal to noise ratio. Very recently the problem has been alleviated by introducing a so-called inverted radio frequency (rf) excitation scheme.chekhovich12 This increased substantially the fraction of nuclei participating in the Overhauser shift. A breakthrough not only for the atomistic level structural information on strained SAQDs, but also for the quantum information technologies. This is thanks to the crucial structural information it can supply, much needed both to engineer a noise-free nuclear spin bath and also to perform a coherent control over the Bloch sphere of relatively small number of nuclear spins.makhonin11 ; chekhovich14
After this successful experimental demonstration of the ODNMR inverse spectra on strained QDs,chekhovich12 its full potential awaits to be explored on a theoretical level. Therefore, the aim of this work is to undertake a computational assessment, choosing InGaAs QDs as the test case. Primarily, we would like to address what kind of atomistic level information can possibly be extracted by the technique, and where to look for these. In particular we give special importance to the central transition lineshape as this is experimentally the most conspicuous spectral feature. Moreover, it carries important clues about the internal structure of the QD. Thus, we perform a detailed search over the parameter space of the inverse spectra technique. This sheds light on the line profiles and resolution trade offs, as well as experimentally more impracticable aspects such as the dependence of the sample orientation with respect to the magnetic field. By comparing a binary InAs QD with an identical-shape alloy In0.2Ga0.8As counterpart, we uncover key fingerprints of the alloy composition. Furthermore, we explain the basis of these behaviors in terms of available atomistic configurations. With this insight, we intend to unfold the prospects of the inverse spectra technique as a tool to resolve atomistic-level variations in strained nanostructures.
The paper is organized as follows: In Sec. II we present the theoretical setting of our atomistic analysis. In Sec. III we provide information about our benchmark cases, followed by our results. In Sec. IV we conclude by itemizing our major findings. In the interest of a lucid presentation, we defer additional technical supporting materials and figures to a number of appendixes. Appendix A discusses nuclear polarizations, and more specifically why it is harder to polarize the arsenic nuclei in a strained environment. Appendix B contains EFG-related histograms for the alloy and the compound QDs. In Appendix C we consider the role of specific quadrupole parameters on the lineshape. The last appendix illustrates the effects of individual EFG parameters on spectral transitions of a single nucleus to authenticate some of the assertions in the main text.
II Theory
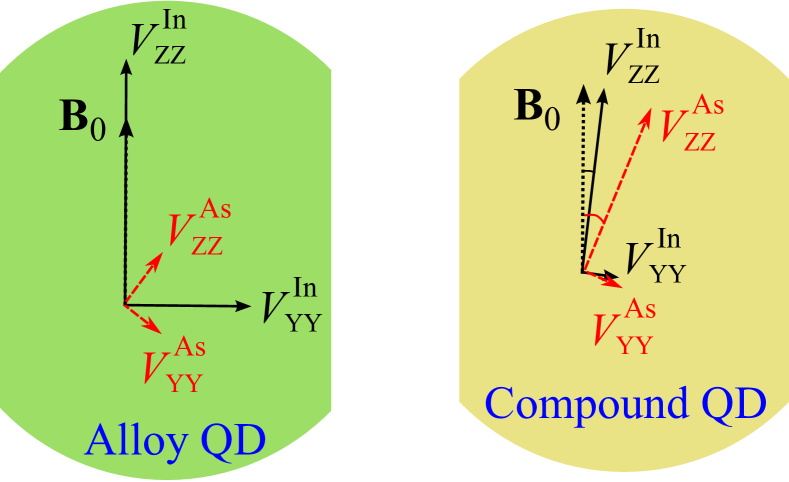
II.1 Three concomitant coordinate systems
The crux of our analysis is based on the simultaneous use of a number of coordinate systems. A QD has a native coordinate system set through the crystallographic axes where the QD growth axis usually coincides with one of them; in our test cases this is the -axis and the [001] direction. The orientations of an external magnetic field and the optical beam with respect to the growth axis of the QD bear particular significance in terms of which Faraday/Voigt geometries and pumping are defined. Yet, there are at least two more relevant coordinate axes that gain importance in an atomistic treatment. Unlike the global crystal axes, these are local, i.e., they change orientation with position over the QD. They are defined through strain and the EFG tensors, denoted in cubic crystallographic components by and , respectively. The two phenomena are linked through , the fourth-rank gradient elastic tensor as
| (1) |
where is the crystal electric field potential.shulman57 In the so-called Voigt notation, the tensor for cubic crystals is governed by only two independent components and , both of which are experimentally measurable.sundfors74 In cubic crystallographic axes, and relate the diagonal and off-diagonal strain and EFG components, respectively, like , , etc. where is the so-called biaxial strain. Similarly, we find it necessary to introduce a shear strain measure as to quantify the effectiveness of the off-diagonal components.bulutay12
The strain and EFG tensors have their own distinct principal axes where each becomes diagonal, and within which working with that quantity becomes highly convenient. Among the three principal axes of a rank-2 quantity (such as strain or EFG), the one with the largest absolute value is named as the major principal axis. Hence, this brings three concomitant coordinate systems at one’s disposal. Our primary interest in nuclear spin states in the presence of QI favors the explicit use of local EFG principal axes which we shall discriminate by the capital letters,note-notation with axes being labeled so as to satisfy the inequalities , making the major EFG axis.
II.2 Fundamental Hamiltonian
In the local frame the strain-dependent part of the nuclear Hamiltonian responsible for the QI is given by
| (2) |
where is the dimensionless nuclear spin angular momentum vector operator, through which we define the above raising/lowering scalar operators . As to the other variables, is the electric quadrupole moment of the nucleus, is the EFG parameter which is also the primary coupling constant of QI, with being the electronic charge, and is the biaxiality parameter, satisfying by construction, and it determines the mixing between the free nuclear spin magnetic quantum numbers.
In the same local frame the static magnetic field vector will be in general oblique as described by the spherical polar angles , and so that its Hamiltonian becomesdas58
where , and is the nuclear gyromagnetic ratio. Hence, for each nucleus under consideration,
needs to be solved, where we denote the resultant spectrum with , . Under sufficiently high magnetic fields, which we assume throughout our work, dipole-allowed transitions are . Among these, the strongest one is referred to as the central transition (CT), and the remaining weaker ones as the satellite transitions (STs). When the EFG major principal axis deviates from the direction, CT becomes broadened only as a second-order effect, hence stays quite narrow, whereas STs undergo extensive broadening as they are affected in first order.cohen57
II.3 Optical orientation
We characterize the nuclear spin ensemble within the QD by a nuclear spin temperature which is a measure of the degree of optical orientation. The probability of occupancy of each nuclear spin state, is governed by a thermal distribution of the form
where is the Boltzmann constant.
The helicity of the absorbed optical orientation beam dictates the spin of the created electron and hole as a requirement of angular momentum conservation. Subsequently, through predominantly the contact hyperfine interaction between the electron and nuclear spins, depending on the absorbed photon helicity the nuclear spins are either pumped down or up within their individual spectrum , toward or , respectively.urbaszek13 In the absence of an rf excitation, and under continuous optical orientation this distribution will be sustained. Therefore, the steady-state is either normal for , or inverted for persistent pumping. We represent the former (latter) by using a positive (negative) nuclear spin temperature, i.e., ().
II.4 rf Excitation
The novelty of the inverse spectra technique with respect to conventional saturation spectroscopy comes from its inverted excitation scheme, which has a white spectrum except for a frequency gap, .chekhovich12 If this gap does not coincide with any of the dipole-allowed transitions , then under a sufficiently long excitation, the population of all nuclear spin states will be equilibrated at the same value, , giving rise to zero nuclear polarization, and hence no Overhauser shift on the excitonic PL. On the other hand when the gap coincides with one, or sometimes simultaneously with a number of transitions, the equilibration will only occur within the states that remain under the gap-free parts of the excitation. Therefore, the states will be split into multiple groups,note-multiple each internally reaching to an individual saturation value based on the preexisting thermal populations of the member states according to
| (3) |
where is the group index, and is the number of member spin states within that group.
The spin polarization of a nucleus just after rf excitation will be based on the population of each state
| (4) |
If we denote by the optical pumping direction along which the electronic spin is aligned, which is usually, but not always the QD growth axis, then the parallel component of the nuclear polarization becomes . In the experiments, the changes in the nuclear polarization are probed via the Overhauser energy shift in the excitonic PL signalurbaszek13 which is given by
| (5) |
where is the hyperfine coupling constant, and is the electronic wave function at the nuclear site. Here, we ignore the hole hyperfine interaction which is about an order of magnitude weaker.fallahi10
III Results
III.1 Test QDs
The detailed chemical composition profile, i.e., local stoichiometry of InGaAs QDs is still an active and unresolved topic.biasiol11 A critical factor that nontrivially affects the uniformity of the indium distribution within the QD is the annealing process. It has been reported that the annealed QDs become less uniform along the lateral, but more uniform along the growth direction; furthermore, the dots get 25% bigger with respect to their pre-annealed sizes in both lateral and growth directions as the indium atoms out-diffuse while the gallium atoms diffuse inward.zibik07 We base our comparative analysis on two test cases of lens-shaped QDs having a base diameter of 40 nm and a height of 6 nm. Both QDs have an InAs wetting layer and are embedded into a GaAs host matrix, but differ in their interior compositions, with one QD being InAs, whereas the other being the alloy In0.2Ga0.8As (see, inset of Fig. 1), where indium and gallium atoms are randomly distributed all over the QD region according to the given mole fraction. Admittedly, these constitute the two extremes, and intermediate cases like partially segregated alloy realizations are not addressed in this work. The uniform alloy composition considered here is expected under high growth rate conditions, where the landing atoms on the surface do not have time to segregate into binary compounds, as they quickly get covered by the next layer.vastola11 The rationale behind the selection of these two cases is based on their distinct strain, and hence quadrupolar characteristics.bulutay12
The computational supercell contains more than 2 million atoms, most of them residing in the host matrix, and the QD itself has 171,884 atoms. We follow the procedure presented in Ref. bulutay12, for the relaxation of the embedded QDs to their final structures, and the extraction of the atomistic strain distributions. The only exception in the present work is that we do not perform any nearest-neighbor strain averaging as this would hinder the true linewidths of the isotope-dependent NMR spectra.
III.2 General spectral aspects
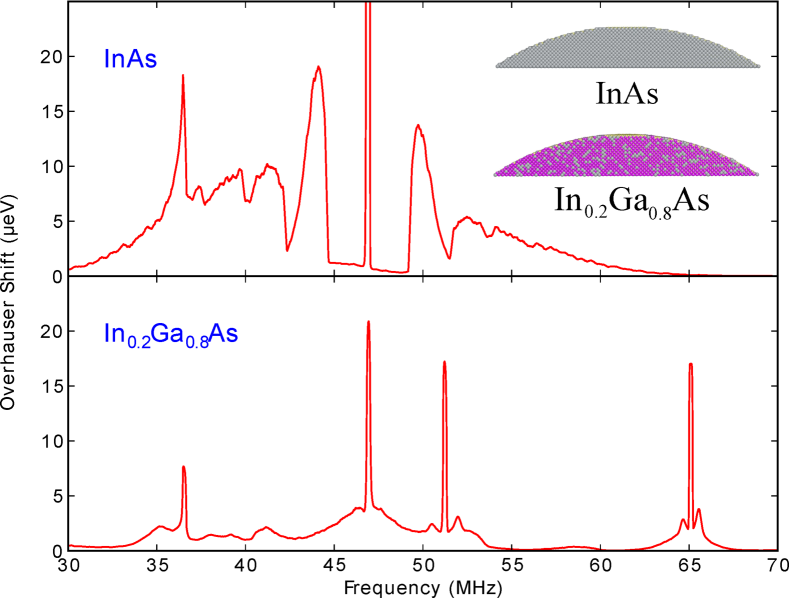
The inverse spectra for both test cases are shown in Fig. 1 computed with the associated parameters of T, =200 kHz, and = 3 mK, chosen to be representative of a realistic case.chekhovich12 The compound and alloy QD inverse spectra are strikingly different. The spectra in Fig. 1 is the cumulative result of all nuclei within the QD, under optical pumping. In all cases, unless stated otherwise, the static magnetic field vector, QD growth axis, and the optical pump beam directions are all collinear. Note that as we would like to develop a basic understanding of a typical InGaAs QD inverse spectra, throughout this work we use a simple uniformly distributed electron wave function that is confined within the lens-shaped QD region.
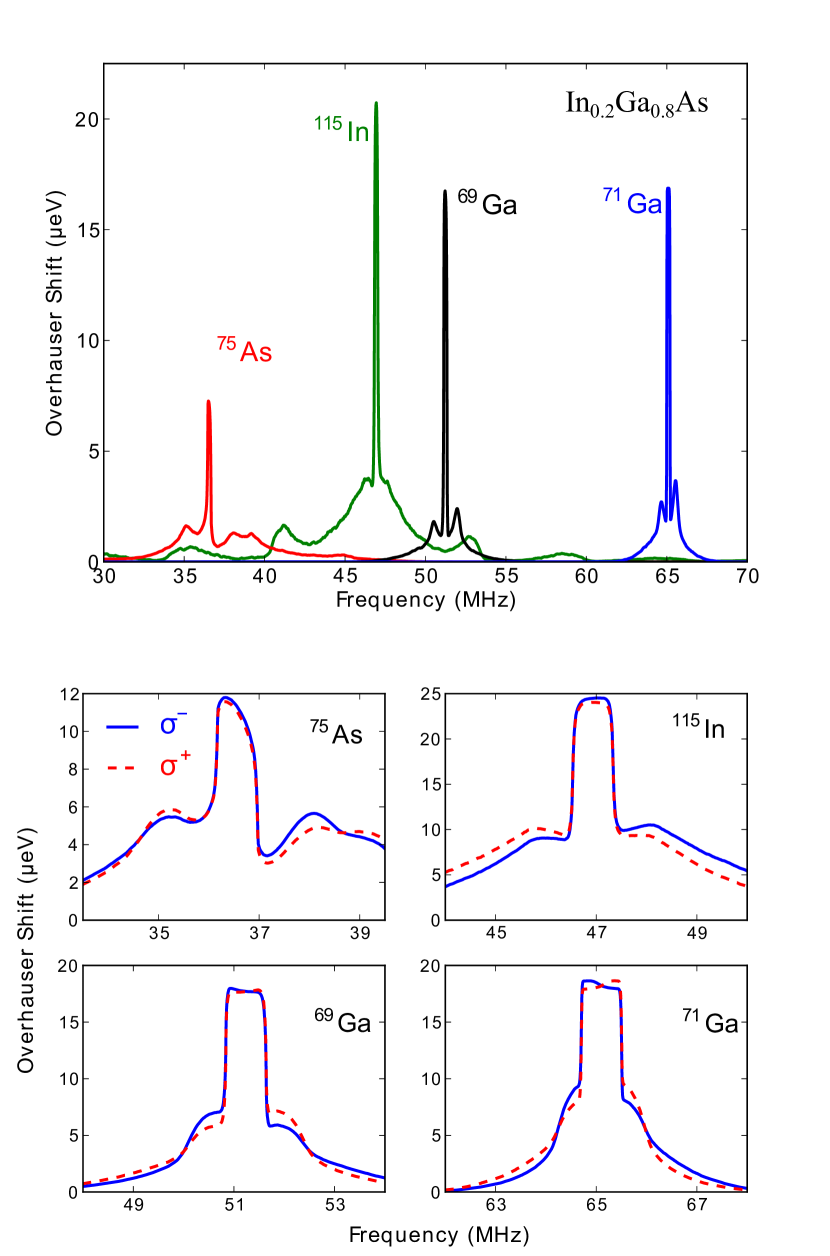
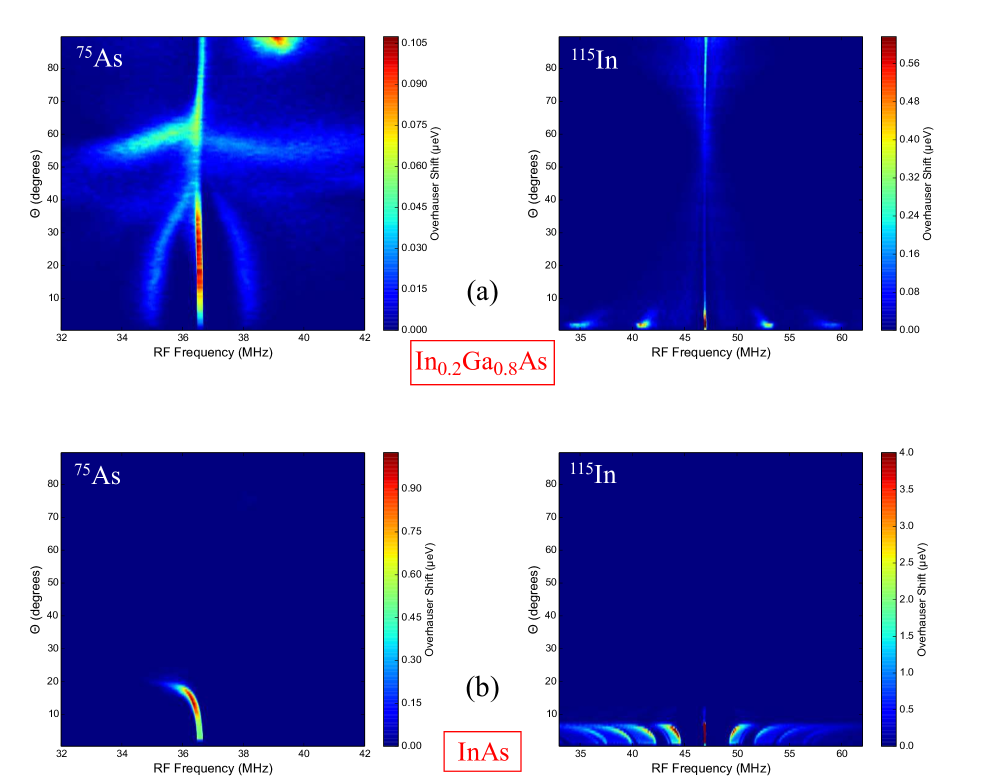
The contribution of individual isotopic species as well as the dependence on the light helicity with respect to external magnetic field are displayed in Fig. 2. Even though the number of arsenic nuclei is the largest, their CT resonance has the smallest peak, the reason for which is related to the hardness in polarizing the arsenic nuclei as elaborated further in Appendix A. The indium nuclei because of their 9/2 spins, have much extended STs as can be observed from the upper panel of Fig. 2. The spectrum asymmetry of the neighboring STs on either side of the CT are seen to be switched by changing pumping helicity (see, Fig. 2 lower panel), as a matter of fact the contrast can be enhanced further by increasing the initial polarization which amounts to lowering of . Also note that to boost the small differences, here we prefer to use a larger value of 800 kHz.
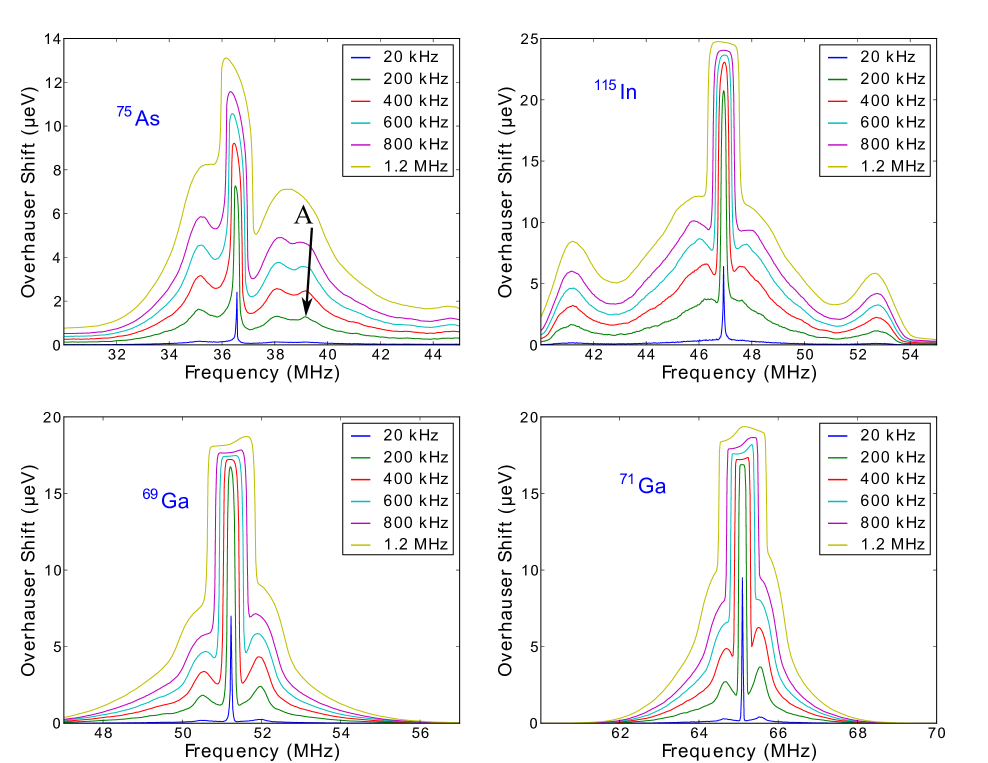
In experiments, the choice of value can indeed become a crucial decision for the inverse spectra. To highlight the trade off between spectral resolution and the signal intensity, in Fig. 3 we display the spectral evolution as a function of for each isotopic species. The resolution-limited flat-top profiles quickly emerge for the gallium nuclei indicating their narrow linewidths as will be analyzed below in more depth. On the other hand, for indium and especially arsenic nuclei, a large value may still be preferred which is particularly beneficial to capture the relatively weak features associated with the STs. One example for this is the emergence under larger values of an additional ST peak as indicated by an arrow on the top left arsenic panel of Fig. 3. For a spin-3/2 system only three peaks are expected, namely, 3/21/2, 1/2-1/2, and -1/2-3/2. Therefore, this fourth peak which unambiguously belongs to arsenic nuclei (see, Fig. 2, top panel) is rather curious. We identify it as the alloy peak with a reasoning based on an atomistic configuration analysis, however deferring its detailed discussion for now.
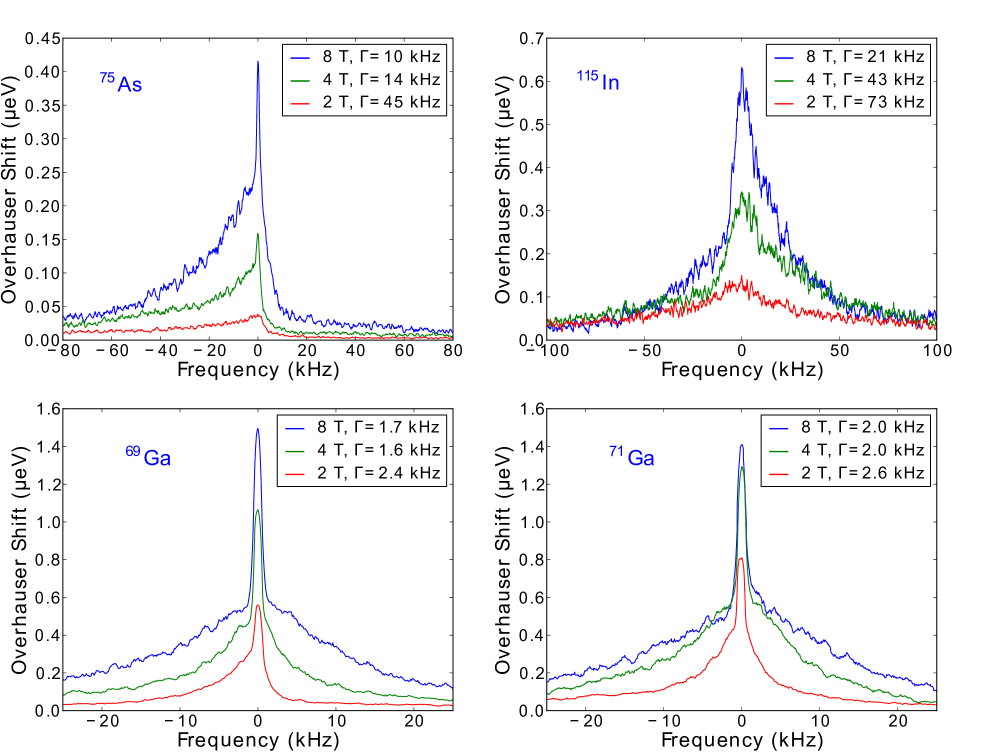
III.3 Central transition linewidth and profile
The CT lineshape is one of the means to probe information on the nuclear spin environment. For this purpose, first we select a small kHz, which is ultimately limited by the nuclear homogeneous linewidth.homogeneous Considering alloy In0.2Ga0.8As QD, CT line profiles at different magnetic fields are shown in Fig. 4. We should note that as there always remains some residual overlap from the ST of the other isotopic species, here the individual isotopic contributions, and not the total signals are plotted. These isotopic line profiles display distinct features, namely, 69Ga and 71Ga both have quite narrow main peaks over a broad pedestal, while In and As have evidently opposite asymmetric lineshapes.
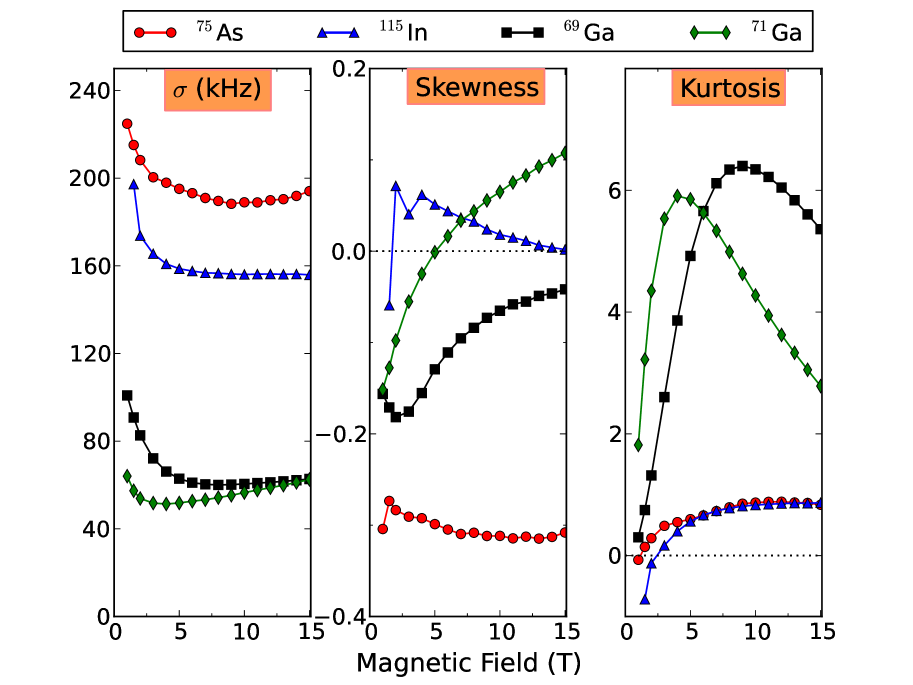
To quantify these trends, we make use of the mean, variance, skewness and kurtosisNR of these distributions; for a sample of data points these quantities are, respectively
where among a number of alternatives we prefer Pearson’spearson1895 mode skewness coefficient, , with being the standard deviation, and is the mode (peak value) of the distribution. Skewness is a dimensionless asymmetry parameter; for unimodal cases zero skewness corresponds to a symmetric distribution around its mode so that tails on either side balance out. Kurtosis is a dimensionless measure of relative peakedness or flatness of a distribution; for a normal distribution it becomes zero.
We employ these shape quantifiers on the CT of alloy In0.2Ga0.8As QD for all isotopes as illustrated in Fig. 5 which not only corroborate well with the observations of Fig. 4 but also reveal some additional trends. For all isotopes the standard deviations diverge as the magnetic field decrease below 2 T into the QI-dominant regime. The 71Ga isotope has the narrowest which is also matched by 69Ga at high magnetic fields. Regarding skewness, 71Ga monotonically changes its asymmetry from red- to blue-tailed making a transition at 5 T. As was qualitatively noted from Fig. 4, it is quantitatively asserted in Fig. 5 that In and As possess opposite skewness, a point which we shall discuss further after we lay out the atomistic structural analysis. Finally, from the kurtosis panel we observe that all isotopes start from a flat distribution within the QI-dominant regime at low magnetic fields which evolves to a peaked shape at higher fields. The gallium isotopes go through maxima around 4 T and 9 T for 71Ga and 69Ga, respectively.
III.4 Alloy bonding and consequences of quadrupole axial tilting
As illustrated in Appendix B through a number of histograms, the spread of quadrupole axial tilting is most pronounced for the As nuclei among all elements. This can be linked to the combined effect of the large variation in the shear strain component, of As atoms, compounded by the particularly high value of As nuclei that is more than 2.5 times of those of Ga and In values; see, also Appendix C. The large variance in of As has a chemical origin which stems from the mixed cation neighbors in the tetrahedral bonding: center As atom is coordinated with a different number of Ga/In atoms depending on the local alloy realization. The corresponding tilt angles, of the major EFG axes in each bonding configuration are presented in Table 1. This is in support of a recent NMR study which concludes that 75As QI is highly sensitive to different cation coordinations.knijn10 In the case of In or Ga atoms their nearest neighbors are always As, thus, the local strain variation in the cations (Ga, In) is more of a next-nearest-neighbor effect.
What is the physical implication of large variance in quadrupole axial tilting? The nuclear dipole-dipole interaction is the main channel for nuclear spin diffusion via pairwise flip-flops. However, if the major quadrupolar alignment of each of the involved nuclei is significantly off, this inhibits a flip-flop event on the basis of energy mismatch. We noted above that the alloy QD and in particular the As nuclei have a much wider variation in quadrupole axial tilting due to change in the local neighborhood as compared to the compound QD case. Therefore, QDs with large variance in shear strain are ideal candidates for reduced nuclear spin diffusion, hence prolonged times, as validated by recent experiments (see, Ref. chekhovich14, , and references therein). In fact, in resemblance to defect centers that receive wide attention for spintronics applications,koenraad11 ; doherty13 a random alloy InxGa1-xAs QD, especially of low molar fraction can be termed as a defect colony with so many indium atoms replacing the gallium of the host lattice.
|
|
|
|
|
||||||||||||
|---|---|---|---|---|---|---|---|---|---|---|---|---|---|---|---|
|
|
|
|
|
||||||||||||
|
|
|
|
|
||||||||||||
|
|
|
|
|
III.5 Hallmark for random alloying in ST band
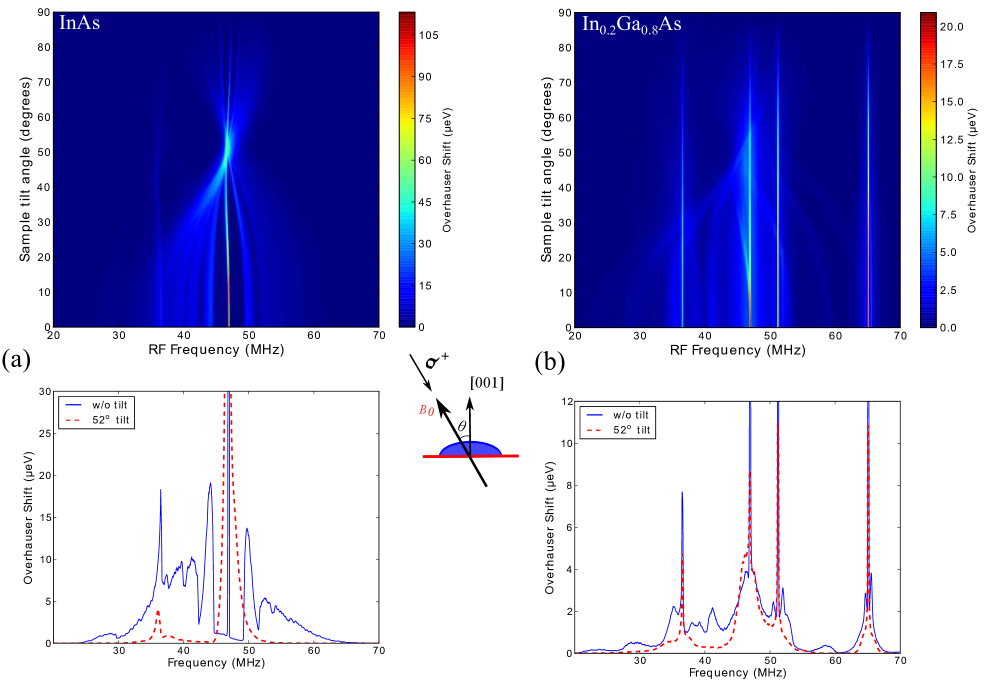
We now return to the additional ST peak on the top left 75As panel of Fig. 3 (marked with A and an arrow) which is unexpected for a spin-3/2 system. We attribute this A-peak to the cation-alloying present within the QD. Specifically we trace its origin to the As nuclei with their major quadrupolar EFG axes tilted perpendicular to the magnetic field. This can be observed from Fig. 6 where we analyze the contribution of nuclei tagged with respect to their EFG axial tilting. In the case of In nuclei (right panels), we do not see a particularly distinct feature coming from the nuclei (very few in number) that are close to perpendicular orientation (). In contrast, those for the case of As nuclei within the alloy In0.2Ga0.8As QD (left top panel) are clearly responsible for the A-peak. Because of the rather different strain environment of these nuclei, a distinct peak occurs (around 39 MHz) markedly separated in frequency from the neighboring ST peak (around 38 MHz). For the InAs QD, as there is only cation-alloying on the interfaces, there are almost no perpendicularly-tilted As nuclei (bottom left panel in Fig. 6), hence no contribution from them or an A-peak.
III.6 Opposite skewness of As and In CT lineshapes for the random alloy QD
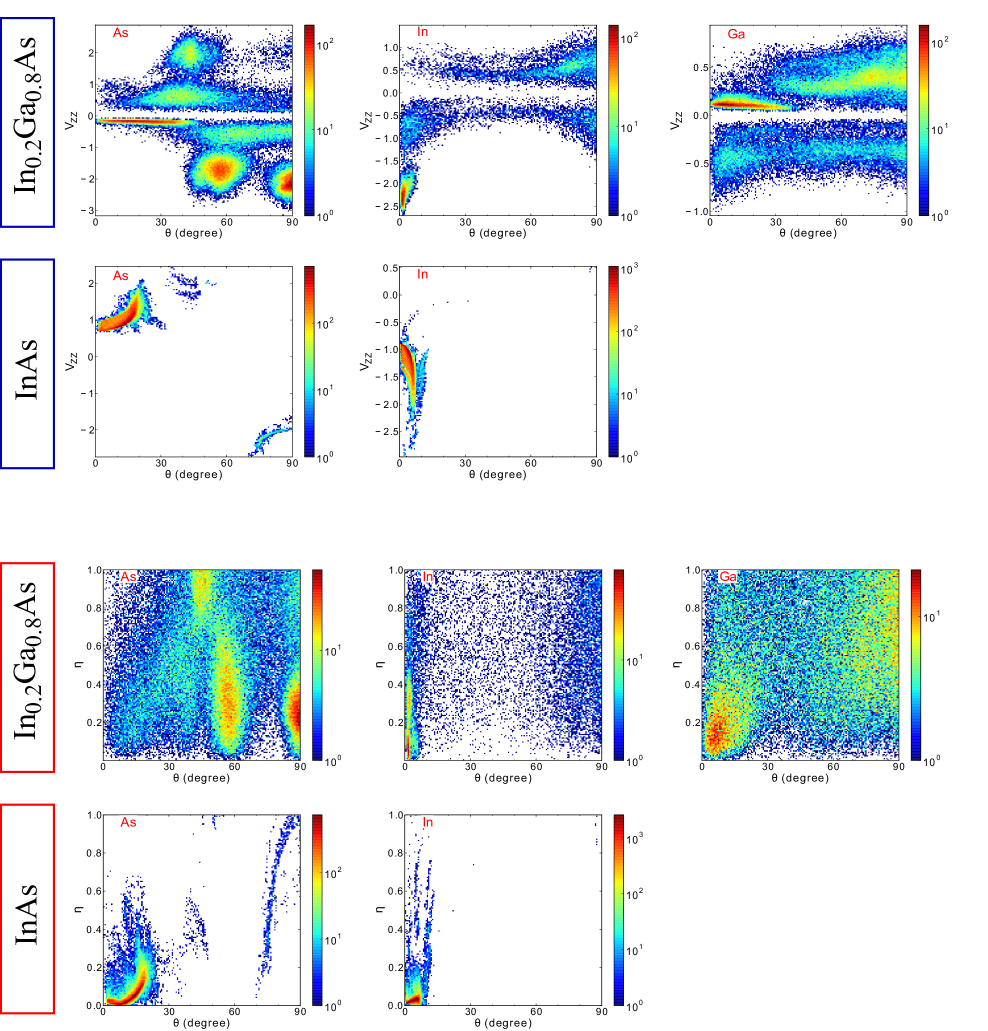
Based on the foregoing analysis, we can now address the intriguing contrast between the CT lineshape asymmetries of the In and As nuclei as displayed in Figs. 4 and 5. That is, the CT profile of In has positive skew (blue-tailed), while that for As has negative skew (red-tailed). The origin of these opposite behaviors is rooted in the corresponding disparity in their EFG characteristics manifested by two-dimensional histograms in Fig. 7. Specifically, for the case of As, the group of nuclei strongly tilted with and , and for the case of In those almost untilted but with large are responsible for the opposite skewness. For the latter, this large occurs from those In atoms residing in a relatively large biaxial strain environment, unlike the As or Ga atoms in relation to their CT. To reconcile these features with the displayed skewness patterns we make use of a single-nucleus analysis. Refering to Appendix D, EFG axial tilt at a constant causes a red shift of the CT as the tilt increases up to ; on the other hand for the case of nearly untilted nuclei, increasing and/or increasing EFG biaxiality, both cause a blue shift of the CT.
To further substantiate these points, in Fig. 8 we present major EFG orientation-resolved inverse spectra analysis focusing on the CT. Here, the top left panel shows that the red-tailed skewness in As results from the tilted nuclei of an angle less than , while on the top right panel the blue-tailed skewness of In is caused by almost untilted nuclei, (mind the different scales for the vertical axes). Note that the tilted In nuclei still give rise to red skew but they do not dominate. Indeed, in Fig. 9 we validate that if As (In) nuclei with tilt angle greater than () are only considered, the red (blue) skewness disappears. Next, returning to the bottom row of Fig. 8 in the case of the binary InAs QD both As and In CT are red skewed, which can also be inferred from their similar two-dimensional EFG histograms in Fig. 7 especially noting the fact that both ensembles have highly uniaxial EFG. Again invoking the single-nucleus insight from Appendix D, an increase in either the angular tilt or the both work in the same direction leading to red shift of the CT.
The typical EFG configurations responsible for the In and As CT lineshapes are summarized in Fig. 10. In the alloy QD, strain inflates the EFG biaxiality of both indium and arsenic nuclei; at the same time, in the case of arsenic enhances tilting, and in the case of indium boosts the major EFG. The contrast between these two nuclei disappears in the compound QD. Both have quite uniaxial EFG with some axial tiltings: distribution’s mode for In is and for As it is .
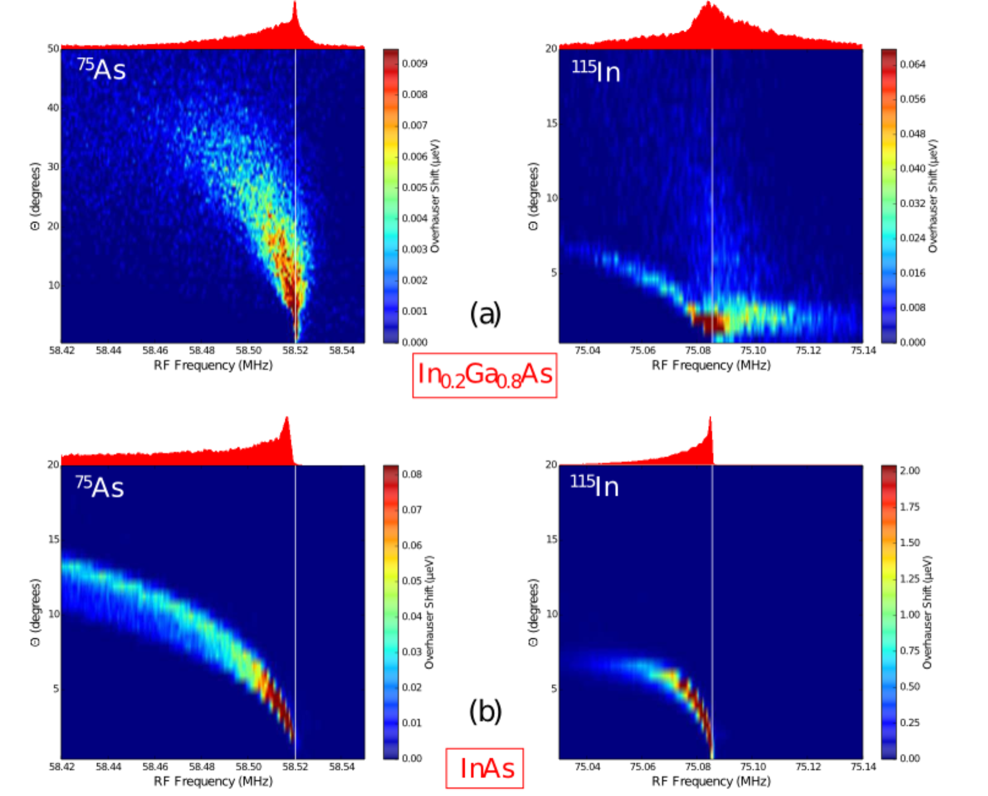
III.7 Satellite transition collapse under sample tilting
Other two-dimensional spectra can be generated with the added degree of freedom being the tilting of the sample growth axis with respect to the static magnetic field which is also taken to be the direction of the optical pump beam. The resultant spectra for binary InAs, and alloy In0.2Ga0.8As QD are shown in Fig. 11, where we observe that around a tilting range of , the STs “collapse” on to CT, i.e., rendering all neighboring transitions energetically almost identical. Not surprisingly this is more distinctly the case for the compound InAs QD. To explain this behavior, in Appendix D we demonstrate on a single 115In nucleus how the opposite ST shifts disappear at a tilting angle ranging between and depending on the biaxiality, (cf. Fig. 18). One outcome of this collapse is the reduction of the energy mismatch among the nuclei of the same isotope. Hence, especially for the indium nuclei which have the largest spin-9/2 manifold giving rise to the widest spread in energy, one can expect a shorter due to enhanced spin diffusion under the critically-tilted angle () with respect to no-tilted case. In a sense, sample tilting together with dipole-dipole interaction can act like a flush mechanism for evening out population imbalances among nuclear spin states brought and sustained by optical orientation.
IV Conclusions
This computational study demonstrates the power of the NMR inverse spectra technique as a tool for retrieving atomistic level structural information from strained SAQDs. Through a comparative assessment of alloy versus compound In(Ga)As QDs, as well as of the involved nuclear species, we unveil marked differences in their spectral features, and establish links with the local chemical structure, strain, and material properties. Our main findings are grouped as follows: (i) Strain and CT asymmetry; In compound InAs QDs the dominant component is the compressive biaxial strain which causes quite a uniaxial and rather strong EFG. The shear strain has a secondary role being significant around the interfaces and results in a limited, yet still crucial EFG axial tilting. Indium and arsenic nuclei qualitatively both obey this picture. The situation becomes more complex with the sway of random alloying in the InGaAs QD. The shear strain spreads all throughout the core and plays a primary role. Moreover, EFG biaxiality of all elements get enhanced. An interesting aftermath of atomistic alloy strain is that the indium nuclei are mostly untilted but have large EFG values, whereas arsenic nuclei have low EFG values but with excessive axial tiltings. Under the realm of these different EFG conditions, the asymmetry of the CT in compound QDs gets red-skewed for both In and As, while for the alloy QD the In CT acquires a dominant blue tail arising from a large untilted In nuclear population residing in a relatively large biaxial strain environment. (ii) Arsenic and cation alloying; Compared to In and Ga nuclei, As bares a number of distinctions. First, due to its low gyromagnetic ratio As nuclei are more prone to QI under a given magnetic field compared to In or Ga. Secondly, the shear strain is most operative on the arsenic nuclei. This stems from the large component of the gradient elastic tensor of arsenic nucleus, as well as nearest-neighbor variations because of cation alloying, not present for In and Ga categorically. An implication of these is that if there exists an alloy structure within the QD region, this can be identified, in principle by an additional peak in the arsenic ST. Specifically, it originates from those arsenic nuclei with their major quadrupolar EFG axes tilted perpendicular to the growth axis, a direct outcome of alloying. (iii) Sample tilt; Finally, we predict the collapse of the STs onto CT which is most pronounced in compound InAs QDs, and the possibility of negating QI and restoring a monoenergetic distribution like a solitary Zeeman interaction, simultaneously for all isotopic nuclear spins by tilting the sample about 52∘ with respect to static magnetic field. These findings must be verified experimentally and superseded by further studies for the purposes of both atomistic material insights and also for the coherent control of a relatively small number of nuclear spins embedded in a strained confined environment.
Acknowledgements.
C.B. would like to thank TÜBİTAK, Türkiye Bilimsel ve Teknolojik Araştırma Kurumu, for financial support through Project No. 112T148. E.A.C. was supported by a University of Sheffield Vice-Chancellor’s Fellowship. All authors acknowledge the support of UK Royal Society International Exchanges. A.I.T. and E.A.C. thank the financial support of the EPSRC Programme Grant EP/J007544/1.Appendix A: Nuclear polarization along the static magnetic field
In this appendix, we discuss the average nuclear spin orientation for each isotopic ensemble within the alloy In0.2Ga0.8As QD in the presence of both Zeeman and QI terms. Even though the results here are qualitatively along the normal expectations, the quantitative details and isotopic variations may still be worthwhile considering. In Fig. 12 we show the average nuclear polarization along the static magnetic field, for each isotopic ensemble as well as the total values, based on the weighted contribution of each isotope within the QD; in part (a), the upper plot depicts nuclear spin temperature dependence at a fixed magnetic field of 5 T, whereas the lower plot shows how it varies with respect to magnetic field at a fixed nuclear spin temperature, mK. The latter depends on the optical pumping and nuclear spin energetics. Qualitatively, in both cases all isotopes display the expected polarization trends under increased magnetic field or decreased nuclear spin temperature. On the quantitative side, there is a striking difference among the elements, namely arsenic nuclear ensemble’s polarization is substantially lower than the other elements. This is the origin of the mentioned smallest CT peak of arsenic among all elements in Fig. 2. Stated quantitatively, at T and mK, arsenic nuclear spin polarization is about 44%, whereas 69Ga 58%, 71Ga 68%, and 115In 81%. With the largest population belonging to the arsenic nuclei due to alloy partitioning between cations, the overall average polarization value (denoted as total in Fig. 12) comes out as 55%, i.e., closer to that of the arsenic value.
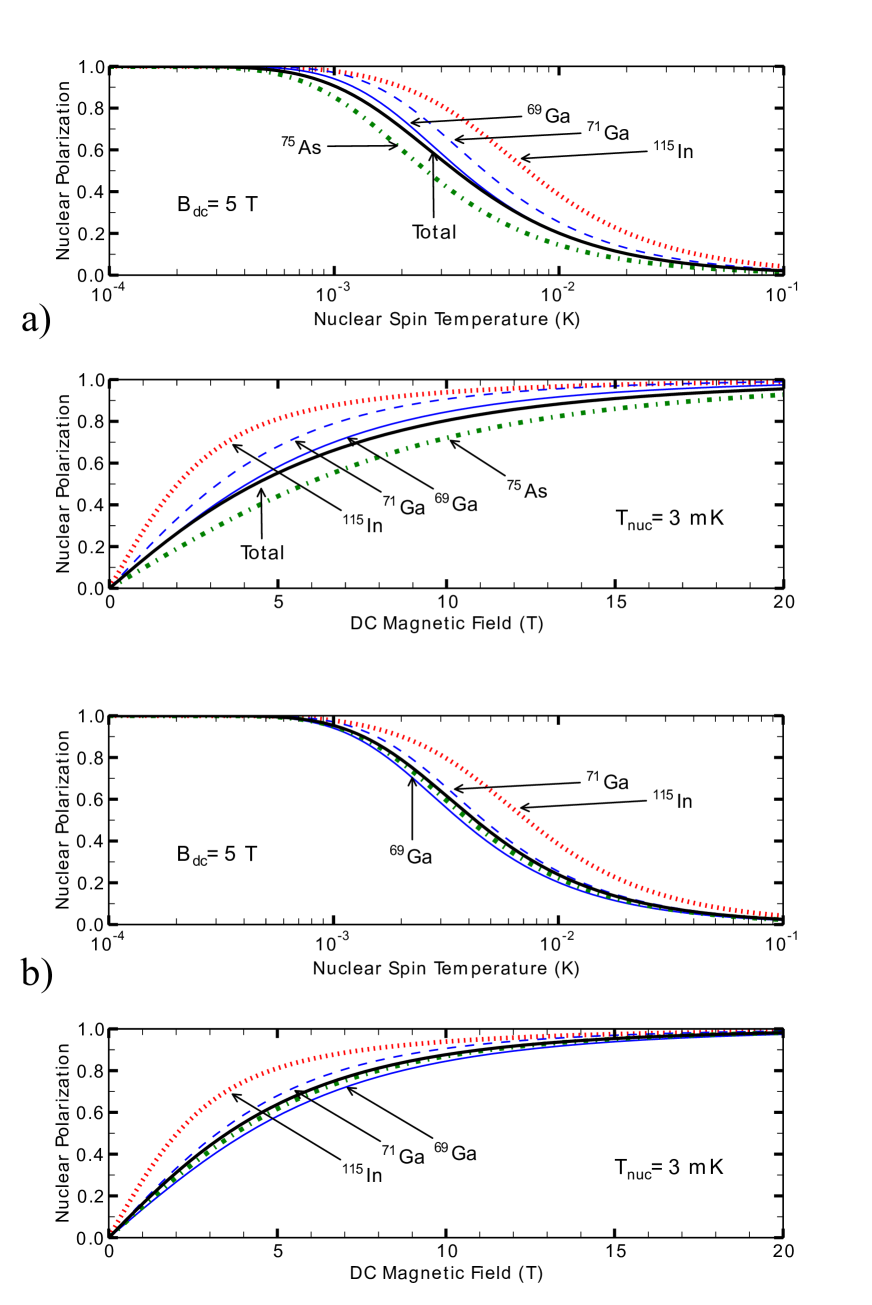
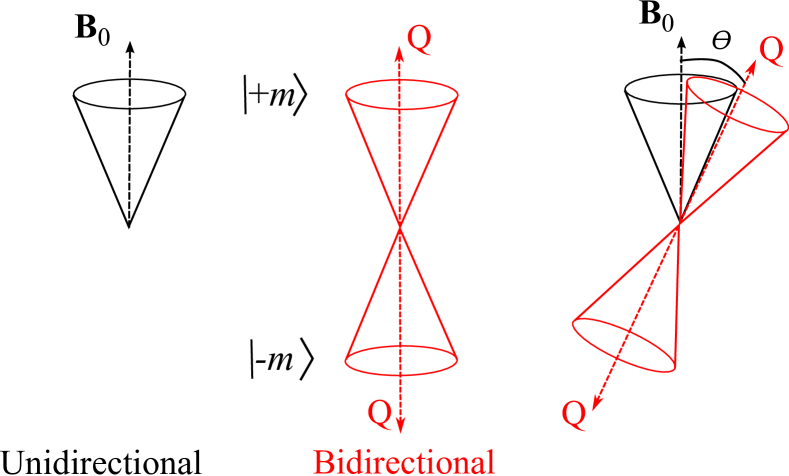
Why is it harder to orient the arsenic nuclei? By far the most critical factor is the gyromagnetic ratio, which is substantially smaller for arsenic compared to other elements. To illustrate this point, we artificially increase for 75As by 55% so that it reaches to the average value of the 69Ga and 71Ga ensemble. It can be observed in part (b) of Fig. 12 that arsenic as well as the total nuclear polarization now lie in between the 69Ga and 71Ga curves. In particular, for T and mK, the arsenic spin alignment increases from its actual value of 44% to 62%. The underlying reason is that QI has a bidirectional character; being an electrostatic interaction in nature, it cannot discriminate the states , whereas Zeeman interaction being unidirectional splits the and states thereby promoting nuclear spin polarization (see, Fig. 13). In other words, while the static magnetic field (Zeeman term) tries to polarize the nuclear spins, QI tries to erase this. Hence, with their low value, 75As nuclei are more prone to the quadrupolar depolarization compared to other isotopes at the same external magnetic field. In the case for pure InAs QD (not shown), the trends are similar, however, as this QD is much more strained, here the relevant component is the biaxial strain, ,bulutay12 the quadrupolar effects are somewhat more pronounced.
Appendix B: Histograms for the alloy and the compound QD
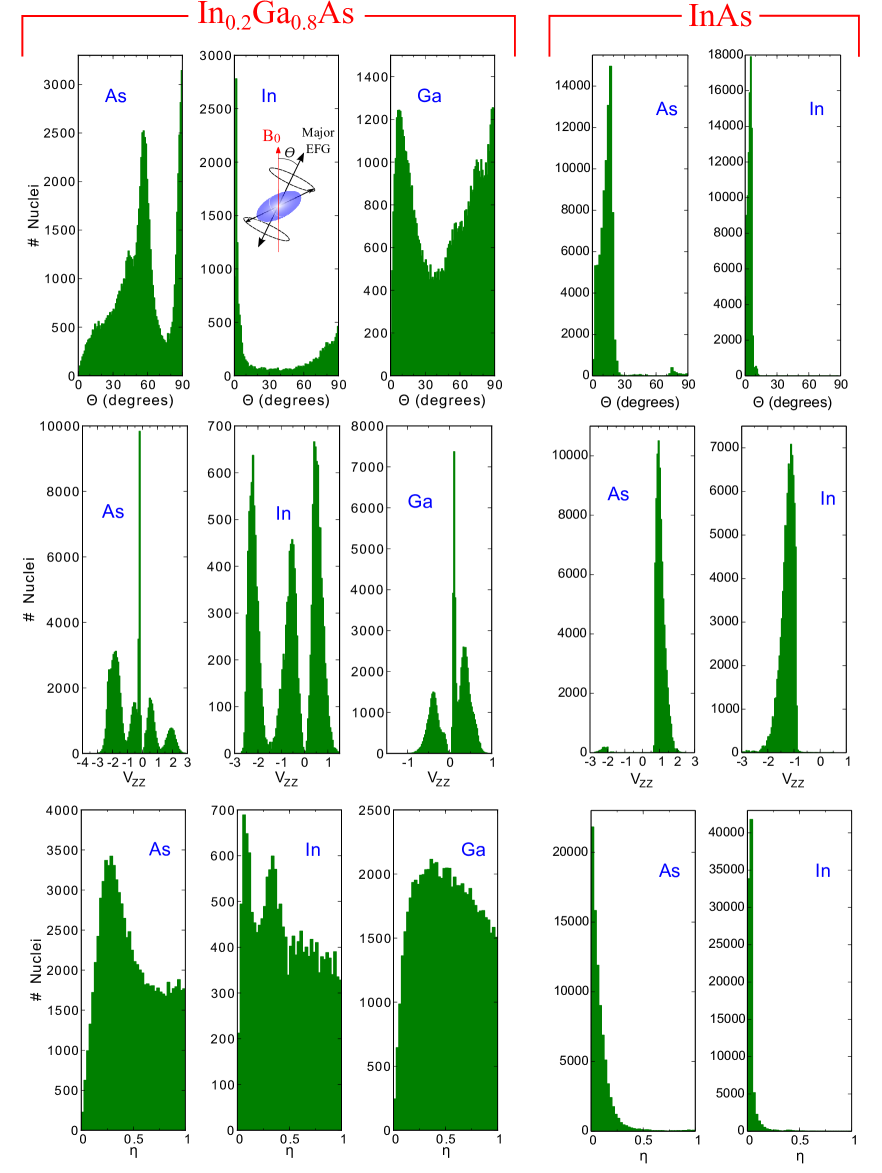
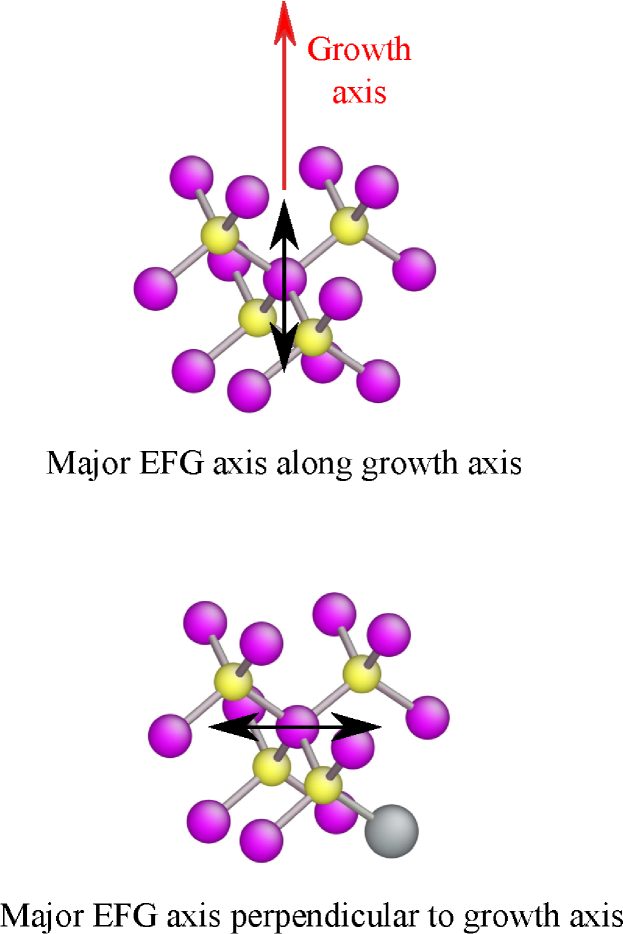
In this appendix, histograms for the three EFG parameters, namely, major quadrupole axial tilting away from the static magnetic field, , the value of the major EFG, , and the EFG biaxiality, are discussed comparatively for the alloy and compound QDs. Starting with axial tilting for the alloy In0.2Ga0.8As QD as displayed in the top row of Fig. 14, we observe a remarkable dissimilarity in the orientations of arsenic nuclei in comparison to cations (Ga, In). The latter display somewhat similar characteristics, that peaks either along or perpendicular to the magnetic field. As mentioned in the main text, for the cation nuclei (Ga, In) the quadrupole axial tilting is driven by a change in their next-nearest neighborhoods. All together there are 144 configurations; we show in Fig. 15 two such gallium-centric instances where a change in the second-nearest neighbor atom switches the major EFG axis from parallel to perpendicular orientation with respect to growth axis. The distribution of the axial tilting of As nuclei has two peaks at 45∘ and 54.7∘ that coincide with those pre-relaxed configurations of Table 1, even obeying the same 1:2 ratio of the relative weights of these cation-bonding orientations. Next, considering the binary InAs QD, due to lack of alloying for this case, both In and As nuclei’s major EFG axes are more or less aligned along the magnetic field. The interface As atoms which are relatively low in number do still have mixed cation neighbors and this gives rise to some limited variance and axial tilting. Analyzing the middle rows, in the alloy QD major EFG values are evenly distributed on either side of zero, and grouped in a few bunches; for the compound QD, the nuclei are gathered around a single value with opposite signs for In and As. The biaxiality parameters (bottom rows) of the two QDs are also markedly different: They are spread over the full accessible range for the alloy QD, whereas the compound QD EFG is quite uniaxial, mainly restricted to lower than the 0.25 value.
Appendix C: The role of quadrupole parameters on the lineshape
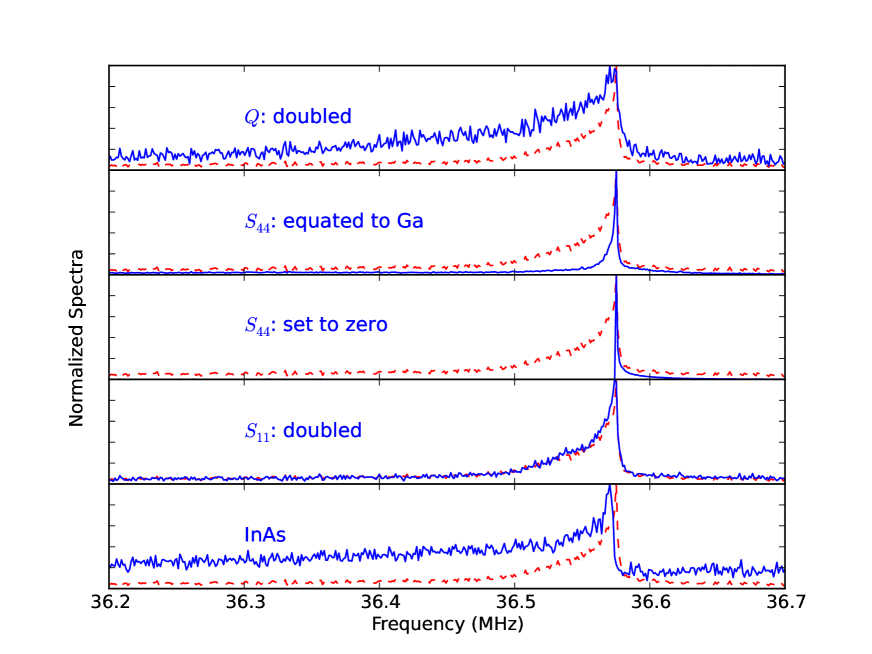
The aim of this appendix is to develop a feeling for the importance of the individual nuclear quadrupole parameters () of As in regard to CT lineshape. As illustrated in Fig. 16, if we double the electric quadrupole moment , the red-tailed asymmetry is enhanced indicating that its origin is the QI. In particular, the component of the gradient elastic tensor primarily controls the asymmetric profile: Lowering this value to that of Ga (i.e., decreasing by about 2.5 times) drastically reduces the asymmetry, while setting it to zero totally removes and even reverses its direction. Since relates the off-diagonal entries of EFG and the strain tensors, its effectiveness directly invokes to the importance of shear strain on the CT asymmetry. On the other hand, the component is not functional, doubling its value virtually leaves the asymmetry unchanged.
Note that all of the above statements refer to the In0.2Ga0.8As QD. Additionally, in the bottom panel of Fig. 16 we compare the alloy QD with the binary InAs QD, where in the latter the CT asymmetry of As nuclei gets significantly enhanced. This is at odds with the established insight so far based on the prime importance of the shear strain, in conjunction with its small value for binary InAs QD. As a matter of fact as shown in the left column of Fig. 17, the interior of the In0.2Ga0.8As QD retains an exuberant shear strain profile due to random alloying, whereas this gets diminished in the core of the InAs QD and only becomes significant toward the interfaces. However, a change of roles is observed in the right column of the same figure where the compound QD has much stronger biaxial strain compared to alloy QD simply due to larger lattice mismatch between the core and the matrix regions. As we have stated in the atomistic analysis (see, also Appendix D), not only shear but also the biaxial strain component can cause a shift in CT; the former acts through EFG axial tilting as in alloy QD, and the latter via the major EFG value in the case of compound QD.
Appendix D: Single-nucleus particular EFG parameter traits
In this appendix considering a single nucleus governed by the general Hamiltonian, , we present how CT and ST frequencies shift under various combinations of the three EFG parameters: the major EFG value (), the angular deviation of the major EFG axis from the static magnetic field (), and biaxiality (). As the trends are qualitatively similar among the nuclear species of this work, for demonstration purposes we choose 115In. The static magnetic field is taken as 8 T which is used in some of our calculations in the text. Within the STs, we consider the transition.
Figure 18 displays the variation with respect to each one of , , while keeping the other two parameters fixed. As the shift of CT is in second order under QI,cohen57 the dependence on is quadratic, hence independent of its sign [Fig. 18(a)]; in contrast, ST shifts being first-order are much stronger [Fig. 18(b)];. For both CT and ST the direction of shift depends on . In the case of CT for small angles there is a blue shift with increasing , which becomes a red shift for larger angles, Fig. 18(a);, 10∘ curve. For the specific case considered here (115In and ) this transition occurs at . Yet, for even larger angles this reverts back to a blue shift, Fig. 18(a), 90∘ curve. The continuous variation of produces a cosine-type shift in either CT and ST, again with the effect being much stronger for the latter, Figs. 18(c) and (d). Observe that the shifts in ST for cross each other at a value ranging between and as varies from 0 to 1. Other STs (for the case of In) display a similar pattern. It is this behavior that is harnessed in the collapse of STs at a convenient sample tilting around 52∘. The bare dependence on can be seen in Figs. 18(e) and (f); in particular it shows a blue shift in CT for . A rather inhomogeneous mixture of these single-nucleus traits as governed by the atomistic strain field gives rise to a unique fingerprint of the QD NMR.
References
- (1) B. Urbaszek, X. Marie, T. Amand, O. Krebs, P. Voisin, P. Maletinsky, A. Högele, and A. Imamoglu, Rev. Mod. Phys. 85, 79 (2013).
- (2) E. A. Chekhovich, M. N. Makhonin, A. I. Tartakovskii, A. Yacoby, H. Bluhm, K. C. Nowack, and L. M. K. Vandersypen, Nature Mater. 12, 494 (2013).
- (3) J. M. Taylor, C. M. Marcus, and M. D. Lukin, Phys. Rev. Lett. 90, 206803 (2003).
- (4) C. Deng and X. Hu, Phys. Rev. B 71, 033307 (2005).
- (5) C. W. Lai, P. Maletinsky, A. Badolato, and A. Imamoglu, Phys. Rev. Lett. 96, 167403 (2006).
- (6) A. Högele, M. Kroner, C. Latta, M. Claassen, I. Carusotto, C. Bulutay, and A. Imamoglu, Phys. Rev. Lett. 108, 197403 (2012).
- (7) W. Yang and L. J. Sham, Phys. Rev. B 88, 235304 (2013).
- (8) S. E. Economou and E. Barnes, Phys. Rev. B 89, 165301 (2014).
- (9) J. A. Marohn, P. J. Carson, J. Y. Hwang, M. A. Miller, D. N. Shykind, and D. P. Weitekamp, Phys. Rev. Lett. 75, 1364 (1995).
- (10) D. Gammon, S. W. Brown, E. S. Snow, T. A. Kennedy, D. S. Katzer, and D. Park, Science 277, 85 (1997).
- (11) J. M. Kikkawa and D. D. Awschalom, Science 287, 473 (2000).
- (12) M. N. Makhonin, E. A. Chekhovich, P. Senellart, A. Lemaître, M. S. Skolnick, and A. I. Tartakovskii, Phys. Rev. B 82, 161309 (2010).
- (13) M. S. Kuznetsova, K. Flisinski, I. Ya. Gerlovin, M. Yu. Petrov, I. V. Ignatiev, S. Yu. Verbin, D. R. Yakovlev, D. Reuter, A. D. Wieck, and M. Bayer, Phys. Rev. B 89, 125304 (2014).
- (14) M. Munsch, G. Wüst, A. V. Kuhlmann, F. Xue, A. Ludwig, D. Reuter, A. D. Wieck, M. Poggio, and R. J. Warburton, Nature Nanotech. 9, 671 (2014).
- (15) E. A. Chekhovich, K. V. Kavokin, J. Puebla, A. B. Krysa, M. Hopkinson, A. D. Andreev, A. M. Sanchez, R. Beanland, M. S. Skolnick, and A. I. Tartakovskii, Nature Nanotech. 7, 646 (2012).
- (16) M. N. Makhonin, K. V. Kavokin, P. Senellart, A. Lemaître, A. J. Ramsey, M. S. Skolnick, and A. I. Tartakovskii, Nature Mater. 10, 844 (2011).
- (17) E. A. Chekhovich, M. Hopkinson, M. S. Skolnick, and A. I. Tartakovskii, arXiV:1403.1510v2 (unpublished).
- (18) R. I. Dzhioev and V. L. Korenev, Phys. Rev. Lett. 99, 037401 (2007).
- (19) C. W. Huang and X. Hu, Phys. Rev. B 81, 205304 (2010).
- (20) C. Bulutay, Phys. Rev. B 85, 115313 (2012).
- (21) S. Yu. Verbin, I. Ya. Gerlovin, I. V. Ignatiev, M. S. Kuznetsova, R. V. Cherbunin, K. Flisinski, D. R. Yakovlev, and M. Bayer, J. Expt. Theor. Phys. 114, 681 (2012).
- (22) P. Fallahi, S. T. Yilmaz, and A. Imamoglu, Phys. Rev. Lett. 105, 257402 (2010).
- (23) D. G. Cory, A. F. Fahmy, and T. F. Havel, Proc. Natl. Acad. Sci. U.S.A. 94, 1634 (1997).
- (24) L. M. K. Vandersypen, M. Steffen, G. Breyta, C. S. Yannoni, M. H. Sherwood, and Isaac L. Chuang, Nature (London) 414, 883 (2001).
- (25) G. Yusa, K. Muraki, K. Takashina, K. Hashimoto, and Y. Hirayama, Nature (London) 434, 1001 (2005).
- (26) D. M. Bruls, J. W. A. M. Vugs, P. M. Koenraad, H. W. M. Salemink, J. H. Wolter, M. Hopkinson, M. S. Skolnick, F. Long, S. P. A. Gill, Appl. Phys. Lett. 81, 1708 (2002).
- (27) I. Kegel, T. H. Metzger, A. Lorke, J. Peisl, J. Stangl, G. Bauer, J. M. García, P. M. Petroff, Phys. Rev. Lett. 85, 1694 (2000).
- (28) Y. Yacoby, M. Sowwan, E. Stern, J. Cross, D. Brewe, R. Pindak, J. Pitney, E. M. Dufresne, and R. Clarke, Nature Mater. 1, 99 (2002).
- (29) T. F. Kelly, M. K. Miller, Rev. Sci. Instrum. 78, 031101 (2007).
- (30) M. H. Levitt, Spin Dynamics, 2nd ed. (Wiley, New York, 2007).
- (31) D. Paget and V. L. Berkovits, in Optical Orientation, edited by F. Meier and B. P. Zakharchenya (North-Holland, New York, 1984), Chap. 9.
- (32) P. Petroff, Top. Appl. Phys. 90, 1 (2003).
- (33) M. H. Cohen and F. Reif, Solid State Phys.5, 321 (1957).
- (34) T. P. Das and E. L. Hahn, Nuclear Quadrupole Resonance Spectroscopy (Academic Press Inc., New York, 1958).
- (35) R. G. Shulman, B. J. Wyluda, and P. W. Anderson, Phys. Rev. 107, 953 (1957).
- (36) R. K. Sundfors, Phys. Rev. B 10, 4244 (1974).
- (37) An alternative notation in the literature is the use of lowercase subscripts, but with a ‘’ superscript, i.e., , to designate the EFG principal axis. As we would like to reserve the superscript for the element/isotope label when necessary, we prefer to use .
- (38) In the presence of quadrupolar and Zeeman interactions the nuclear energy level spacings become non-monotonic, sometimes giving rise to more than two groups.
- (39) G. Biasiol and S. Heun, Phys. Rep. 500, 117 (2011).
- (40) E. A. Zibik, W. H. Ng, L. R. Wilson, M. S. Skolnick, J. W. Cockburn, M. Gutierrez, M. J. Steer, and M. Hopkinson, Appl. Phys. Lett. 90, 163107 (2007).
- (41) G. Vastola, V. B. Shenoy, J. Guo, and Y.-W. Zhang, Phys. Rev. B 84, 035432 (2011).
- (42) D. Mao and P. C. Taylor, Phys. Rev. B 52, 5665 (1995).
- (43) W. H. Press, S. A. Teukolsky, W. T. Vetterling, and B. P. Flannery, Numerical Recipes, 3rd ed. (Cambridge University Press, Cambridge, 2007), p. 721.
- (44) K. Pearson, Phil. Trans. R. Soc. Lond. A, 186, 343 (1895).
- (45) P. J. Knijn, P. J. M. van Bentum, E. R. H. van Eck, C. Fang, D. L. A. G. Grimminck, R. A. de Groot, R. W. A. Havenith, M. Marsman, W. L. Meerts, G. A. de Wijs, and A. P. M. Kentgens, Phys. Chem. Chem. Phys. 12, 11517 (2010).
- (46) P. M. Koenraad, and M. E. Flatté, Nature Mater. 10, 91 (2011).
- (47) M. W. Doherty, N. B. Manson, P. Delaney, F. Jelezko, J. Wrachtrup, and L. C. L. Hollenberg, Phys. Rep. 528, 1 (2013).