NGC 6522: A typical globular cluster in the Galactic bulge without signatures of rapidly rotating Population III stars
Abstract
We present an abundance analysis of eight potential member stars of the old Galactic bulge globular cluster NGC 6522. The same stars have previously been studied by Chiappini et al. (2011), who found very high abundances of the slow neutron capture elements compared with other clusters and field stars of similar metallicity, which they interpreted as reflecting nucleosynthesis in rapidly rotating, massive Population III stars. In contrast to their analysis, we do not find any unusual enhancements of the neutron capture elements Sr, Y, Ba and Eu and conclude that previous claims result mainly from not properly accounting for blending lines. Instead we find NGC 6522 to be an unremarkable globular cluster with comparable abundance trends to other Galactic globular clusters at the same metallicity (). The stars are also chemically similar to halo and bulge field stars at the same metallicity, spanning a small range in [Y/Ba] and with normal -element abundances. We thus find no observational evidence for any chemical signatures of rapidly rotating Population III stars in NGC 6522.
keywords:
Stars1 Introduction
As one of the oldest stellar populations in our Galaxy, globular clusters are key to understanding the earliest epochs of galaxy evolution and stellar nucleosynthesis. Globular clusters may therefore contain unique chemical markers of the first generations of stars. All globular clusters indeed show abundance peculiarities compared with the typical field population, such as an O-Na anti-correlation, which is normally interpreted as reflecting two or more generations of stars in the clusters with the first one sharing the chemical composition with normal field stars of the same metallicity (Gratton et al., 2012).
The nature of the polluter of the later generations of stars is still being debated with intermediate mass asymptotic giant branch stars or rapidly rotating massive stars the leading contenders. As the polluters would be part of the first cluster generation, some of which are still present, they would thus not be metal-free Population III stars but Population II stars of the same metallicity as the cluster as a whole. Until recently there have been no convincing observations of Population III nucleosynthesis in any globular cluster star but Chiappini et al. (2011) claim to have found exactly such a smoking gun in NGC 6522.
NGC 6522 is a little studied globular cluster in the Milky Way’s bulge. Observations of individual stars in this cluster are difficult due to the large crowding of more metal-rich bulge stars and foreground disk contamination in this region as well as the heavy interstellar extinction and reddening characteristic of sight lines of the Galactic bulge, especially near the plane. However, this is a particularly important globular cluster because it may be the oldest globular cluster in the Milky Way (Barbuy et al., 2009) and it may contain vital clues to the formation and early evolution of the still poorly understood bulge (e.g. Ness et al., 2013). Chiappini et al. (2011) recently analysed eight potential NGC 6522 cluster members and found remarkably high abundances of slow neutron-capture elements, distinct from any other globular cluster observed. The authors demonstrated that such a chemical abundance pattern would be consistent with the nucleosynthesis predicted for rapidly rotating massive, extremely metal-poor or Population III stars, so-called spinstars (Pignatari et al., 2008).
The fact that this cluster is so far unique in carrying such a nucleosynthetic signature may reflect that the very first stars born after the Big Bang formed in the largest over-densities, which subsequently grew with time to become centres of galaxies. The oldest Galactic stars should therefore be concentrated in the bulge region (Tumlinson, 2010), which also experienced the most rapid chemical enrichment due to the intense star formation rate, making it conceivable that any Population III chemical fingerprint may preferentially show up in an old bulge cluster with such as NGC 6522.
Given the potentially far-reaching implications of the work of Chiappini et al. (2011), we present a re-analysis of the same cluster stars but importantly with a more detailed accounting of blending lines as well as isotopic hyperfine splitting of the -process abundance diagnostics.
2 Observations
The GIRAFFE/VLT data from the program 071.B-0617(A) (PI=A. Renzini) were downloaded from the ESO archive. These observations were taken during May-July 2003 and comprised of two field pointings and three wavelength settings: HR13 (612-640nm), HR14 (638.3-662.6nm) and HR15 (679.7-696.5nm). A more comprehensive description of the data can be found in Barbuy et al. (2009). A number of calibration frames were missing from the ESO archive but were provided by ESO support upon request. We could not locate all of the data corresponding to the total exposure times reported in Barbuy et al. (2009) for unknown reasons. The available data were reduced using Gasgano (version 1.24) with the wavelength calibration verified using skylines and telluric lines. The data were sky subtracted using an automated python routine that determined a median sky from the available sky fibres and removed it from each science frame. For each wavelength setting, separate frames were co-added. The resulting signal-to-noise () ratio per resolution element for the three wavelength settings are listed in Table 1.
The stellar radial velocities were determined from a cross-correlation with a theoretical model atmosphere spectrum (corresponding to K, [cgs], [Fe/H]) smoothed to the resolving power of the observations using the routine fxcor in pyraf. Bad pixels and telluric regions were masked out for this procedure. Our measured radial and heliocentric velocities are listed in Table 1. The mean heliocentric velocity we report for these nine candidate NGC 6522 stars is km s-1, which is in reasonable agreement with the value quoted by Harris (2010): km s-1. It is possible that some of the candidate stars may not be cluster members in spite of the similarity in velocity and metallicity, although there is some discussion in the literature regarding the actual heliocentric velocity of the cluster (Terndrup et al., 1998). It should be noted that our heliocentric velocities differ from those reported by (Barbuy et al., 2009) based on the same observations for unknown reasons. Our inferred heliocentric velocities from the three different wavelength settings obtained at different times are in excellent agreement with each other ( km s-1), which is not true for Barbuy et al. (2009) (see their Table 3).
3 Abundance analysis
After continuum normalisation, we performed a standard 1D LTE abundance analysis using the SMH spectrum analysis program of Casey et al. (2013), which is built around the well-known MOOG code of Sneden (1973). Initial effective temperature guesses were provided by de-reddened 2MASS photometry (Skrutskie et al., 2006) using the Bessell et al. (1998) calibration. Similarly to Barbuy et al. (2009) we discard the star B-134 from further analysis due to contamination of the spectra from a companion/blending star. Spectroscopic stellar parameters of , and [Fe/H] were determined from an iterative procedure to achieve excitation and ionisation balance using 60 Fe i lines and 12 Fe ii lines. The microturbulence parameter () was calculated by removing any abundance trends with reduced equivalent width. The final stellar parameters are reported in Table 2. The typical uncertainties in the stellar parameters are K, and , respectively. We report a marginally lower mean metallicity for these eight stars than Barbuy et al. (2009): compared to .
| Star | Coordinates | Grating | [Fe/H] | |||||
|---|---|---|---|---|---|---|---|---|
| (J2000) | [km s-1] | [km s-1] | [km s-1] | [km s-1] | dex | |||
| B-008 | 18:03:46.04, -30:00:50.9 | HR13 | 88 | -29.9 | -8.8 | -8.6 | 0.3 | -1.02 |
| HR14 | 81 | -8.6 | -8.6 | |||||
| HR15 | 132 | -16.0 | -8.2 | |||||
| B-107 | 18:03:36.59, -30:02:16.1 | HR13 | 93 | -27.0 | -5.9 | -6.0 | 0.4 | -1.34 |
| HR14 | 86 | -6.5 | -6.5 | |||||
| HR15 | 134 | -13.3 | -5.5 | |||||
| B-108 | 18:03:35.18, -30:02:04.9 | HR13 | 156 | -33.1 | -12.1 | -13.0 | 0.7 | -1.37 |
| HR14 | 142 | -13.7 | -13.8 | |||||
| HR15 | 188 | -20.9 | -13.1 | |||||
| B-118 | 18:03:42.24, -30:03:39.9 | HR13 | 87 | -42.9 | -21.9 | -21.9 | 0.1 | -1.04 |
| HR14 | 85 | -22.0 | -22.0 | |||||
| HR15 | 133 | -29.7 | -21.9 | |||||
| B-122 | 18:03:33.34, -30:01:58.3 | HR13 | 96 | -36.9 | -15.8 | -15.7 | 0.1 | -0.95 |
| HR14 | 92 | -15.6 | -15.7 | |||||
| HR15 | 134 | -23.3 | -15.5 | |||||
| B-128 | 18:03:44.61, -30:02:10.4 | HR13 | 84 | -33.9 | -12.9 | -12.6 | 0.3 | -1.02 |
| HR14 | 83 | -12.7 | -12.7 | |||||
| HR15 | 119 | -19.9 | -12.1 | |||||
| B-130 | 18:03:41.00, -30:03:03.0 | HR13 | 77 | -36.6 | -15.6 | -15.6 | 0.2 | -1.23 |
| HR14 | 71 | -15.3 | -15.4 | |||||
| HR15 | 117 | - 23.7 | -15.9 | |||||
| B-134 | 18:03:41.16, -30:02:21.6 | HR13 | 84 | -39.4 | -18.4 | -18.9 | 0.4 | – |
| HR14 | 81 | -19.3 | -19.4 | |||||
| HR15 | 127 | -26.8 | -18.9 | |||||
| F-121 | 18:03:36.41, -30:02:19.8 | HR13 | 58 | -14.1 | -8.7 | -8.8 | 0.2 | -0.99 |
| HR14 | 93 | 4.3 | -8.6 | |||||
| HR15 | 140 | -7.3 | -9.1 |
| Star | [Fe/H] | |||
|---|---|---|---|---|
| B-008 | 4960 | 2.65 | -1.02 | 2.3 |
| B-107 | 4970 | 1.9 | -1.34 | 2.1 |
| B-108 | 4750 | 2.2 | -1.37 | 1.4 |
| B-118 | 5000 | 2.25 | -1.04 | 2.45 |
| B-122 | 5100 | 2.75 | -0.95 | 1.2 |
| B-128 | 4760 | 2.1 | -1.02 | 1.3 |
| B-130 | 5090 | 2.65 | -1.23 | 2.8 |
| F-121 | 4955 | 2.2 | -1.0 | 1.4 |
Individual abundances were determined from the equivalent widths of unblended lines for which reliable oscillator strengths were available from the Gaia-ESO line list (Heiter et al., in prep.). In the limited wavelength regions of these GIRAFFE observations, we made use of 22 lines of the -elements (Mg, Si, Ca, Ti), two lines available for Al, two for Na, two for Ba, three for Eu, one for La and one for Y. For the neutron capture elements we performed spectrum synthesis taking care of including isotopic and hyperfine splitting (HFS) and blending lines to ensure the most reliable results. Our mean elemental abundance measurements are given in Table 3 while the full line-by-line results are provided in Table 4 (online only). We estimate the uncertainties on individual abundances from the quadrature sum of the uncertainties due to the noise in the spectra, and the uncertainties in the stellar parameters and the line-to-line dispersion. These are listed in Table 3.
| star | [Fe/H] | [FeI/H] | [FeII/H] | [NaI/Fe] | [MgI/Fe] | [AlI/Fe] | [SiI/Fe] | [CaI/Fe] | [TiI/Fe] | [YII/Fe] | [BaII/Fe] | [LaII/Fe] | [EuII/Fe] |
|---|---|---|---|---|---|---|---|---|---|---|---|---|---|
| B-008 | –1.02 | –1.02 | –1.03 | 0.68 | 0.23 | 1.0 | 0.30 | 0.25 | 0.46 | 0.35 | 0.45 | 0.70 | 0.70 |
| 0.15 | 0.15 | 0.15 | 0.1 | 0.2 | 0.1 | + 0.1 | 0.2 | +0.1 | 0.2 | 0.1 | +0.15 | 0.15 | |
| –0.15 | –0.15 | –0.15 | –0.1 | –0.2 | –0.1 | –0.1 | –0.2 | –0.1 | –0.3 | –0.1 | -0.2 | –0.15 | |
| B-107 | –1.34 | –1.34 | –1.34 | 0.13 | 0.61 | 0.49 | 0.52 | 0.34 | 0.27 | 0.15 | 0.40 | 0.30 | 0.25 |
| 0.15 | 0.15 | +0.15 | 0.25 | 0.2 | 0.25 | 0.15 | 0.15 | 0.1 | 0.25 | 0.1 | 0.2 | 0.15 | |
| –0.15 | –0.15 | –0.15 | –0.30 | –0.25 | –0.25 | –0.15 | –0.15 | –0.1 | –0.30 | –0.1 | –0.25 | –0.15 | |
| B-108 | –1.37 | –1.37 | –1.37 | –0.23 | 0.63 | 0.26 | 0.18 | 0.38 | 0.37 | 0.15 | 0.10 | 0.35 | 0.40 |
| 0.15 | 0.15 | 0.15 | 0.15 | 0.15 | 0.15 | 0.15 | 0.15 | 0.15 | –0.05 | 0.15 | 0.25 | 0.15 | |
| –0.15 | –0.15 | –0.15 | –0.15 | –0.15 | –0.40 | –0.40 | –0.15 | –0.15 | -0.05 | –0.15 | -0.45 | –0.2 | |
| B-118 | -1.04 | -1.04 | -1.04 | 0.40 | 0.37 | 1.01 | 0.29 | 0.28 | 0.54 | 0.30 | 0.30 | 0.55 | 0.40 |
| 0.15 | 0.15 | 0.15 | 0.1 | 0.1 | 0.1 | 0.1 | 0.15 | 0.15 | 0.2 | 0.1 | 0.1 | 0.15 | |
| –0.15 | –0.15 | –0.15 | –0.1 | –0.1 | –0.1 | –0.1 | –0.15 | –0.15 | –0.30 | –0.1 | –0.1 | –0.15 | |
| B-122 | –0.95 | –0.95 | –0.95 | 0.42 | 0.36 | 0.62 | 0.21 | 0.29 | 0.33 | 0.10 | 0.35 | 0.30 | 0.50 |
| 0.15 | 0.15 | 0.15 | +0.1 | 0.15 | 0.1 | 0.15 | 0.15 | 0.1 | 0.25 | 0.1 | +0.1 | 0.15 | |
| –0.15 | –0.15 | –0.15 | –0.1 | –0.15 | –0.1 | –0.15 | –0.15 | –0.1 | –0.35 | –0.1 | –0.15 | –0.15 | |
| B-128 | –1.02 | –1.03 | –1.03 | 0.20 | 0.34 | 0.82 | 0.21 | 0.50 | 0.25 | 0.40 | 0.80 | 0.30 | 0.0 |
| 0.1 | 0.1 | +0.1 | 0.15 | +0.15 | 0.1 | 0.15 | 0.15 | 0.1 | 0.2 | 0.1 | 0.15 | 0.15 | |
| –0.1 | –0.1 | –0.1 | –0.15 | –0.15 | –0.1 | –0.15 | –0.15 | –0.1 | –0.25 | –0.1 | –0.15 | –0.15 | |
| B-130 | –1.23 | –1.24 | –1.24 | 0.46 | 0.34 | 0.64 | 0.32 | 0.35 | 0.40 | 0.44 | 0.10 | 0.45 | 0.90 |
| 0.15 | 0.15 | 0.15 | 0.15 | 0.25 | 0.2 | 0.2 | 0.15 | 0.1 | 0.25 | 0.1 | 0.2 | 0.15 | |
| –0.15 | –0.15 | –0.15 | –0.25 | –0.25 | –0.2 | –0.2 | –0.15 | –0.1 | –0.30 | –0.1 | –0.2 | –0.15 | |
| F-121 | –1.0 | –0.99 | –1.01 | -0.11 | 0.54 | 0.12 | 0.20 | 0.43 | 0.42 | 0.20 | 0.45 | 0.10 | 0.30 |
| 0.15 | 0.15 | 0.15 | 0.20 | 0.2 | 0.2 | 0.15 | 0.15 | 0.15 | 0.2 | +0.2 | 0.1 | 0.10 | |
| –0.15 | –0.15 | –0.15 | –0.3 | –0.15 | –0.2 | –0.15 | –0.15 | –0.15 | –0.25 | –0.2 | –0.1 | –0.15 |
In general we find comparable stellar abundances to Barbuy et al. (2009), with marginally lower [Fe/H] (by dex) and slightly higher [/Fe] ratios (by dex). These differences can likely be traced to the adopted line-lists and difference in adopted stellar parameters (our and are typically 200 K and 0.6 km s-1, respectively higher). We also report roughly similar abundances for [Na/Fe], [La/Fe] and [Eu/Fe] (which have mean values of dex, dex and dex) but lower Ba abundance compared to Barbuy et al. (2009). The inclusion of hyperfine splitting makes only a small difference to the measurements. Our mean measurement for Ba is , compared to in the original analysis.
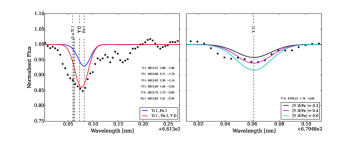
A more striking discrepancy is obtained for Y compared to the analysis of Chiappini et al. (2011). Our mean ratio is compared to in their analysis. Here the difference is largely due to adopted Y lines. In our analysis, we use a single unblended Y ii line at 679.54 nm, whereas the original analysis relied on the Y ii line at 661.37 nm, which they did not realise is severely blended by in particular a Fe line at 661.38nm and a Ti line at 661.36 nm (see Figure 1). We obtain a higher abundance of [Y/Fe] by about +0.6 dex when fitting for [Y/Fe] at 661.37 nm without accounting for the blending lines.
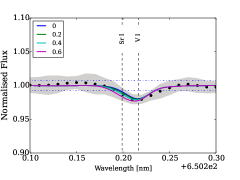
Finally, we argue that no reliable Sr abundance can be inferred from these individual GIRAFFE spectra. Chiappini et al. (2011) relied on the Sr i 650.40 nm line, which in our opinion is not discernible over the noise of the individual spectra and is blended. This feature, for the median combination of all 8 stars is shown in Figure 2, synthesised with 0 – 0.8 dex of [Sr/Fe] enhancement and a fixed [V/Fe] = 0. A good fit is obtained with an [Sr/Fe] = 0.4 given a [V/Fe] = 0. The four Sr lines in the Gaia-ESO line-list available in this wavelength region (640.85 nm, 655.02 nm, 654.68 nm, 661.73 nm, 671.91 nm) are also too weak for abundance purposes. As a result we do not quote any [Sr/Fe] values.
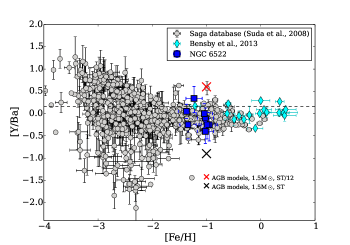
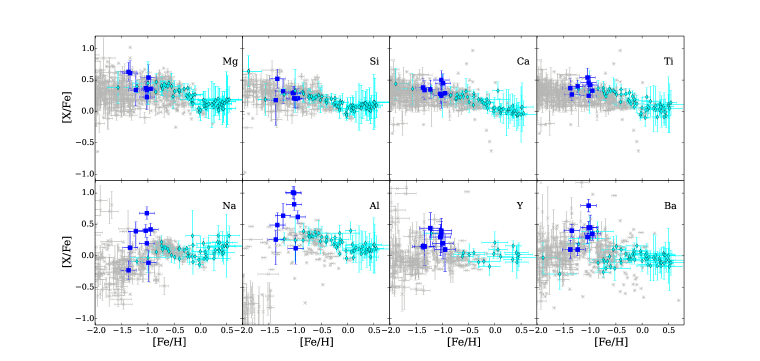
Figure 4 compares our inferred abundance ratios for NGC 6522 to micro-lensed dwarf stars of the bulge from Bensby et al. (2013) as well as typical halo stars (Suda et al., 2008), demonstrating in general a good agreement. The cluster stars show comparable abundances to the bulge for Mg, Si, Ca, Ti, Y and Ba, while the scatter is Na and Al is directly attributable to the Na-Al correlation typical for globular clusters. Our [Y/Fe] and [Ba/Fe] ratios are consistent with other globular clusters at this metallicity (e.g. Johnson et al., 2010). Figure 3 shows the [Y/Ba] of the eight NGC 6522 stars compared to field bulge and halo stars. The cluster stars are not anomalous compared to field stars of similar metallicity, neither in [Y/Ba] nor in their scatter, in contrast to the conclusion by Chiappini et al. (2011).
4 Conclusions
We have re-analysed available GIRAFFE/VLT spectra of eight members of the bulge globular cluster NGC 6522 from the ESO archive. We have paid particular attention to considering the effects of isotopic hyperfine splitting and blending lines on the derived abundances of the -process elements. We also use in some cases on more reliable, cleaner lines. As a result our results are systematically and significantly lower than those reported by Chiappini et al. (2011), which did not consider those effects.
In all cases the NGC 6522 stars display elemental abundances typical of field halo and bulge as well as other globular clusters of similar metallicities. We conclude that neither the normal -process abundances nor the low and fairly constant [Y/Ba] ratios measured in NGC 6522 support a nucleosynthetic origin by rapidly rotating Population III stars. In terms of its chemical composition, NGC 6522 is an unremarkable globular cluster.
Acknowledgments
We appreciate helpful and stimulating discussions with Beatriz Barbuy and Cristina Chiappini. The research has received funding from the European Research Council under the European Union’s Seventh Framework Programme (FP 7) ERC Grant Agreement n. [321035]. MA acknowledges generous funding from the Australian Research Council (grant FL110100012) MA acknowledges generous funding from the Australian Research Council (grant FL110100012). ARC acknowledges funding from European Research Council grant 320360: The Gaia-ESO Milky Way Survey.
References
- Barbuy et al. (2009) Barbuy B., Zoccali M., Ortolani S., Hill V., Minniti D., Bica E., Renzini A., Gómez A., 2009, A&A, 507, 405
- Bensby et al. (2013) Bensby T., Yee J. C., Feltzing S., Johnson J. A., Gould A., Cohen J. G., Asplund M., Meléndez J., Lucatello S., et al. 2013, A&A, 549, A147
- Bessell et al. (1998) Bessell M. S., Castelli F., Plez B., 1998, A&A, 333, 231
- Casey et al. (2013) Casey A. R., Keller S., Alves-Brito A., Frebel A., Da Costa G., Karakas A., Yong D., Schlaufman K., Jacobson H. R., Yu Q., Fishlock C., 2013, ArXiv e-prints
- Chiappini et al. (2011) Chiappini C., Frischknecht U., Meynet G., Hirschi R., Barbuy B., Pignatari M., Decressin T., Maeder A., 2011, Nature, 472, 454
- Gratton et al. (2012) Gratton R. G., Carretta E., Bragaglia A., 2012, AAPR, 20, 50
- Harris (2010) Harris W. E., 2010, ArXiv e-prints
- Johnson et al. (2010) Johnson J. A., Dong S., Gould A., 2010, ApJ, 713, 713
- Ness et al. (2013) Ness M., Freeman K., Athanassoula E., Wylie-de-Boer E., Bland-Hawthorn J., Asplund M., Lewis G. F., Yong D., Lane R. R., Kiss L. L., 2013, MNRAS, 430, 836
- Pignatari et al. (2008) Pignatari M., Gallino R., Meynet G., Hirschi R., Herwig F., Wiescher M., 2008, ApJ, 687, L95
- Skrutskie et al. (2006) Skrutskie M. F., Cutri R. M., Stiening R., Weinberg M. D., Schneider S., Carpenter J. M., Beichman C., Capps R., Chester e. a., 2006, AJ, 131, 1163
- Sneden (1973) Sneden C. A., 1973, PhD thesis, THE UNIVERSITY OF TEXAS AT AUSTIN.
- Suda et al. (2008) Suda T., Katsuta Y., Yamada S., Suwa T., Ishizuka C., Komiya Y., Sorai K., Aikawa M., Fujimoto M. Y., 2008, PASJ, 60, 1159
- Terndrup et al. (1998) Terndrup D. M., Popowski P., Gould A., Rich R. M., Sadler E. M., 1998, AJ, 115, 1476
- Tumlinson (2010) Tumlinson J., 2010, ApJ, 708, 1398