Observations of nitrogen isotope fractionation
in deeply embedded protostars
Abstract
Context. The terrestrial planets, comets, and meteorites are significantly enriched in 15N compared to the Sun and Jupiter. While the solar and jovian nitrogen isotope ratio is believed to represent the composition of the protosolar nebula, a still unidentified process has caused 15N-enrichment in the solids. Several mechanisms have been proposed to explain the variations, including chemical fractionation. However, observational results that constrain the fractionation models are scarce. While there is evidence of 15N-enrichment in prestellar cores, it is unclear how the signature evolves into the protostellar phases.
Aims. The aim of this study is to measure the 14N/15N ratio around three nearby, embedded low- to intermediate-mass protostars.
Methods. Isotopologues of HCN and HNC were used to probe the 14N/15N ratio. A selection of J=3-2 and 4-3 transitions of H13CN, HC15N, HN13C, and H15NC was observed with the Atacama Pathfinder EXperiment telescope (APEX). The 14N/15N ratios were derived from the integrated intensities assuming a standard 12C/13C ratio. The assumption of optically thin emission was verified using radiative transfer modeling and hyperfine structure fitting.
Results. Two sources, IRAS 16293A and R CrA IRS7B, show 15N-enrichment by a factor of in both HCN and HNC with respect to the solar composition. IRAS 16293A falls in the range of typical prestellar core values. Solar composition cannot be excluded for the third source, OMC-3 MMS6. Furthermore, there are indications of a trend toward increasing 14N/15N ratios with increasing outer envelope temperature.
Conclusions. The enhanced 15N abundances in HCN and HNC found in two Class 0 sources () and the tentative trend toward a temperature-dependent 14N/15N ratio are consistent with the chemical fractionation scenario, but 14N/15N ratios from additional tracers are indispensable for testing the models. Spatially resolved observations are needed to distinguish between chemical fractionation and isotope-selective photochemistry.
Key Words.:
Astrochemistry — ISM: abundances — ISM: molecules — Stars: formation – Stars: individual: IRAS 16293-2422, R CrA IRS7B, OMC-3 MMS61 Introduction
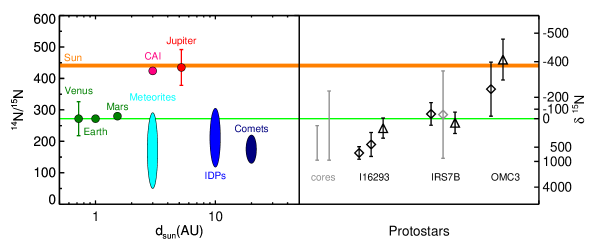
The largest isotopic anomalies in the solar system are found in highly volatile elements like hydrogen, carbon, oxygen, and nitrogen (e.g., Birck, 2004; Anders & Grevesse, 1989). Thereof, the most extreme variations among solar system objects exist in the deuterium-to-hydrogen ratio, D/H, and the ratio of the two stable nitrogen isotopes, 14N/15N***In cosmochemistry, nitrogen isotope ratios are generally reported in per mil deviations from the terrestrial atmospheric standard, denoted where .. Recent results from the Genesis mission (Marty et al., 2011), which sampled the solar wind, have demonstrated that there is a large discrepancy in the nitrogen isotopic composition between the solar system solids and the gas reservoir: The 14N/15N ratios of the terrestrial planets, comets (e.g., Hutsemékers et al., 2005; McKeegan et al., 2006; Bockelée-Morvan et al., 2008; Manfroid et al., 2009; Jehin et al., 2009; Mumma & Charnley, 2011; Shinnaka et al., 2014), meteorites (e.g., Kerridge, 1993; Briani et al., 2009; Bonal et al., 2010), and interplanetary dust particles (IDPs, Messenger, 2000; Floss et al., 2006) are significantly enhanced compared to the Sun (14N/15N , Marty et al., 2011) and Jupiter (, Owen et al., 2001; Fouchet et al., 2004; Abbas et al., 2004). The derived ratios for the Earth’s atmosphere (272, e.g., Junk & Svec, 1958; Mariotti, 1983), Venus (Hoffman et al., 1979), and the interior of Mars (Mathew & Marti, 2001) are very similar and also lie within the range spanned by most primitive meteorites (e.g., Fig. 2 from Meibom et al., 2007). The nitrogen isotopic composition of the Sun and Jupiter, on the other hand, is substantially 15N-poorer (Marty et al., 2011; Hashizume et al., 2000) and believed to be representative of the presolar nebula. This idea is supported by the results from an isotopic measurement of a high-temperature condensate – titanium nitride (TiN), named osbornite – in a calcium-aluminum-rich inclusion (CAI) of the “Isheyevo” meteorite. CAIs are believed to be the first solids that condensated from the gas of the presolar nebula. The 14NN ratio measured from this osbornite (, Meibom et al., 2007) is therefore interpreted as reflecting the nitrogen isotope composition of the solar nebula at the time of CAI formation ago (Connelly et al., 2012).
The aim of this paper is to study the 14N/15N ratio around low-mass protostars to investigate whether fractionation of nitrogen isotopes occurs in the early phases of star formation and to better understand what mechanisms could be responsible for the solar system heterogeneity.
1.1 15N-enrichments in primitive solar system matter
Meteorites, interstellar dust particles, and comets represent the most pristine solar system material. For meteorites, the nitrogen isotope composition is highly variable among the different classification groups, among meteorites belonging to the same group, and even within individual meteorites (e.g., Alexander et al., 2007; Bonal et al., 2010). The heaviest nitrogen isotope signature in any solar system material was measured to date in the “Isheyevo” chondrite (14N/15N , Briani et al., 2009; Bonal et al., 2010). However, the nitrogen isotope composition in Isheyevo is also extremely variable, ranging from an almost solar-like () to a very 15N-heavy isotopic composition. The 15N-enrichment consists of two components, a diffuse background enrichment () and localized micron-sized zones with extremely high 15N-anomalies, so-called hotspots. Generally, the highest 15N-enrichments seem to be found in the most pristine meteoritic components (Busemann et al., 2006; Alexander et al., 2007; Briani et al., 2009; Bonal et al., 2010). The carrier of the signature is most likely carbonaceous (Bonal et al., 2010), but the exact functional groups carrying the 15N-enrichment have not yet been identified.
Interplanetary dust particles (IDPs) are collected in the stratosphere of the Earth and believed to be of cometary or potentially asteroidal origin. They show similar 15N-characteristics as chondrites, with a modest diffuse enrichment and hotspots, but with generally more moderate 15N-enhancements (Busemann et al., 2006; Floss et al., 2006). The “Stardust” samples from comet 81P/Wild-2 have bulk nitrogen isotope compositions that cluster around the terrestrial composition, but moderate enhancements are also measured (McKeegan et al., 2006). Hotspot values on submicrometer scale are similar to IDPs. An isotopically light component, consistent with the solar value, is also found in the Wild-2 particles, which is not the case for IDPs.
The average 14N/15N ratio from CN spectroscopy in a sample of comets is (Manfroid et al., 2009) with slight differences for Jupiter family (, probable Kuiper belt origin) and Oort cloud () comets. These results are consistent with the 14N/15N ratio from HCN measurements by Bockelée-Morvan et al. (2008) in the comets “Hale-Bopp” and “Holmes” (see also the review by Jehin et al., 2009) as well as measurements from NH2 in comet C/2012 S1 (ISON, , Shinnaka et al., 2014) and the average spectrum of 12 comets (, Rousselot et al., 2014).
An overview of 14N/15N ratios in solar system bodies from the literature is provided in Table 7 in the appendix.
1.2 Proposed scenarios: chemical fractionation vs. isotope selective photodissociation
| Source | HCN | HNC | CN | NH3 | NH2D | N2H+ | Remarks |
|---|---|---|---|---|---|---|---|
| L1544 | prestellar core | ||||||
| L1498 | prestellar core | ||||||
| L183 | prestellar core | ||||||
| L1521E | prestellar core | ||||||
| L1521F | prestellar core | ||||||
| Barnard 1 | |||||||
| NGC1333 IRAS4 | protostar | ||||||
| NGC1333 DCO+ | |||||||
| NGC1333 | |||||||
| L134N(S) | |||||||
| L1689N | |||||||
| Cha-MMS1 | |||||||
| IRAS 17233–3606 | HII region | ||||||
| DR 21 | HII region | ||||||
| Orion KL | |||||||
| Orion Bar | PDR |
a Hily-Blant et al. (2013a) - the range reflects spatial variations within the core, b Hily-Blant et al. (2013b), c Gerin et al. (2009) based on 15NH2D observations at the IRAM 30m, d Bizzocchi et al. (2013), revised from the previously published value of (Bizzocchi et al., 2010), e Milam & Charnley (2012), f Ikeda et al. (2002), g Daniel et al. (2013), h Lis et al. (2010) based on observations of 15NH3 inversion lines with the Green Bank Telescope, i reported in Milam & Charnley (2012) based on Tennekes et al. (2006), j Adande & Ziurys (2012)
| Source | RA | Dec | Class | ||||
|---|---|---|---|---|---|---|---|
| [h m s] | [] | [km s-1] | [pc] | [L⊙] | [M⊙] | ||
| OMC-3 MMS6 | 05:35:23.5a | 05:01:32.0a | 10.0 | intermed.-mass (Class 0) | 450 | 60 | 36 |
| Elias 29 | 16:27:09.4b | 24:37:18.6b | 5.0 | Class I | 125 | 14.1 | 0.04 |
| IRAS 16293A | 16:32:22.87c | 24:28:36.4c | 3.0 | Class 0 | 120 | 27 | 5.4 |
| R CrA IRS7B | 19:01:56.4d | 36:57:28.3d | 5.6 | transitionary Class 0/I | 130 | 4.7 | 2.2 |
A variety of processes have been proposed to explain the observed nitrogen isotope heterogeneity, including Galactic chemical evolution (GCE, e.g., Adande & Ziurys, 2012, and references therein), isotope-selective N2 photodissociation (Clayton, 2002; Lyons et al., 2009; Heays et al., 2014), and chemical fractionation (Terzieva & Herbst, 2000; Rodgers & Charnley, 2008a, b; Wirström et al., 2012; Hily-Blant et al., 2013a).
The term “Galactic chemical evolution” refers to a scenario in which the observed 14N/15N ratio variations are the result of an enrichment of the interstellar medium (ISM) with the products of stellar nucleosynthesis over time. GCE models predict the 14N/15N ratio to vary with distance from the Galactic center as a result of different production mechanisms for 14N and 15N, the details of which are not yet fully understood (see discussion and references in Adande & Ziurys, 2012). Observational support comes from surveys of the nitrogen isotopic composition of the Galaxy (by, e.g., Linke et al., 1977; Wannier et al., 1981; Guesten & Ungerechts, 1985; Dahmen et al., 1995; Wilson, 1999; Adande & Ziurys, 2012). Most of these studies found a radial gradient in the 14N/15N ratio of the Galaxy, arguing for Galactic evolution as the main cause for deviations in the isotopic composition of different star-forming regions. However, significant source-to-source variations within individual clouds (e.g., Ikeda et al., 2002) as well as evidence for spatial variations in prestellar cores (Hily-Blant et al., 2013a) hint at local processes being more important for the nitrogen isotope composition of the protosolar disk than Galactic inheritance.
Liang et al. (2007) demonstrated that isotopically selective photodissociation of N2 plays an important role in the explanation of the nitrogen isotope anomaly inferred in the upper atmosphere of Titan from HCN observations (Niemann et al., 2005). The radiation field component corresponding to the dissociation energy of 14N2 cannot penetrate as deep into the atmosphere as the one for 14N15N, because of 14N2 being more abundant than 14N15N, an effect which is referred to as photochemical self-shielding. To what extent N2 self-shielding could have affected the nitrogen isotope composition of the protosolar nebula is not yet clear, but is currently being investigated (e.g., Lyons et al., 2009; Bertin et al., 2013). Li et al. (2013) and Heays et al. (2014) have recently presented photodissociation rates for 14N2 and 14N15N . In addition, Heays et al. (2014) have incorporated these rates into chemical models with conditions simulating an interstellar cloud and a protoplanetary disk with grain growth. Their results show 15N-enhancements by up to a factor of 10 in HCN in the protoplanetary disk model. Based on these results they argue that the observed nitrogen fractionation in protostellar environments could be caused by a combination of chemical and photolytic reactions.
As for chemical fractionation, the astrochemical gas-grain models by Rodgers & Charnley (2008a) predict a considerable 15N-enhancement for different nitrogen-bearing molecules in the gas phase of dense cloud cores through isotope exchange reactions in low-temperature chemistry. Their results indicate that the fractionation mechanisms for nitriles, i.e., molecules bearing the nitrile functional group (-CN), and nitrogen hydrides (-NH) are different. The slow route () through the dissociative ionization of N2, leading to N+, is responsible for the fractionation in nitrogen hydrides, including ammonia (NH3) and diazenylium (N2H+). The more rapid route () starts from atomic nitrogen and drives the 15N-enrichment of (iso-)nitriles and associated species such as cyanide (CN), hydrogen cyanide (HCN), and hydrogen isocyanide (HNC). The largest 15N-enhancement in this chemical fractionation model is predicted for nitrile species. With substantial 15N-enrichments predicted by both chemical fractionation and photodissociation models, species like HCN should therefore be particularly good tracers of a potential isotope fractionation in nitrogen. Refined chemical fractionation models by Wirström et al. (2012) include the dependence of the ion-molecule reactions on the H2 spin-state and show that a large 15N-enhancement is not necessarily expected to correlate with an extreme D-enrichment, depending on the carriers of the two signatures. The lack of a correlation between the 15N and D anomalies measured in meteorites had previously often been invoked as an argument against an inheritance of the isotopic signature measured in primitive solar system matter from local cloud or disk processes in early phases of solar system formation (e.g., Aléon, 2010).
Observations of the 14N/15N ratio in individual low-mass pre- and protostellar sources in the literature are scarce and have so far led to inconclusive results about whether or not fractionation of nitrogen isotopes occurs in pre- and protostellar environments. Moreover, it still an open question whether chemical fractionation or isotope-selective photodissociation could explain the observed solar system variations. Results from HCN observations of three dense cores by Ikeda et al. (2002) show large variations between the sources and the result for L1521E () is consistent with the chemical fractionation scenario. Gerin et al. (2009) on the other hand derive 14N/15N ratios of from 15NH2D in several interstellar clouds that are consistent with the solar composition and thus argue against nitrogen isotope fractionation. Follow-up observations by Lis et al. (2010) using measurements of 15NH3 in Barnard 1 and NGC 1333 yield ratios that fall in between the solar and terrestrial values. Bizzocchi et al. (2010) reported a ratio of from N15NH+ observations toward the prestellar core L1544, which was recently revised to be as high as based on new observations of 15NNH+ (Bizzocchi et al., 2013), implying a depletion of 15N in N2H+. Results from mapping of HCN isotopologues in the two prestellar cores L183 and L1544 by Hily-Blant et al. (2013a) show an overall enhancement of 15N as well as some spatial variations within each source, strongly favoring a fractionation scenario. For L1544, Hily-Blant et al. (2013a) find an enhancement of 15N in HCN (), but there are no indications for isotope fractionation in CN (, Hily-Blant et al., 2013b). These differences likely arise from the variety of molecular species and isotopologues used to probe the nitrogen isotope ratio in different sources. For example, the low 14N/15N ratios inferred from nitriles like HCN seem to support the chemical fractionation scenario, while 14N/15N ratios derived from nitrogen hydrides, like NH3 and N2H+, show no evidence for nitrogen isotope fractionation or even hint at a 15N-depletion. Wirström et al. (2012) and Hily-Blant et al. (2013b) proposed refined chemical fractionation scenarios with different fractionation paths that may be able to explain the discrepancies between the nitrogen isotope composition seen in individual molecular tracers. To constrain the fractionation models, it is thus important to measure isotope ratios from an entire set of species. However, the prestellar core L1544 and the very young Class 0 binary B1b are so far the only sources for which comprehensive observational data sets of 14N/15N ratios from both nitriles and nitrogen hydrides exist (cf. Table 1). While evidence for a 15N-enrichment in some molecules is found for L1544 (Hily-Blant et al., 2013a), the results on B1b by Daniel et al. (2013) show no evidence for nitrogen isotope fractionation in any class of molecules. Whether this difference is caused by the more evolved status of B1b, a source-to-source variation, or any other effect, is unclear and needs to be investigated on a larger source sample. A similar data set is not yet available for other sources, in particular not for more evolved evolutionary stages.
In contrast to previous studies, which mainly focused on the prestellar core phase, we present in this paper measurements of the nitrogen isotope composition in the gas around three Class 0 YSOs from HCN and HNC isotopologues. The aim of this work is to investigate whether signatures of nitrogen isotope fractionation also occur in the embedded protostellar stages. The paper is organized as follows: Section 2 describes the observations and the data reduction procedure. The results are presented in Sect. 3. They are compared to previous results and their implications are discussed in Sect. 4. Conclusions are presented in Sect. 5.
2 Observations and data reduction
2.1 Observations
| Species | Transition | Frequency | ||
| [GHz] | [K] | [s-1] | ||
| APEX-1 | ||||
| D13CN | J = 3–2 | 213.51987 | 20.49 | -3.36216 |
| DCN | J = 3–2 | 217.23854 | 20.85 | -3.33964 |
| H13C15N | J = 3–2 | 251.17523 | 24.11 | -3.15217 |
| HC15N | J = 3–2 | 258.15700 | 24.78 | -3.11641 |
| H13CN | J = 3–2 | 259.01180⋆⋆footnotemark: ⋆ | 24.86 | -3.11216 |
| HN13C | J = 3–2 | 261.26331 | 25.08 | -3.18837 |
| HCN | J = 3–2 | 265.88643 | 25.52 | -3.07662 |
| H15NC | J = 3–2 | 266.58780 | 25.59 | -3.16196 |
| HNC | J = 3–2 | 271.98114 | 26.11 | -2.94523 |
| DCN | J = 4–3 | 289.64492 | 34.75 | -2.94907 |
| APEX-2 | ||||
| HC15N | J = 4–3 | 344.20011 | 41.30 | -2.72583 |
| H13CN | J = 4–3 | 345.33977⋆⋆footnotemark: ⋆ | 41.43 | -2.72161 |
| HN13C | J = 4–3 | 348.34027 | 41.80 | -2.79774 |
| DCN | J = 5–4 | 362.04575 | 52.13 | -2.64860 |
| HNC | J = 4–3 | 362.63030 | 43.51 | -2.55463 |
Observations of HCN and HNC isotopologues were carried out using the Atacama Pathfinder EXperiment telescope222APEX is a collaboration between the Max-Planck-Institut für Radioastronomie, the European Southern Observatory, and the Onsala Space Observatory. (APEX, Güsten et al., 2006) in service mode. Wobbler switching with an amplitude of 150 was used throughout. A detailed overview on the observations is provided in Table 6 in the appendix.
The source sample consists of three Class 0 YSOs, IRAS 16293A, R CrA IRS7B, and OMC-3 MMS6, and the Class I protostar Elias 29. The coordinates and properties of the sources can be found in Table 2. The targets were selected to cover different source properties: IRAS 16293-2422 is an extremely well-studied (e.g., Blake et al., 1994; van Dishoeck et al., 1995; Schöier et al., 2002; Takakuwa et al., 2007; Caux et al., 2011; Jørgensen et al., 2011; Pineda et al., 2012), isolated proto-binary in Oph with a hot corino and known deuterium fractionation (e.g., Loinard et al., 2000; Persson et al., 2013). Our observations were pointed at the A component, IRAS 16293A (Jørgensen et al., 2011). R CrA IRS7B is located in the vicinity of the Herbig star R CrA and therefore exposed to a strong external radiation field (Lindberg & Jørgensen, 2012). OMC-3 MMS6 is an intermediate-mass protostar (Johnstone et al., 2003) in the vigorous environment of the Orion star-forming complex, also exposed to enhanced irradiation (Jørgensen et al., 2006). Elias 29 (e.g., Boogert et al., 2002) is one of the most luminous protostars in the Oph cloud and the most evolved source in our sample.
IRAS 16293A was observed in H13CN ( = 3-2 and 4-3), HC15N (3-2 and 4-3), H13C15N(3-2), DCN(3-2, 4-3, and 5-4), and D13CN(3-2) on 2012-04-01 and between 2012-06-04 and 2012-06-13 (project 089.F-9316A, PI J. Jørgensen). The observations of HN13C(3-2) and H15NC(3-2) were carried out on 2013-08-19/20 (project 092.F-9324A, PI S. Wampfler). OMC-3 MMS6, Elias 29, and R CrA IRS7B were observed in HCN(3-2), H13CN (3-2 and 4-3), HC15N(3-2), HNC(3-2), HN13C (3-2 and 4-3), and H15NC(3-2) with APEX between 2012-08-16 and 2012-10-01 (project 090.F-9317A, PI S. Wampfler). The frequencies of the transitions and the molecular data are provided in Table 3.
The Swedish Heterodyne Facility Instrument (SHeFI, Vassilev et al., 2008) single-sideband SIS receivers APEX-1 ( GHz) and APEX-2 ( GHz) were used in combination with the eXtended bandwidth Fast Fourier Transform Spectrometer (XFFTS). Two XFFTS units with an instantaneous bandwidth of 2.5 GHz each are available, which partially overlap and offer full coverage of the 4 GHz IF bandwidth of the SHeFI receivers. The large bandwidth of this backend type permits several isotopologues to be observed simultaneously, thereby reducing the calibration uncertainty from the absolute value down to the relative calibration uncertainty across the band. For IRAS 16293A, H13CN (3-2) and HC15N (3-2) were observed in a combined setting, as were H13CN (4-3) and HC15N (4-3). In the case of OMC-3 MMS6, Elias 29, and R CrA-IRS7B, the observations of H13CN (3-2), HC15N (3-2), and HN13C (3-2) were carried out simultaneously. Moreover, H15NC (3-2) and HCN(3-2) were observed together. H13CN (4-3) and HN13C (4-3) were also jointly measured.
| Transition | Tpeak | Trms | |||||
| [K] | [K km s-1] | [km s-1] | [km s-1] | [K] | [K km s-1] | [K km s-1] | |
| IRAS 16239A | |||||||
| HCN(3-2) | 9.66 | 27.52 | 0.04 | 0.03 | 2.3 | ||
| H13CN(3-2) | 0.68 | 3.24 | 0.03 | 0.02 | 0.3 | ||
| HC15N(3-2) | 0.27 | 1.37 | 0.04 | 0.03 | 0.1 | ||
| H13CN(4-3) | 1.08 | 5.56 | 0.07 | 0.04 | 0.8 | ||
| HC15N(4-3) | 0.44 | 2.02 | 0.06 | 0.04 | 0.3 | ||
| DCN(3-2) | 0.87 | 2.77 | 0.05 | 0.03 | 0.2 | ||
| DCN(4-3) | 0.76 | 2.45 | 0.05 | 0.03 | 0.4 | ||
| DCN(5-4) | 0.80 | 3.04 | 0.09 | 0.05 | 0.4 | ||
| D13CN(3-2) | - | - | - | - | 0.02 | - | - |
| HNC(3-2) | 6.97 | 12.93 | 0.02 | 0.009 | 1.1 | ||
| HNC(4-3) | 5.57 | 11.00 | 0.11 | 0.05 | 0.9 | ||
| HN13C(3-2) | 0.40 | 0.77 | 0.05 | 0.03 | 0.1 | ||
| H15NC(3-2) | 0.09 | 0.22 | 0.03 | 0.01 | 0.03 | ||
| R CrA IRS7B | |||||||
| HCN(3-2) | 6.59 | 0.02 | 0.01 | 2.4 | |||
| H13CN(3-2) | 0.90 | 0.04 | 0.02 | 0.2 | |||
| HC15N(3-2) | 0.24 | 0.04 | 0.02 | 0.04 | |||
| H13CN(4-3) | 0.46 | 0.04 | 0.01 | 0.1 | |||
| HNC(3-2) | 6.35 | 0.2 | 0.07 | 1.2 | |||
| HN13C(3-2) | 0.45 | 0.04 | 0.02 | 0.06 | |||
| H15NC(3-2) | 0.14 | 0.02 | 0.006 | 0.02 | |||
| HN13C(4-3) | 0.23 | 0.04 | 0.01 | 0.05 | |||
| OMC-3 MMS6 | |||||||
| HCN(3-2) | 3.25 | 0.01 | 0.01 | 1.09 | |||
| H13CN(3-2) | 0.51 | 0.03 | 0.01 | 0.05 | |||
| HC15N(3-2) | 0.10 | (fixed) | 0.03 | 0.01 | 0.01 | ||
| H13CN(4-3) | 0.18 | (fixed) | 0.06 | 0.02 | 0.03 | ||
| HNC(3-2) | 5.55 | 0.19 | 0.06 | 0.57 | |||
| HN13C(3-2) | 0.46 | 0.03 | 0.008 | 0.03 | |||
| H15NC(3-2) | 0.09 | 0.01 | 0.003 | 0.005 | |||
| HN13C(4-3) | - | - | - | - | 0.01 | - | - |
2.2 Data reduction
The data reduction was carried out using the GILDAS-CLASS software package333http://www.iram.fr/IRAMFR/GILDAS/. The data were calibrated to scale using the default forward efficiency of 0.95 (Dumke & Mac-Auliffe, 2010) for APEX, and beam efficiencies444values from http://www.apex-telescope.org/telescope/efficiency of 0.75 for APEX-1 and 0.73 for APEX-2, respectively. The half-power beam width of APEX is 27 at 230 GHz and 18 at 345 GHz.
Several observations were split between different observing dates (cf. Table 6). Before averaging those data sets, we checked for deviations in the intensity and line profile on strong lines present in the spectrum, and, if the signal-to-noise ratio for the individual observations permits, also on our target lines. The H15NC(3-2) observations from R CrA IRS7B carried out on the 09-30-2012 show substantially larger deviations than the calibration uncertainty () when compared to other days and this dataset was consequently discarded. Deviations in the line profiles between different days also occur for the detected main isotopologues lines HCN and HNC in Elias 29 (rarer isotopologues are not detected). Moreover, the line profiles are a mixture of absorption and emission, which could be an indication for emission in one of the off positions (wobbler switching mode). Therefore, we do not report integrated intensities for Elias 29.
A potential contamination from the off positions for the other sources was assessed by re-pipelining some data sets using only one or the other off position for H13CN and H13CO+, a stronger line in the same frequency setup. The resulting spectra, which can be found in appendix A, were then examined for differences. There is no evidence for a substantial emission from the off positions.
First order baselines were applied to the individual scans before averaging them. In particular, the DCN(5-4) spectrum suffers from standing waves, which cannot easily be fitted with a sinusoidal baseline, as amplitude and period change. Therefore, the first order polynomial baseline fits were applied locally whenever required. For lines that were covered by both XFFTS units (overlapping spectral range), the processed spectra from the individual parts were finally averaged after visual inspection.
3 Results
3.1 Line intensities
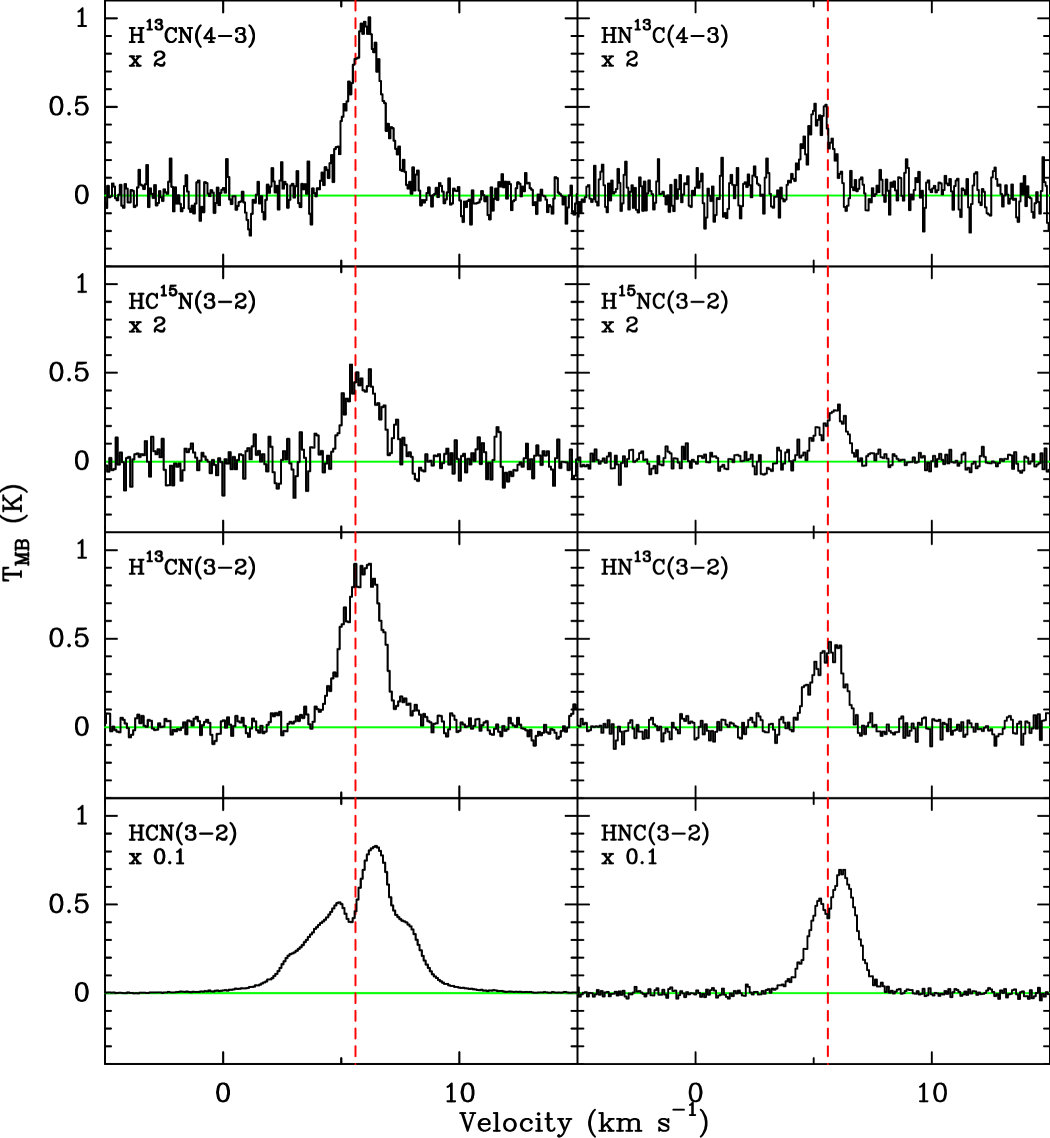
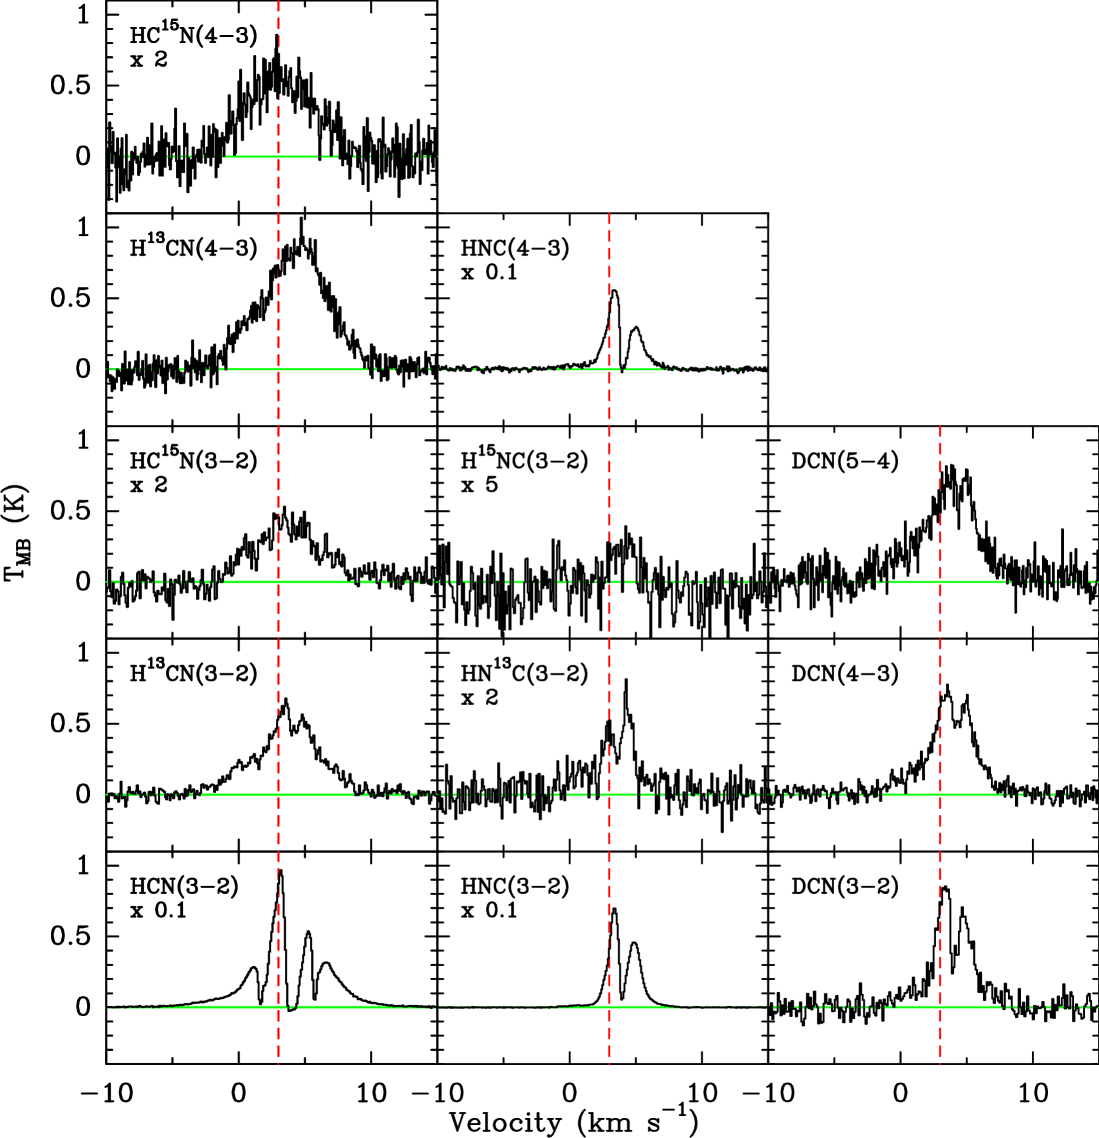
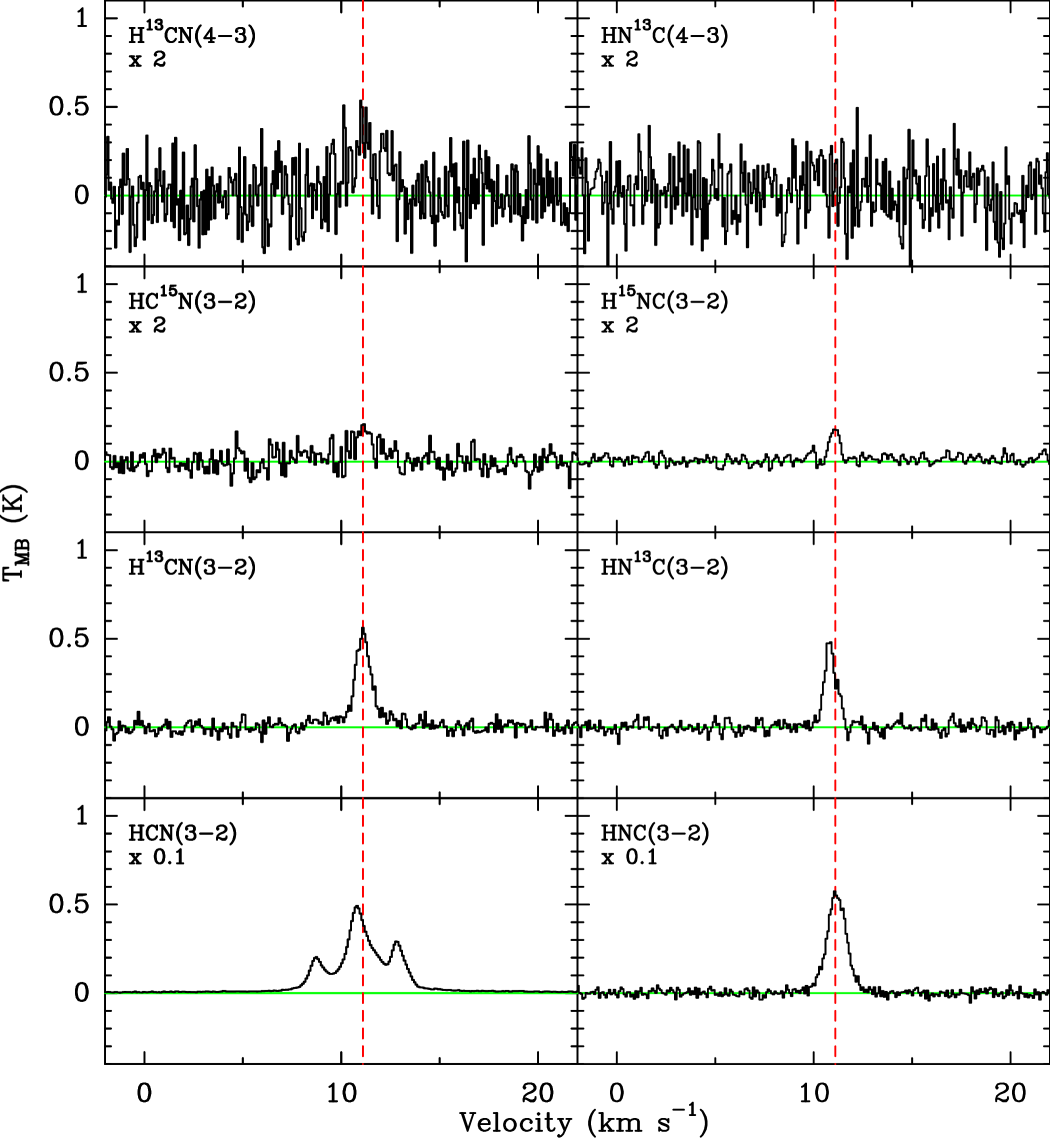
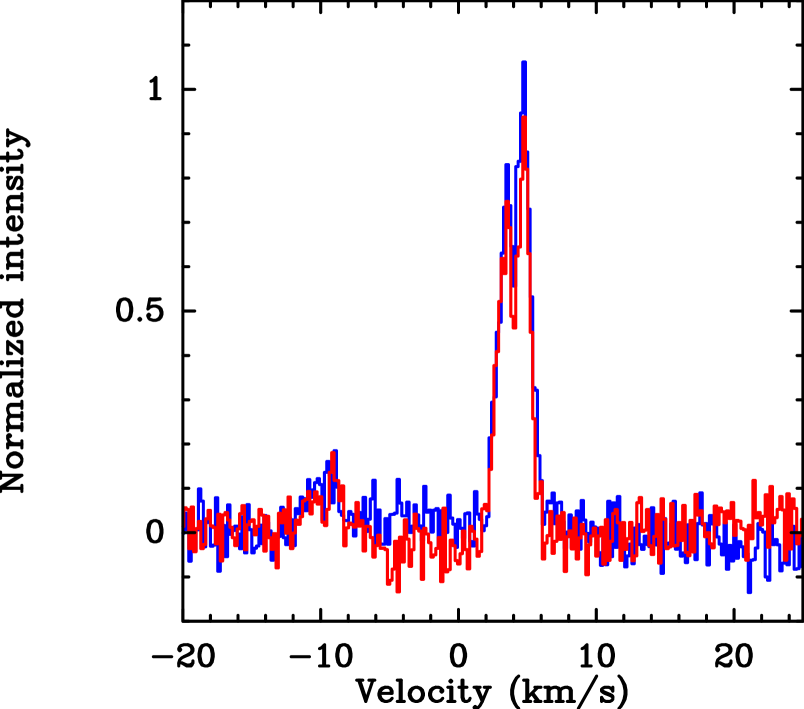
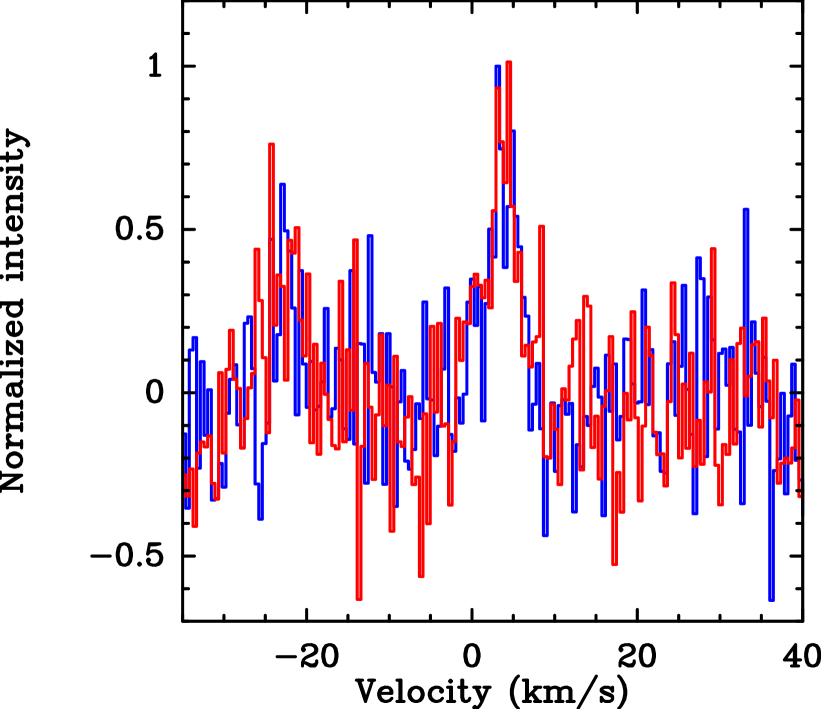
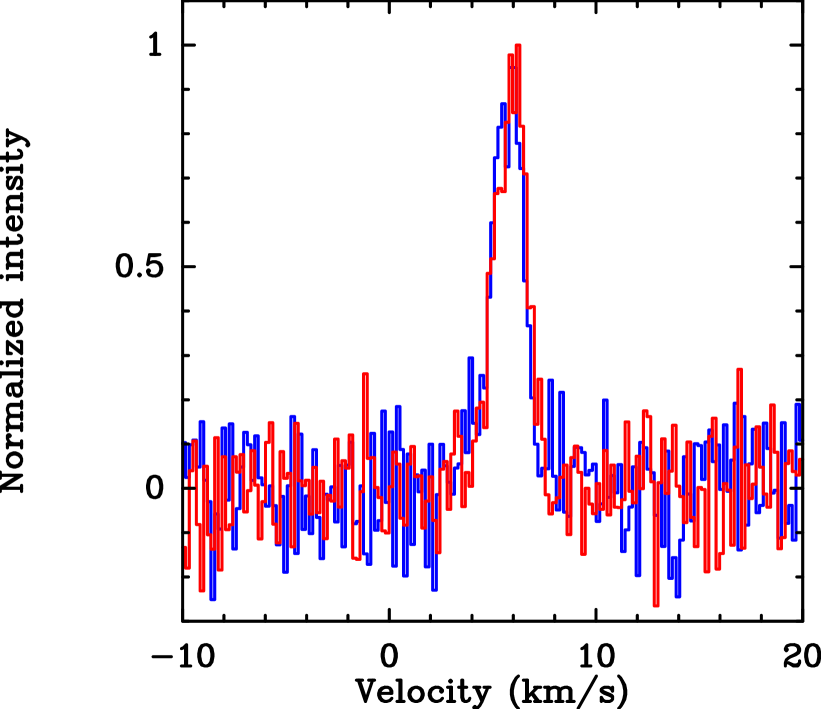
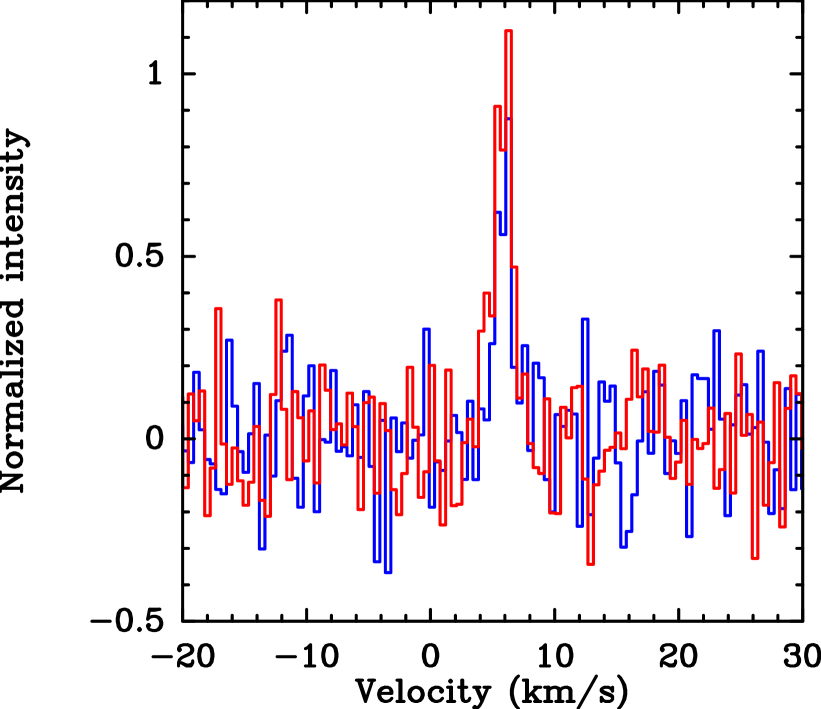
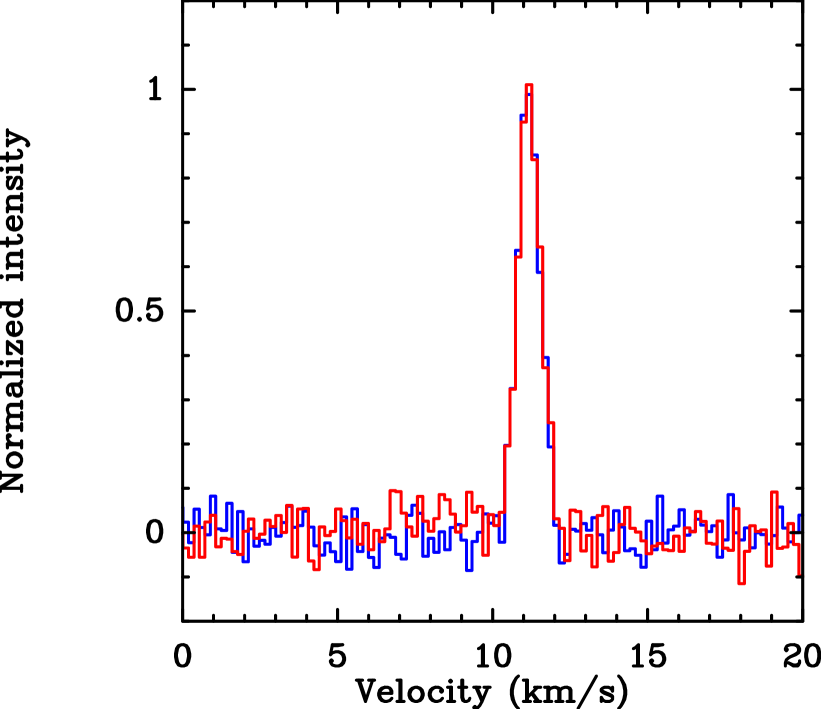
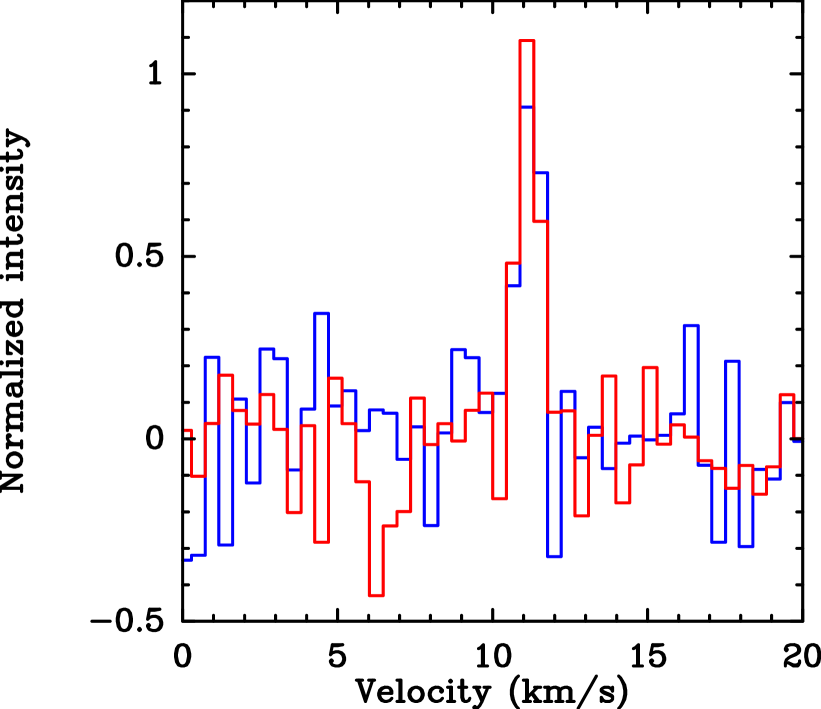
The line intensities were obtained by Gaussian fitting except for IRAS 16293A, because the line shapes of this source differ substantially from a simple Gaussian profile (cf. Fig. 1). For IRAS 16293A, the intensities were derived from integrating over a velocity range around the source velocity ( for broad lines and for narrow lines). Table 4 lists the resulting integrated line intensities, widths, and the obtained noise level (rms). The spectra from R CrA IRS7B and OMC-3 MMS6 are shown in Figs. 2 and 3, respectively.
While the HCN(3-2) line has prominent outflow wings in IRAS 16293A and OMC-3 MMS6, the line width of HNC(3-2) is narrower and does not feature the broad wings at the obtained signal-to-noise ratio.
For IRAS 16293A, H13C15N(3-2) and D13CN(3-2) were targeted as well, but not detected at the achieved noise level. The H13C15N(3-2) was only observed for a fraction of the time intended, and the sideband was changed during the observation because of a better receiver performance in the upper sideband. Unfortunately, the upper sideband tuning suffers from a tuning instability, which went unnoticed during the observations. A reflection from the tuning instability shows up in one channel at the tuning frequency, and a reliable determination of the noise level is therefore not possible. Hence, we do not give an upper limit on the H13C15N(3-2) intensity.
In the Class I source Elias 29, the only lines detected are HCN(3-2) and HNC(3-2), which are factors of 50-100 times weaker than the same lines from the Class 0 targets. Therefore, none of the rarer isotopologues are detected in Elias 29 at the achieved rms, maybe because of the much smaller envelope mass compared to the Class 0 sources in the sample. Both HCN(3-2) and HNC(3-2) have a line profile that shows emission at velocities higher than the source velocity, and absorption at the lower velocities, which could either be a real source feature or indicate that there was some molecular emission at the off position.
3.2 14N/15N isotopic ratios
Isotope ratios can generally be measured from molecular lines at sub-millimeter wavelengths using three different approaches, each with its advantages and caveats:
-
1.
Singly substituted molecules: The 14N/15N ratio can be measured from, e.g., CN isotopologues (C15N Adande & Ziurys, 2012; Hily-Blant et al., 2013b), N2H+ isotopologues (15NNH+, 15NNH+, Womack et al., 1992; Bizzocchi et al., 2010, 2013) or ammonia isotopologues (15NH3, Guesten & Ungerechts, 1985; Lis et al., 2010). The advantage of this method is that the main isotopologue is usually abundant and thus its lines are strong. On the other hand, the high abundance often implies a high optical depth, which must be accounted for using radiative transfer modeling. If the molecular transition has a resolved hyperfine structure pattern, the intensity ratios of the hyperfine transitions can also be used to infer and correct for the optical depth.
-
2.
Doubly substituted molecules: An alternative to the often optically thick main isotopologues are molecules with two atoms replaced by a less abundant isotope, like the ammonia isotopologue 15NH2D (Gerin et al., 2009). However, the lines of such doubly substituted molecules are often very weak because of their low abundance.
-
3.
Double isotope method: The nitrogen isotope ratio can also be measured from two singly substituted molecules, e.g., H13CN and HC15N or HN13C and H15NC, avoiding the main isotopologue. However, in this example the 12C/13C ratio needs to be known from independent measurement or an assumption has to be made.
Using the double isotope method and assuming that all lines are optically thin, which will be discussed in Sect. 3.3, the 14N/15N ratio can be obtained from the H13CN and HC15N integrated intensities using the relation
| (1) |
and from HNC isotopologues accordingly. For IRAS 16293A, the non-detection of D13CN hampers a direct determination of the 12C/13C from D13CN and DCN, but only provides a upper limit of . Because no 12C/13C ratio measurements for our sources are available from the literature, we assume the local standard ISM value of 69 (Wilson, 1999; Milam et al., 2005). The resulting ratios are illustrated in Fig. 4, together with solar system measurements from the literature, and listed in Table 5. The table also includes the ratio from the integrated intensities of H13CN(4-3) and HC15N(4-3) reported in Watanabe et al. (2012). The H13CN(4-3) line may have a contribution of SO2(), but given that the isotopic ratios derived from H13CN(3-2) and (4-3) in IRAS 16293A agree well, the contamination is expected to be minor in this source. For the other sources, H13CN(4-3) was not used in the determination of the 14N/15N ratio, just as a constraint for the radiative transfer models.
| Source | |||
|---|---|---|---|
| IRAS 16293A | |||
| R CrA IRS7B | |||
| OMC3 MMS6 | - |
The smallest error is expected on the ratio inferred from H13CN(3-2) and HC15N(3-2) for all sources as well as the H13CN(4-3) and HC15N(4-3) for IRAS 16293A, because the lines were measured simultaneously. The 14N/15N ratios from the HNC isotopologues are more uncertain, as the involved lines were observed in two individual spectral setups. For the errors, we use a combined error from the intensity measurement and the calibration uncertainty. The error on the integrated intensity is taken from the uncertainty in the fit of the area under the Gaussian profile, provided by the CLASS software, for R CrA IRS7B and OMC-3 MMS6, and for IRAS 16293A calculated as where is the full width at half maximum of the line (assumed to be the same as that of a Gaussian fit to the line), is the velocity resolution of the spectrum, and is the noise level. For the calibration error , we used the calibration uncertainties on the integrated intensity provided in the APEX calibration report (Dumke & Mac-Auliffe, 2010) of 8.3% and 14.1% for APEX-1 and APEX-2, respectively. The overall error on a line intensity is then the combination of the two errors, , and propagated on to the intensity ratio using regular error propagation. Even though some lines were measured in a joint spectral setup, the full calibration uncertainty is included in the determination of all errors. In the cases where the 14N/15N ratios are derived from HCN isotopologues, the errors listed should therefore be an upper limit on the uncertainty.
3.3 Optical depth considerations
3.3.1 Hyperfine structure fitting for IRAS 16293A
The assumption that the lines, in particular H13CN(3-2), are optically thin and hence their intensity is a direct measure of the number of molecules, needs to be verified.
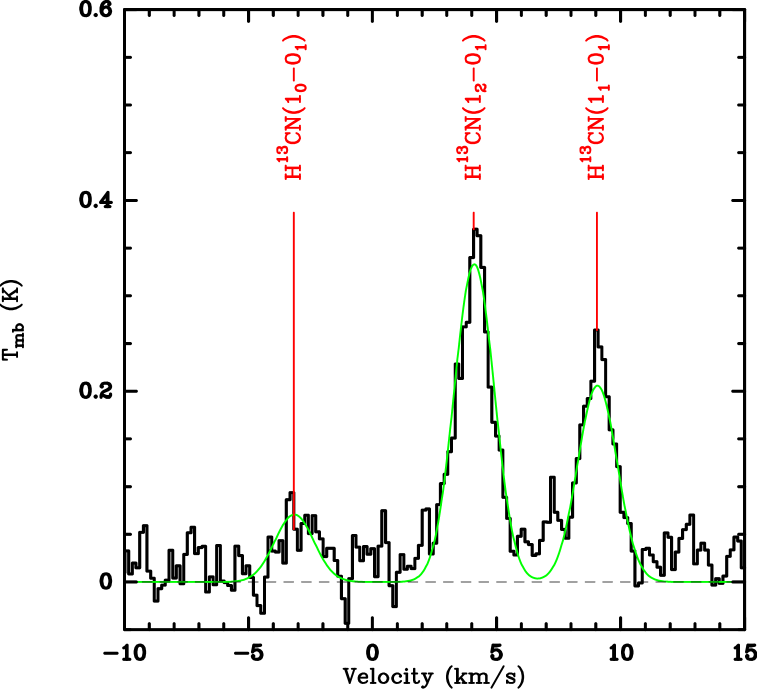
For IRAS 16293-2422, we have a H13CN(1-0) spectrum (Jørgensen et al., 2004) from the SEST telescope555The Swedish-ESO 15m Submillimeter Telescope (SEST) was decommissioned in 2003. with clearly resolved hyperfine structure (cf. Fig. 5, using a main beam efficiency of 0.75). The pointing is slightly different ( = 16:32:22.80, = 24:28:33.0) from our recent observations, but given the large beam the spectrum should still provide an estimate of the opacity. The three hyperfine transitions were fitted using the “HFS method” of the CLASS software to derive the opacity. The HFS routine fits Gaussians to all hyperfine components simultaneously under the assumption of a common excitation temperature, with relative positions and intensities provided by the user (see the CLASS manual or appendix A of Hily-Blant et al., 2013a, for more details). The best fit, illustrated in Fig. 5, yields an opacity for the main component of and hence the line is optically thin.
3.3.2 Radiative transfer modeling
The optical depth on higher excited lines can be larger than the opacity of H13CN(1-0). Therefore, line radiative transfer models can be used as an alternative method to estimate the optical depth in the isotopologues and check the validity of Eq. 1. The spherically symmetric source model from Schöier et al. (2002) for IRAS 16293-2422, the R CrA IRS7B model with external irradiation from Lindberg & Jørgensen (2012), and the best fit model of OMC-3 MMS6 from Jørgensen et al. (2006) are used as an input for the 1D version of the “RATRAN” radiative transfer code (Hogerheijde & van der Tak, 2000). A comparison of the source models, i.e., density and temperature profiles, is shown in Fig. 6. We use molecular data for the HCN isotopologues from the LAMDA database666http://home.strw.leidenuniv.nl/~moldata/ (Schöier et al., 2005). The transition frequencies, energy levels, and Einstein A coefficients in the LAMDA files are based on data from the CDMS catalog (Müller et al., 2001, 2005), and the collisional rate coefficients are scaled and extrapolated HCN-He collision rates from Green & Thaddeus (1974). Individual models were checked against newer collision rates from Dumouchel et al. (2010) and the differences were found to be at the 5-10% level in these cases, i.e., well within the calibration uncertainty.
The abundance profile is chosen according to the results by Jørgensen et al. (2005a), i.e., a drop abundance profile accounting for freeze-out of the molecule at temperatures below a certain threshold and sufficient densities. Following Jørgensen et al. (2005a), the freeze-out region for HCN in NGC 1333 IRAS 2A is defined as the part of the envelope with densities above and temperatures below , which corresponds to the region where CO and HCO+ are also depleted. However, the density at which HCN is frozen out is not a fixed value but time and source dependent (Jørgensen et al., 2005b).

Therefore, models with three different freeze-out/evaporation temperatures (, , and ) and various abundances were tested for IRAS 16293-2422. The density is higher than throughout the envelope in this model and a depletion zone was therefore not employed. A Doppler b-parameter of was assumed, corresponding to a line width (FWHM) of . The model FWHM was chosen a bit lower than the observed line widths, because no additional velocity profile (e.g. infall) was used in the models.
The model with the abundance jump at and (for ) and (where ) can reproduce the observed H13CN(3-2 and 4-3) integrated intensities from IRAS 16293-2422 within a few percent. However, this model underproduces the HC15N lines, in particular the transition, by at least 20% for H13CN/HC15N abundance ratios in the range of , corresponding to a 14N/15N ratio of assuming (Wilson, 1999). In addition, an abundance jump of more than two orders of magnitude is almost a factor of five higher than what was found in earlier work (Jørgensen et al., 2005a; Brinch et al., 2009). Therefore, we also tested models where the jump occurs at K and K instead of K. For K, the H13CN intensities are well modelled using and . Using an HC15N abundances of and , corresponding to 14N/15N = 180 as obtained using Eq. 1, yields a very good fit to the observed integrated intensities of HC15N. In contrast, using a solar ratio of 14N/15N = 441 ( and ) underproduces the line intensities by . For K, a good fit to the H13CN lines is obtained using and . Again, ( and ) gives an excellent fit to the HC15N data, whereas a solar abundance ratio, and , underestimates the observed integrated intensites by .
So while the jump model, which becomes moderately optically thick for H13CN ( towards line and source center), can reproduce the H13CN lines, it cannot fit HC15N for 14N/15N ratios ranging from the most extreme values found from the simple analysis (Eq. 1) to solar abundances. The optically thin models with the jump occuring at K and K on the other hand are also able to reproduce the HC15N integrated intensities for , but not for solar abundances. Therefore, the radiative transfer results support the assumption that the line emission is optically thin, and that Eq. 1 is valid in this case.
For OMC-3 MMS6, a fairly well constrained model is also available. An abundance profile with for and and elsewhere yields integrated intensities that are consistent with the observed values within the uncertainties (). The corresponding opacities are in the range of for () and indicate that the H13CN emission from this source is optically thin. For HC15N(3-2), the integrated intensity can be reproduced within 20% using models with (as derived from Eq. 1) as well as (solar ratio). As already concluded in Sec. 3.2, it is therefore not possible to distinguish between a slightly fractionated and a solar ratio for OMC-3 MMS6. The higher freeze-out density compared to IRAS 16293-2422 could indicate that this source is in a less evolved state.
Because of the complex physical structure of R CrA IRS7B, including a disk (Lindberg et al., 2014), the spherically symmetric model is less reliable for this source than for IRAS 16293-2422 and OMC-3 MMS6. An agreement within 20% of the modeled and the observed intensities can be obtained with an H13CN abundance of for and and elsewhere. The optical depth in the central line channel and for a ray directly through the source center are . The observed HC15N emission can be reproduced within the uncertainties with a range of ratios () because the model is not well constrained and only one HC15N line is available. However, the required high abundances are an indication that the physical model underestimates the observed column density, which results in a higher optical depth. Compared to the IRAS 16293-2422 model, which has a similar outer radius, but higher densities, R CrA IRS7B is not expected to be significantly optically thick. Given the model uncertainties and the degeneracies in the parameter space, the simple analysis (Eq. 1) is likely to provides the most reliable results for this source.
4 Discussion
At least two measurements of the 14N/15N ratio have been obtained in all three sources. For IRAS 16239A, the two measurements from the J=3-2 and 4-3 lines of H13CN and HC15N, 14N/15N and 14N/15N , agree well. The 14N/15N value from the HNC(3-2) isotopologues is different from the HCN values at the level. In the case of R CrA IRS7B, the HCN and HNC values are consistent within the error bars, including also the ratio derived from the data by Watanabe et al. (2012). The 14N/15N ratios from HCN and HNC in OMC-3 MMS6 agree within errors, but the uncertainties are larger in this source than in the two others. Overall, the agreement between different measurements of the same source is fairly good. The comparison to other measurements and literature values is discussed in the subsections below.
Comparing Table 5 with the temperatures in the outer regions of the spherically symmetric envelope models of the three sources in the sample, it is apparent that the lowest 14N/15N ratios are found in the source with the lowest temperature in the outermost regions, IRAS 16293A. It is followed by R CrA IRS7B, which has a somewhat elevated temperature because it is being irradiated by a nearby Herbig Be star, R CrA (Lindberg & Jørgensen, 2012). The highest, almost solar, 14N/15N ratios are from OMC-3 MMS6, located in the active region of Orion and thus subject to a strong radiation field, which has the highest temperatures in the outer envelope. More quantitatively, this behavior is illustrated in Fig. 7, showing the average of the 14N/15N ratio for each source versus the temperature at the projected radius of the beam. The APEX measurements listed in Table 5 were averaged for each source and the errors bars reflect the spread of the measured ratios. The temperature was taken from the spherically symmetric source models, evaluated at the radius of the APEX beam () at the corresponding source distance (K for IRAS 16239A, K for R CrA IRS7B, and K for OMC-3 MMS6). A larger sample would be needed to draw any conclusions about whether or not there is a direct correlation between temperature and 15N-enhancement, but our result provides at least an indication for a temperature dependence of the 14N/15N ratio in these embedded protostars.

4.1 Comparison with previous HCN and HNC measurements in the target sources
Isotopologues of HCN and HNC in IRAS 16293-2422 were previously measured in the spectral surveys by Caux et al. (2011, IRAM and JCMT) and Blake et al. (1994, JCMT and CSO); van Dishoeck et al. (1995, JCMT and CSO). The integrated intensities from the Caux et al. (2011) and van Dishoeck et al. (1995) surveys are listed in Table 8 in the appendix. Note that the observations by Caux et al. (2011) were pointed at the B component of the protobinary, whereas our observations are pointed directly at the A component. The two components are separated by and thus lie both within the beam. However, in the 230 GHz band observations at the IRAM 30m, the flux of the A component is considerably attenuated (see discussion in Caux et al., 2011). The resulting 14N/15N ratios are, assuming a calibration uncertainty of 15%, from the H13CN(1-0) and HC15N(1-0) intensities, for the 3-2 transitions, and for the 4-3 lines and thus comparable to our values. No H15NC intensities are reported by Caux et al. (2011).
From the integrated intensities of HC15N(3-2) and H13CN(3-2) measured by van Dishoeck et al. (1995) we find 14N/15N = 131. From the fact that HC15N is detected, they argue - presumably based on the assumption of a local interstellar medium value for the nitrogen isotope ratio (Wilson & Rood, 1994) - that H13CN is still slightly optically thick. However, from our model results and the fit to the hyperfine structure of H13CN(1-0) we conclude that the lines are optically thin and that the assumption of a standard nitrogen isotope ratio likely does not hold because nitrogen is fractionated.
R CrA IRS7B was surveyed in the 345 GHz spectral window by Watanabe et al. (2012) using the ASTE telescope. The integrated intensities are for HC15N(4-3), for H13CN(4-3), for HN13C(4-3), and for H15NC(4-3). Based on exactly the same procedure as for our own measurements but with a calibration uncertainty of 19% for ASTE (Watanabe et al., 2012), the inferred 14N/15N ratios are from HCN and from HNC. The ratios derived from the work by Watanabe et al. (2012) are consistent with our measurements, but the error bars are significantly larger than for our APEX observations.
Schöier et al. (2006) observed HCN(4-3) and HNC(4-3) with APEX in R CrA IRS7B, resulting in integrated intensities of and , respectively. Their intensities are very similar to the values found from our observations of HCN(3-2) and HNC(3-2), which are and . For optically thin HCN lines, similar line strengths for the 4–3 and 3–2 transitions are predicted by radiative transfer models if a constant abundance is assumed (see also Jørgensen et al., 2005a, for a discussion of the HCN abundance structure). Therefore, the similar intensities of the 4–3 and 3–2 transitions could be an indication for little variations in the HCN abundance with radius in this source, and thus no significant freeze-out of HCN.
No HCN and HNC isotopologue measurements were found in the literature for OMC-3 MMS6.
4.2 Comparison with 14N/15N ratios from the literature
14N/15N ratios were previously measured in a selection of low-mass pre- and protostellar environments from a variety of molecular tracers. The literature results are summarized in Table 1. The table clearly illustrates the discrepancy of 14N/15N ratios derived from HCN and NH3, which may be caused by different fractionation routes for nitriles and nitrogen hydrides (Wirström et al., 2012; Hily-Blant et al., 2013a, b). It also highlights the lack of a comprehensive set of 14N/15N ratios from different tracers for a source, which makes the interpretation and comparison of individual measurements very challenging. For instance, Adande & Ziurys (2012) found a reasonable agreement between the 14N/15N ratios inferred from HNC and CN. We find that the ratios derived from HCN and HNC are relatively similar. On the other hand, the prestellar core nitrogen isotope composition varies between HCN and CN (Hily-Blant et al., 2013a, b), so it is not clear if there is any correlation between the 14N/15N ratios from HCN, HNC, and CN despite the fact that they all belong to to the “nitrile” fractionation route (Wirström et al., 2012). Moreover, the HNC values reported in Milam & Charnley (2012) are substantially lower than any other measurement for reasons which are unclear.
For IRAS 16293A, the inferred ratios from HCN (two transitions) and HNC (one measurement) fall into the range of the typical prestellar core HCN values (Hily-Blant et al., 2013a). The similarity of the nitrogen isotope ratio in IRAS 16293A to the prestellar cores is an indication that either fractionation (not necessarily chemical) continues in the envelope of this YSO or that an enhanced 15N signature from the prestellar core phase has survived into the Class 0 phase. An enhanced radiation field seems to lower or even suppress nitrogen fractionation, as can be seen for the two sources with an enhanced external radiation field, R CrA IRS7B and OMC-3 MMS6. The 14N/15N ratio in R CrA IRS7B lies at the upper end of the prestellar core values and the 14N/15N ratio from OMC-3 MMS6 is even higher, outside the range spanned by the prestellar cores.
4.3 Comparison to the local interstellar medium
To decide whether a source shows an enhancement of 15N in a molecule, one would like to compare the 14N/15N ratio from the source to a reference value of the interstellar medium (ISM). Different 14N/15N measurements of the local interstellar medium are available from the literature. Wilson (1999) list 14N/15N for the local ISM (updated from the earlier value of 14N/15N, Wilson & Rood, 1994) based on the HCN surveys data from Wannier et al. (1981, for the northern sources) and Dahmen et al. (1995, for the southern sky) as well as the NH3 survey by Guesten & Ungerechts (1985). However, Wielen & Wilson (1997) argue that the ISM value should be , taking into account that the Sun formed at a smaller galactocentric radius that its current location. A local ISM value of 14N/15N is reported by Adande & Ziurys (2012) from measurements of HNC and CN in warm clouds and the 12C/13C ratios from Milam et al. (2005). While the local value from the work by Adande & Ziurys (2012) is inferred from a linear fit to the data throughout the Galaxy, the local ratio reported in Wilson (1999) is the average of 8 sources close to the solar galactic distance. The Wilson (1999) and Adande & Ziurys (2012) results are not consistent within error bars, and the difference presumably arises from the different carbon isotope ratios (12C/13C) assumed for the double isotope method in the case of HCN and HNC. The 12C/13C ratio from CN and CO isotopologues, used in Adande & Ziurys (2012), are generally lower than those obtained from H2CO isotopologues, included in Wilson (1999). However, the local 12C/13C ratios from Wilson ( from CO and H2CO, 1999) and Milam et al. (2005, from CO, CN, and H2CO) agree well, but the values for individual sources close to the solar neighborhood from Milam et al. (2005) are partly lower, which is then transferred onto the 14N/15N ratios from HNC (Adande & Ziurys, 2012). The Adande & Ziurys (2012) result agrees with the average value of 14N/15N measured in two diffuse clouds along the line of sight toward a strong extragalactic source from absorption spectroscopy of HCN (Lucas & Liszt, 1998). It was however noticed that there is a significant scatter of the data points from the Galactic isotope surveys, and thus it is unclear how meaningful the comparison of the obtained 14N/15N ratios to an average local ISM value is to decide whether or not the nitrogen isotopes are fractionated in a specific source. Moreover, the local ISM value is also subject to change, as galactic evolution models by Romano & Matteucci (2003) for instance predict that the 14N/15N ratio of the ISM increases with galactocentric distance and decreases with time.
Our IRAS 16293A results from HCN lie outside the uncertainty range of both the Adande & Ziurys (2012) and Wilson (1999) local ISM values, while the ratio inferred from HNC lies within the uncertainties of Adande & Ziurys (2012), but clearly outside Wilson (1999), as do the R CrA HCN and HNC ratios. The HCN measurement from OMC-3 MMS6 is agreement with both ISM values, while the ratio from HNC, which is the most uncertain of all data points, is consistent with the Wilson (1999) ISM result but falls above the one from Adande & Ziurys (2012). Hence, from the comparison with ISM measurements, the nitrogen isotopes in IRAS 16293A show indications for fractionation, and fractionation may possibly also occur in R CrA IRS7B, while OMC-3 MMS6 shows no evidence for fractionation if the comparison with a local ISM value is meaningful. The ratio should also be measured for our sources to check and account for any deviations from the standard.
4.4 Comparison to solar system values
A direct comparison of the nitrogen isotope composition with that of solar system bodies is difficult as possible mechanisms for a separation of the protostellar material into a 15N-poor gas phase and 15N-rich solids are not yet understood. The freeze-out of 15N-substituted molecular species, in particular ammonia, onto dust grains and their incorporation into the ice mantles is believed to be important (Rodgers & Charnley, 2008b; Wirström et al., 2012), but the detailed processes are still unclear. Existing observations of the nitrogen isotope composition in star-forming regions do not point at a large nitrogen isotope fractionation in ammonia (Gerin et al., 2009; Daniel et al., 2013). Gerin et al. (2009) and Bizzocchi et al. (2013) even argue for a depletion of 15N in NH3 and N2H+, respectively, in the prestellar core L1544. The comparison is further complicated by the fact that the chemical carrier of the elevated 15N-signature or the functional group carrying the isotopic anomaly in primitive solar system matter has not yet been identified. Furthermore, the cosmomaterials that can nowadays be sampled may represent only a minor reservoir of the presolar nebula. It may have also underdone significant processing during the evolution of the solar system, such as heating or aqueous alteration, which could affect the isotopic signatures (e.g., Alexander et al., 2007).
Bulk 15N-enrichments in meteorites are comparable to the values inferred from star-forming regions. However, meteoritic 15N-hotspots feature enrichments exceeding the one most extreme values for prestellar cores (Hily-Blant et al., 2013a) or our protostar sample. Within errors, the cometary ratios are also in agreement with our HCN results for IRAS 16293A, but lower than the OMC-3 MMS6 and R CrA IRS7B results. Overall, the 14N/15N ratios in primitive solar system matter, i.e., meteorites, comets, and IDPs, are comparable to the ones measured around prestellar cores and protostars (cf. comparison in Fig. 4), but the ambiguities on both the meteoritic and the astrochemical side do not yet allow concluding whether or not the 15N-signature in meteorites was directly inherited from a 15N-enriched precursor molecule in the presolar nebula or whether it is the result of a secondary process.
4.5 Chemical fractionation or photochemistry?
A possible explanation for the isotopic variations among our sample could be the different amounts of external irradiation the sources are exposed to. IRAS 16293A, being a relatively isolated source, has the lowest temperatures in the outer envelope, whereas OMC-3 MMS6 and R CrA IRS7B are both exposed to an enhanced radiation field, resulting in warmer outer envelope temperatures (Jørgensen et al., 2006; Lindberg & Jørgensen, 2012). There is a tentative trend toward a decreasing 15N-enhancement with increasing outer envelope temperature in our sample, but the statistics is too small to draw any conclusions. If the trend can be confirmed, it would argue in favor of the chemical fractionation scenario over isotope-selective photochemistry. If photodissociation of N2 was the process dominating the nitrogen isotope composition, the highest 15N-enrichments should be present in the two externally irradiated sources, not IRAS 16293A. However, the single-dish observations only provide a spatially averaged value of the 14N/15N ratio. Because fractionation may not occur everywhere in the envelope, and because the mechanism that dominates the nitrogen isotope composition may even vary throughout the envelope depending on physical parameters such as temperature, irradiation, and opacity, spatially resolved observations are clearly needed to study potential spatial variations in 14N/15N ratio. For instance, photochemistry could determine the 14N/15N ratio in the outermost and maybe innermost parts close to the protostar, where the radiation field is intense, whereas chemical fractionation is expected to be important in cold, shielded regions. Our understanding of the evolution of nitrogen isotopic composition during star- and planet formation would also benefit from a more comprehensive data set with nitrogen isotope ratios measured from a census of molecular tracers and sources in different evolutionary stages. Nonetheless, our results indicate that enhanced 15N-values in HCN and HNC are present not just in the prestellar stage, but also around at least some Class 0 protostars. Whether fractionation is still ongoing in these sources or just preserved from the precedent prestellar core phase and what mechanism is causing the 15N-enrichment in HCN and HNC is not yet clear and needs to be further investigated.
5 Conclusions
We have measured the 14N/15N isotope ratio in the three Class 0 protostars IRAS 16293A, R CrA IRS7B, and OMC-3 MMS6 from 15N- and 13C-substituted isotopologues of HCN and HNC, observed with the APEX telescope. Optically thin emission, the same excitation temperature for both isotopologues, and a standard carbon isotope ratio of (Wilson, 1999; Milam et al., 2005) were assumed to derive the 14N/15N ratios directly from the integrated line intensities. The assumption of optically thin emission is supported by the results from H13CN(1-0) hyperfine structure fitting for IRAS 16293A and by non-LTE line radiative transfer modeling for all three sources.
The ratios derived from the HCN and HNC isotopologues are relatively similar, but there is significant variation between the tree sources. The values for IRAS 16293A () are in the range of typical prestellar core values (, Hily-Blant et al., 2013a), whereas the results for R CrA IRS7B () indicate that the nitrogen isotopes in this source are less fractionated. For OMC-3 MMS6 (), a solar and hence unfractionated nitrogen isotope composition cannot be excluded. The differences between the sources possibly stem from the different outer envelope temperatures, presumably caused by external irradiation heating the envelope.
Our results indicate that fractionation of nitrogen isotopes in HCN and HNC either continues in the Class 0 stage or is at least preserved from the prestellar core phase. Additional tracers should also be studied to learn more about what molecules carry enhanced and could be responsible for the -enrichment observed in solar system materials.
Chemical fractionation seems a more likely scenario than N2 self-shielding to explain the nitrogen isotope measurements in our data set because of a tentative trend toward a decreasing with decreasing envelope temperature. However, spatially resolved observations are crucial to pinpoint which mechanism causes the observed 15N-enrichment in some Class 0 protostars.
References
- Abbas et al. (2004) Abbas, M. M., LeClair, A., Owen, T., et al. 2004, ApJ, 602, 1063
- Adande & Ziurys (2012) Adande, G. R. & Ziurys, L. M. 2012, ApJ, 744, 194
- Aléon (2010) Aléon, J. 2010, ApJ, 722, 1342
- Alexander et al. (2007) Alexander, C. M. O´D., Fogel, M., Yabuta, H., & Cody, G. D. 2007, Geochim. Cosmochim. Acta., 71, 4380
- Anders & Grevesse (1989) Anders, E. & Grevesse, N. 1989, Geochim. Cosmochim. Acta., 53, 197
- Bertin et al. (2013) Bertin, M., Fayolle, E. C., Romanzin, C., et al. 2013, ApJ, 779, 120
- Birck (2004) Birck, J. L. 2004, Rev. Mineral. Geochem., 55, 25
- Bizzocchi et al. (2010) Bizzocchi, L., Caselli, P., & Dore, L. 2010, A&A, 510, L5+
- Bizzocchi et al. (2013) Bizzocchi, L., Caselli, P., Leonardo, E., & Dore, L. 2013, A&A, 555, A109
- Blake et al. (1994) Blake, G. A., van Dishoeck, E. F., Jansen, D. J., Groesbeck, T. D., & Mundy, L. G. 1994, ApJ, 428, 680
- Bockelée-Morvan et al. (2008) Bockelée-Morvan, D., Biver, N., Jehin, E., et al. 2008, ApJ, 679, L49
- Böhlke et al. (2005) Böhlke, J. K., de Laeter, J. R., De Bièvre, P., et al. 2005, J. Phys. Chem. Ref. Data, 34, 57
- Bonal et al. (2010) Bonal, L., Huss, G. R., Krot, A. N., et al. 2010, Geochim. Cosmochim. Acta., 74, 6590
- Boogert et al. (2002) Boogert, A. C. A., Hogerheijde, M. R., Ceccarelli, C., et al. 2002, ApJ, 570, 708
- Briani et al. (2009) Briani, G., Gounelle, M., Marrocchi, Y., et al. 2009, Proceedings of the National Academy of Sciences, 106
- Brinch et al. (2009) Brinch, C., Jørgensen, J. K., & Hogerheijde, M. R. 2009, A&A, 502, 199
- Busemann et al. (2006) Busemann, H., Young, A. F., O’D. Alexander, C. M., et al. 2006, Science, 312, 727
- Caux et al. (2011) Caux, E., Kahane, C., Castets, A., et al. 2011, A&A, 532, A23
- Clayton (2002) Clayton, R. N. 2002, Nature, 415, 860
- Connelly et al. (2012) Connelly, J. N., Bizzarro, M., Krot, A. N., et al. 2012, Science, 338, 651
- Coplen et al. (1992) Coplen, T. B., Krouse, H. R., & Böhlke, J. K. 1992, Pure Appl. Chem, 64, 907
- Dahmen et al. (1995) Dahmen, G., Wilson, T. L., & Matteucci, F. 1995, A&A, 295, 194
- Daniel et al. (2013) Daniel, F., Gérin, M., Roueff, E., et al. 2013, A&A, 560, A3
- Dumke & Mac-Auliffe (2010) Dumke, M. & Mac-Auliffe, F. 2010, in Society of Photo-Optical Instrumentation Engineers (SPIE) Conference Series, Vol. 7737
- Dumouchel et al. (2010) Dumouchel, F., Faure, A., & Lique, F. 2010, MNRAS, 406, 2488
- Fletcher et al. (2014) Fletcher, L. N., Greathouse, T. K., Orton, G. S., et al. 2014, Icarus, 238, 170
- Floss et al. (2006) Floss, C., Stadermann, F. J., Bradley, J. P., et al. 2006, Geochim. Cosmochim. Acta., 70, 2371
- Fouchet et al. (2004) Fouchet, T., Irwin, P. G. J., Parrish, P., et al. 2004, Icarus, 172, 50
- Fouchet et al. (2000) Fouchet, T., Lellouch, E., Bézard, B., et al. 2000, Icarus, 143, 223
- Gerin et al. (2009) Gerin, M., Marcelino, N., Biver, N., et al. 2009, A&A, 498, L9
- Green & Thaddeus (1974) Green, S. & Thaddeus, P. 1974, ApJ, 191, 653
- Guesten & Ungerechts (1985) Guesten, R. & Ungerechts, H. 1985, A&A, 145, 241
- Güsten et al. (2006) Güsten, R., Nyman, L. Å., Schilke, P., et al. 2006, A&A, 454, L13
- Hashizume et al. (2000) Hashizume, K., Chaussidon, M., Marty, B., & Robert, F. 2000, Science, 290, 1142
- Heays et al. (2014) Heays, A. N., Visser, R., Gredel, R., et al. 2014, A&A, 562, A61
- Hily-Blant et al. (2013a) Hily-Blant, P., Bonal, L., Faure, A., & Quirico, E. 2013a, Icarus, 223, 582
- Hily-Blant et al. (2013b) Hily-Blant, P., Pineau des Forêts, G., Faure, A., Le Gal, R., & Padovani, M. 2013b, A&A, 557, A65
- Hoffman et al. (1979) Hoffman, J. H., Hodges, R. R., McElroy, M. B., Donahue, T. M., & Kolpin, M. 1979, Science, 205, 49
- Hogerheijde & van der Tak (2000) Hogerheijde, M. R. & van der Tak, F. F. S. 2000, A&A, 362, 697
- Hutsemékers et al. (2005) Hutsemékers, D., Manfroid, J., Jehin, E., et al. 2005, A&A, 440, L21
- Ikeda et al. (2002) Ikeda, M., Hirota, T., & Yamamoto, S. 2002, ApJ, 575, 250
- Jehin et al. (2009) Jehin, E., Manfroid, J., Hutsemékers, D., Arpigny, C., & Zucconi, J.-M. 2009, Earth Moon and Planets, 105, 167
- Johnstone et al. (2003) Johnstone, D., Boonman, A. M. S., & van Dishoeck, E. F. 2003, A&A, 412, 157
- Jørgensen et al. (2005a) Jørgensen, J. K., Bourke, T. L., Myers, P. C., et al. 2005a, ApJ, 632, 973
- Jørgensen et al. (2011) Jørgensen, J. K., Bourke, T. L., Nguyen Luong, Q., & Takakuwa, S. 2011, A&A, 534, A100
- Jørgensen et al. (2008) Jørgensen, J. K., Johnstone, D., Kirk, H., et al. 2008, ApJ, 683, 822
- Jørgensen et al. (2006) Jørgensen, J. K., Johnstone, D., van Dishoeck, E. F., & Doty, S. D. 2006, A&A, 449, 609
- Jørgensen et al. (2004) Jørgensen, J. K., Schöier, F. L., & van Dishoeck, E. F. 2004, A&A, 416, 603
- Jørgensen et al. (2005b) Jørgensen, J. K., Schöier, F. L., & van Dishoeck, E. F. 2005b, A&A, 435, 177
- Junk & Svec (1958) Junk, G. & Svec, H. J. 1958, Geochim. Cosmochim. Acta., 14, 234
- Kerridge (1993) Kerridge, J. F. 1993, Reviews of Geophysics, 31, 423
- Li et al. (2013) Li, X., Heays, A. N., Visser, R., et al. 2013, A&A, 555, A14
- Liang et al. (2007) Liang, M.-C., Heays, A. N., Lewis, B. R., Gibson, S. T., & Yung, Y. L. 2007, ApJ, 664, L115
- Lindberg & Jørgensen (2012) Lindberg, J. E. & Jørgensen, J. K. 2012, A&A, 548, A24
- Lindberg et al. (2014) Lindberg, J. E., Jørgensen, J. K., Brinch, C., et al. 2014, A&A, 566, A74
- Linke et al. (1977) Linke, R. A., Goldsmith, P. F., Wannier, P. G., Wilson, R. W., & Penzias, A. A. 1977, ApJ, 214, 50
- Lis et al. (2010) Lis, D. C., Wootten, A., Gerin, M., & Roueff, E. 2010, ApJ, 710, L49
- Loinard et al. (2000) Loinard, L., Castets, A., Ceccarelli, C., et al. 2000, A&A, 359, 1169
- Lucas & Liszt (1998) Lucas, R. & Liszt, H. 1998, A&A, 337, 246
- Lyons et al. (2009) Lyons, J. R., Bergin, E. A., Ciesla, F. J., et al. 2009, Geochim. Cosmochim. Acta., 73, 4998
- Manfroid et al. (2009) Manfroid, J., Jehin, E., Hutsemékers, D., et al. 2009, A&A, 503, 613
- Mariotti (1983) Mariotti, A. 1983, Nature, 303, 685
- Marty et al. (2011) Marty, B., Chaussidon, M., Wiens, R. C., Jurewicz, A. J. G., & Burnett, D. S. 2011, Science, 332, 1533
- Mathew & Marti (2001) Mathew, K. J. & Marti, K. 2001, J. Geophys. Res., 106, 1401
- McKeegan et al. (2006) McKeegan, K. D., Aléon, J., Bradley, J., et al. 2006, Science, 314, 1724
- Meibom et al. (2007) Meibom, A., Krot, A. N., Robert, F., et al. 2007, ApJ, 656, L33
- Messenger (2000) Messenger, S. 2000, Nature, 404, 968
- Milam & Charnley (2012) Milam, S. N. & Charnley, S. B. 2012, in Lunar and Planetary Inst. Technical Report, Vol. 43, Lunar and Planetary Institute Science Conference Abstracts, 2618
- Milam et al. (2005) Milam, S. N., Savage, C., Brewster, M. A., Ziurys, L. M., & Wyckoff, S. 2005, ApJ, 634, 1126
- Müller et al. (2005) Müller, H. S. P., Schlöder, F., Stutzki, J., & Winnewisser, G. 2005, Journal of Molecular Structure, 742, 215
- Müller et al. (2001) Müller, H. S. P., Thorwirth, S., Roth, D. A., & Winnewisser, G. 2001, A&A, 370, L49
- Mumma & Charnley (2011) Mumma, M. J. & Charnley, S. B. 2011, ARA&A, 49, 471
- Niemann et al. (2005) Niemann, H. B., Atreya, S. K., Bauer, S. J., et al. 2005, Nature, 438, 779
- Owen et al. (2001) Owen, T., Mahaffy, P. R., Niemann, H. B., Atreya, S., & Wong, M. 2001, ApJ, 553, L77
- Persson et al. (2013) Persson, M. V., Jørgensen, J. K., & van Dishoeck, E. F. 2013, A&A, 549, L3
- Pickett et al. (1998) Pickett, H. M., Poynter, R. L., Cohen, E. A., et al. 1998, J. Quant. Spec. Radiat. Transf., 60, 883
- Pineda et al. (2012) Pineda, J. E., Maury, A. J., Fuller, G. A., et al. 2012, A&A, 544, L7
- Rodgers & Charnley (2008a) Rodgers, S. D. & Charnley, S. B. 2008a, ApJ, 689, 1448
- Rodgers & Charnley (2008b) Rodgers, S. D. & Charnley, S. B. 2008b, MNRAS, 385, L48
- Romano & Matteucci (2003) Romano, D. & Matteucci, F. 2003, MNRAS, 342, 185
- Rousselot et al. (2014) Rousselot, P., Pirali, O., Jehin, E., et al. 2014, ApJ, 780, L17
- Schöier et al. (2006) Schöier, F. L., Jørgensen, J. K., Pontoppidan, K. M., & Lundgren, A. A. 2006, A&A, 454, L67
- Schöier et al. (2002) Schöier, F. L., Jørgensen, J. K., van Dishoeck, E. F., & Blake, G. A. 2002, A&A, 390, 1001
- Schöier et al. (2005) Schöier, F. L., van der Tak, F. F. S., van Dishoeck, E. F., & Black, J. H. 2005, A&A, 432, 369
- Shinnaka et al. (2014) Shinnaka, Y., Kawakita, H., Kobayashi, H., Nagashima, M., & Boice, D. C. 2014, ApJ, 782, L16
- Takakuwa et al. (2007) Takakuwa, S., Ohashi, N., Bourke, T. L., et al. 2007, ApJ, 662, 431
- Tennekes et al. (2006) Tennekes, P. P., Harju, J., Juvela, M., & Tóth, L. V. 2006, A&A, 456, 1037
- Terzieva & Herbst (2000) Terzieva, R. & Herbst, E. 2000, MNRAS, 317, 563
- van Dishoeck et al. (1995) van Dishoeck, E. F., Blake, G. A., Jansen, D. J., & Groesbeck, T. D. 1995, ApJ, 447, 760
- Vassilev et al. (2008) Vassilev, V., Meledin, D., Lapkin, I., et al. 2008, A&A, 490, 1157
- Wannier et al. (1981) Wannier, P. G., Linke, R. A., & Penzias, A. A. 1981, ApJ, 247, 522
- Watanabe et al. (2012) Watanabe, Y., Sakai, N., Lindberg, J. E., et al. 2012, ApJ, 745, 126
- Wielen & Wilson (1997) Wielen, R. & Wilson, T. L. 1997, A&A, 326, 139
- Wilson (1999) Wilson, T. L. 1999, Reports on Progress in Physics, 62, 143
- Wilson & Rood (1994) Wilson, T. L. & Rood, R. 1994, ARA&A, 32, 191
- Wirström et al. (2012) Wirström, E. S., Charnley, S. B., Cordiner, M. A., & Milam, S. N. 2012, ApJ, 757, L11
- Womack et al. (1992) Womack, M., Ziurys, L. M., & Wyckoff, S. 1992, ApJ, 387, 417
- Wong et al. (2013) Wong, M. H., Atreya, S. K., Mahaffy, P. N., et al. 2013, Geochim. Res. Lett., 40, 6033
Acknowledgements.
The authors thank the referee for constructive comments that helped to improve the article. Research for this project was supported by a Danish National Research Foundation Centre of Excellence grant to M.B. (grant number DNRF97) and from a Lundbeck Foundation Junior Group Leader Fellowship to J.K.J. M.B. further acknowledges funding from the European Research Council under ERC Consolidator grant agreement 616027-STARDUST2ASTEROIDS. The research leading to these results has received funding from the European Commission Seventh Framework Programme (FP/2007-2013) under grant agreement No 283393 (RadioNet3). The authors would like to thank the Onsala/APEX staff for carrying out the observations. Per Bergman and the Onsala/APEX staff are also thanked for help assessing potential contamination from the off position.Appendix A Observational details
| Transition(s) | Date | # scans | time (on) | Remarks |
|---|---|---|---|---|
| [min] | ||||
| IRAS 16293A | ||||
| H13CN(3-2), HC15N(3-2) | 2012-04-01 | 67 | 20 | |
| H13CN(4-3), HC15N(4-3) | 2012-06-04 | 41 | 12 | |
| H13C15N(3-2) | 2012-06-13 | 150 | 44 | USB (30 scans), LSB (120 scans) |
| LSB suffers from strong spur | ||||
| DCN(3-2) | 2012-06-08 | 29 | 9 | scans 47-48 ignored (LO locked out) |
| DCN(4-3) | 2012-06-07 | 30 | 9 | |
| DCN(5-4), HNC(4-3) | 2012-06-04 | 40 | 12 | baseline ripples |
| D13CN(3-2) | 2012-06-08 | 120 | 35 | scans 541-542 ignored (LO locked out) |
| 2012-06-09 | 41 | 12 | scans 215-218 ignored (LO locked out) | |
| 2012-06-10 | 50 | 15 | ||
| 2012-06-11 | 60 | 18 | ||
| HN13C(3-2), H13CN(3-2), HC15N(3-2) | 2013-08-20 | 36 | 21 | H13CN and HC15N intensities higher than |
| those observed on 2012-04-01 | ||||
| H15NC(3-2), HCN(3-2) | 2013-08-19 | 36 | 21 | |
| R CrA IRS 7B | ||||
| HN13C(3-2), H13CN(3-2), HC15N(3-2) | 2012-08-16 | 30 | 9 | |
| 2012-09-27 | 50 | 15 | ||
| HN13C(4-3), H13CN(4-3) | 2012-08-22 | 50 | 15 | |
| 2012-09-25 | 30 | 9 | ||
| H15N(3-2)C, HCN(3-2) | 2012-08-16 | 108 | 32 | |
| 2012-09-27 | 140 | 41 | ||
| 2012-09-29 | 90 | 26 | ||
| 2012-09-30 | 40 | 12 | intensities & line profiles off, data discarded | |
| 2012-11-20 | 30 | 9 | ||
| 2012-11-21 | 40 | 12 | ||
| 2012-11-23 | 100 | 29 | ||
| 2012-11-24 | 10 | 3 | ||
| 2012-11-28 | 50 | 15 | ||
| HNC(3-2)C | 2012-09-27 | 20 | 6 | |
| OMC3 MMS6 | ||||
| HN13C(3-2), H13CN(3-2), HC15N(3-2) | 2012-08-16 | 28 | 8 | |
| 2012-11-22 | 120 | 35 | ||
| HN13C(4-3), H13CN(4-3) | 2012-09-26 | 30 | 9 | |
| H15NC(3-2), HCN(3-2) | 2012-08-16 | 70 | 21 | |
| 2012-09-25 | 170 | 50 | ||
| 2012-11-24 | 90 | 26 | ||
| 2012-11-25 | 70 | 21 | ||
| 2012-11-26 | 190 | 56 | ||
| HNC(3-2)C | 2012-09-27 | 10 | 3 | |
| Elias 29 | ||||
| HN13C(3-2), H13CN(3-2), HC15N(3-2) | 2012-08-16 | 30 | 9 | |
| HN13C(4-3), H13CN(4-3) | 2012-09-30 | 80 | 24 | |
| H15N(3-2)C, HCN(3-2) | 2012-08-16 | 50 | 15 | intensity on the two days is very different |
| 2012-10-01 | 76 | 23 | (factor of ), data not used | |
| HNC(3-2)C | 2012-09-30 | 160 | 47 | |
| 2012-10-01 | 50 | 15 | ||
Appendix B Literature values
| Object | 14N/15N | N | Ref. | Remarks |
| [‰] | ||||
| Sun | a, ⋆ | Genesis | ||
| Lunar soils | b | trapped solar wind | ||
| Meteorite (CAI) | c, ⋆ | Isheyevo, osbornite (TiN) | ||
| Jupiter | d | ISO, NH3, 15N/14N = | ||
| Jupiter | e, ⋆ | Galileo, NH3 | ||
| Jupiter | f | Cassini-CIRS, NH3 | ||
| Jupiter | g | Cassini-CIRS, NH3 | ||
| Saturn | h | ground-based, NH3 | ||
| Titan | i | Huygens, N2, secondary origin | ||
| Earth (atmo.) | 0 | j, ⋆ | ||
| Venus (atmo.) | k, ⋆ | |||
| Mars (rock) | l, ⋆ | ALH84001 meteorite | ||
| Mars (atmo.) | m | Curiosity, secondary origin | ||
| Comets | to | to | n, ⋆ | approx. range, CN |
| Comet | o | 17P/Holmes, HCN | ||
| Comet | o | 17P/Holmes, CN | ||
| Comet | p | Comet C/2012 S1 (ISON), NH3 | ||
| Comets | q | avg. spectrum (12 comets), NH3 | ||
| Comet (B) | to | to | r | Comet 81P/Wild2, Stardust |
| Comet (HS) | to | to | r | Comet 81P/Wild2, Stardust |
| IDPs (B) | to | to | s | IDPs “Kipling”, “Eliot” |
| IDPs (HS) | to | to | s | IDPs “Kipling”, “Pirandello” |
| Cluster IDPs | to | to | t | IDPs “Porky”, “Dragonfly” |
| Meteorites (B) | to | to | u, ⋆ | |
| Meteorites (HS) | to | to | u | |
| Meteorites | to | to | v, ⋆ | insoluble organic matter (IOM) |
| Meteorite (HS) | w, ⋆ | Isheyevo clast | ||
| Meteorite (HS) | x | Isheyevo clast |
a Marty et al. (2011), b Hashizume et al. (2000), c Meibom et al. (2007), d Fouchet et al. (2000), e Owen et al. (2001), f Abbas et al. (2004), g Fouchet et al. (2004), h Fletcher et al. (2014), i Niemann et al. (2005) j Junk & Svec (1958); Coplen et al. (1992); Böhlke et al. (2005), k Hoffman et al. (1979), l Mathew & Marti (2001), m Wong et al. (2013), n Manfroid et al. (2009); Jehin et al. (2009); Mumma & Charnley (2011) and references therein, o Bockelée-Morvan et al. (2008), p Shinnaka et al. (2014), q Rousselot et al. (2014), r McKeegan et al. (2006), s Floss et al. (2006), t Messenger (2000), u Busemann et al. (2006), v Alexander et al. (2007), w Bonal et al. (2010), x Briani et al. (2009)
| Transition | Telescope | |
| [K km/s] | ||
| H13CN (12-01) | IRAM | |
| H13CN (11-01) | IRAM | |
| H13CN (10-01) | IRAM | |
| H13CN (3-2) | IRAM | |
| H13CN (4-3) | JCMT | |
| HC15N (1-0) | IRAM | |
| HC15N (2-1) | IRAM | |
| HC15N (3-2) | IRAM | |
| HC15N (4-3) | JCMT | |
| H13CN (3-2) | JCMT | |
| H13CN (4-3) | CSO | |
| HC15N (3-2) | JCMT | |
| HN13C (3-2) | JCMT |