Feshbach modulation spectroscopy
Abstract
In the vicinity of a Feshbach resonance, a system of ultracold atoms on an optical lattice undergoes rich physical transformations which involve molecule formation and hopping of molecules on the lattice and thus goes beyond a single-band Hubbard model description. We propose to probe the behavior of this system with a harmonic modulation of the magnetic field, and thus of the scattering length, across the Feshbach resonance, as an alternative to lattice-depth modulation spectroscopy. In the regime in which the single-band Hubbard model is still valid, we provide simulation data for this type of spectroscopy. The method may uncover a route towards the efficient creation of ultracold molecules and provides an alternate means for lattice modulation spectroscopy.
pacs:
03.75.-b, 03.75.Ss, 71.10.FdThe field of ultracold atoms in optical lattices has been opening up new possibilities which include a controlled experimental realization of the fermionic Hubbard model blochreview ; Esslinger2010 . Further challenges and opportunities arise with the idea of manipulating and controlling molecules on an optical lattice. Molecules allow a much wider range of physical phenomena to be modelled and studied than is possible with atoms. However, it is more difficult to cool molecules down to the ground state via laser cooling, due to their more complex level structure which includes rotational and vibrational degrees of freedom. The cooling of individual atoms to a very low temperature followed by the formation of so-called preformed molecules on the optical lattice is thus a promising alternative Freericks2010 . Near a Feshbach resonance, bound states of these preformed molecules occur. Depending on the value of the magnetic field, molecules form and hop from one lattice site to the other; these processes are governed by the complex Fermi Resonance Hamiltonian (FRH) Wall2012 .
It is crucial to understand the FRH physics in order to control and optimize the formation process. Experimentally, the understanding may be facilitated by a spectroscopic method which we propose in the following. In case of the single-band Hubbard model, the so-called lattice modulation spectroscopy has been proven useful to study non-equilibrium dynamics. In lattice modulation spectroscopy, the intensity of the laser defining the optical lattice is varied harmonically. As a result, the hopping amplitude and the interaction strength both change as a function of time and the Mott gap can be measured directly in the experiment.
Working with a modulated magnetic field near a Feshbach resonance in order to examine a modulation of the scattering length has been investigated in a number of different contexts. It originally was used to describe Feshbach resonance management kevrikidis_2003 ; abdullaev_2003 which controlled “breathers” and solitons in trapped bosonic systems. Next, it was used to show how many-body effects and the periodic driving could push the tunneling to vanish hanggi_2009 also in bosonic systems. More recently, it has been used to illustrate how one can obtain correlated hopping in bosonic systems when the amplitude of the magnetic field oscillation is small rapp_2012 ; liberto_2014 ; greshner_2014 . Experiments have also been carried out for bosonic systems pollack_2010 to examine driven collective excitations. Here, we focus on the Fermi version of the Hubbard model, and examine situations where the driving is pushed much closer to the Feshbach resonance, and even passing through it, where nonlinear effects become important.
While it is a powerful method to probe the atomic Hubbard physics, lattice modulation spectroscopy does not modify the sign of the interaction strength and is thus fundamentally limited when more general physics issues such as the molecule formation are to be studied.
We thus propose to probe the system with a harmonic modulation of the magnetic field
| (1) |
near the Feshbach resonance, where
| (2) |
is the characteristic function of the modulation interval. In order to provide some numerical data for this spectroscopy method, we consider a system of fermionic 40K atoms subject to the -Feshbach resonance Chin2010 in an optical lattice with a laser wavelength of nm.
While at present, providing numerical results for the full FRH is beyond reach, we present numerical data for the atomic Hubbard limit which are valid in the early stages of the preformed molecule formation process: Hubbard1963
| (3) |
The time dependence of the lattice parameters reads and , where is the maximally localized Wannier function Kohn1959 . The time-dependent coupling constant is determined by the mass of the 40K atoms and the -wave scattering length
| (4) |
where is the background scattering, is the position of the Feshbach resonance and is its width.
For simplicity, we consider a translationally invariant lattice in three dimensions at half filling in the Mott-insulating phase and study the behavior of the double occupancy. With a higher double occupancy, molecule formation is more likely to occur in the later stages of the driving of the full FRH system. Computationally, we employ a strong-coupling approach which works well at finite temperatures larger than the hopping and has already successfully modelled the conventional modulation spectroscopy Mikelsons2012 ; dirks2013 ; dirks2014 . In order to ensure the accuracy of the approach, we constrain the studied parameter range to a maximum value .
For each lattice depth, the Feshbach resonance has a different effect on the hopping relative to the interaction, i.e. on . Also, the magnetic field dependence of the hopping strength in units of the interaction plays a key role in the Feshbach spectroscopy of the Hubbard model. In Fig. 1, panel (b) shows this map for several lattice depths. Panel (a) shows the corresponding interaction strength. We limit our consideration to the interval indicated by the dashed line in panel (b). In addition, we assume that the amplitude of the magnetic field is realistically smaller than 5 G for the necessary modulation frequency of a couple of kHz. We also require the interaction to be significantly lower than the non-interacting bandgap which is also displayed in panel (a) at lattice depth . This, together with the requirement that the renormalized hopping , while small, should be large enough for the effects due to changes in it arising from changes in to be measurable, constrains the considered parameter range to the right branches displayed in panel (b). Thus we consider magnetic field values within the interval and lattice depths equal to or larger than (for smaller , the bandgap to the second band would be too small).
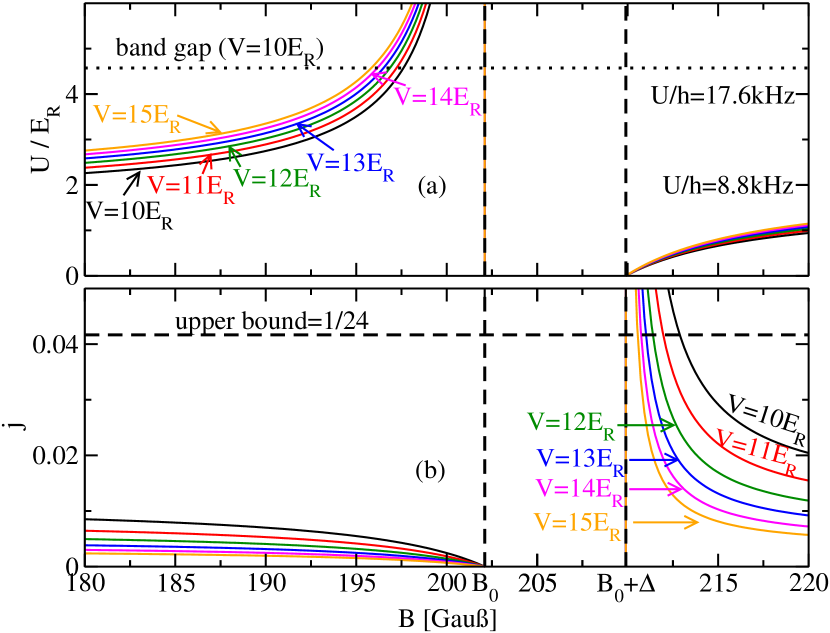
In experiments, the upper bound for the hopping does not apply. However, in the vicinity of the resonance, the strong dependence of the effective hopping on the field also results in a stronger dependence on the inhomgeneities of the magnetic field. It is thus also reasonable to keep the value of below a certain threshold in experiments to reduce the effects of inhomogeneity.
In addition to the mean value of the magnetic field, other important parameters to be considered are the amplitude and the frequency of the field modulation. If the physical response of the system is sensitive to these values, this may help to determine unknown model properties (such as the lattice depth in the experiments) more precisely than possible in lattice depth modulation spectroscopy. In order to study such effects, we investigate the frequency dependence of the doublon production rate for fixed windows of magnetic field modulation.
The field modulation in Eq. (1) is parametrized by the magnetic field amplitude , the average field value , the length of the modulation time interval , and the modulation frequency . and can alteratively be expressed in terms of the minimum and maximum values of the field strength, and . These values also determine the minimum and maximum values of the renormalized hopping . In order to translate into one uses Fig. 1(b).
We consider three field modulation intervals first and compare the behavior for two lattice depths. Depending on the frequency, the field is modulated over a time interval , with
| (5) |
and , resulting in 2 to 6 field modulation cycles for , where . As a physical observable, we study the excitation from the lower to the upper Hubbard band which is measured by the double occupancy per site
| (6) |
and study the increase in this quantity, which we measure as
| (7) |
That is, the end value has been averaged over one oscillation period of a resonantly excited Hubbard system and compared to the initial value.
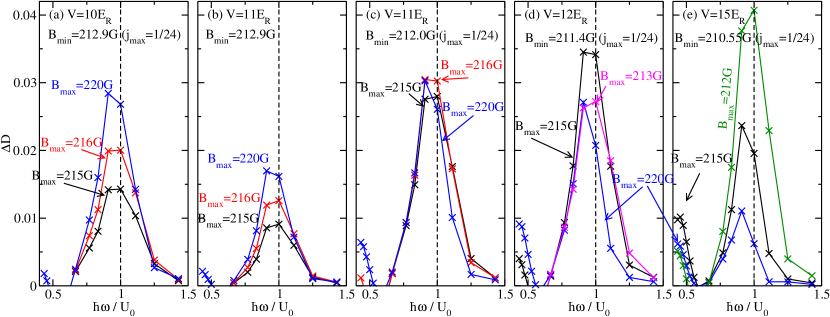
Figure 2 shows the resulting frequency dependence of for three different values of , while we keep the minimum field value constant at . Panels (a) and (b) show the results for the lattice depths and , respectively. Since the hopping is smaller for a deeper lattice, less doublons are produced for than for . However, the behavior of the curves as a function of is qualitatively the same for the two lattice depths.
Hence we discuss the dependence of the resonance curves on in more detail. Figure 2 shows several resonance curves for two slightly different values of in panels (b) and (c), respectively. It shows that even the qualitative behavior of the Feshbach modulation can be quite sensitive to the details of the model. In panel (c), the shape and the strength of the resonances are approximately the same. For the slightly larger value of shown in panel (b), the resonance curves change drastically as a function of . The reason for this qualitatively different behavior is that in case (c) a larger fraction of the steep portion of the renormalized hopping as a function of (see Fig. 1) is sampled in the modulation procedure than in case (b). An effect which both the cases (b) and (c) have in common is that the maximum in doublon production is shifted towards smaller frequencies for larger values of . The reason for this may be the lower time-averaged value of the interaction strength for larger values of in units of the respective values for . For example, in the simplified case , the time-averaged value of the interaction can be approximately written as , where is the interaction associated with the background scattering and . A similar relation can be derived for the more realistic . However, since the width of the resonance is almost constant in both panels (b) and (c), this reasoning cannot be the whole story.
Furthermore, we can also compare the resonance curves for several lattice depths at a fixed maximum value of the renormalized hopping. This corresponds to identifying the value of for which the value is obtained, for each lattice depth. In this case, we choose , which is also the upper theoretical bound we introduced previously in order to assure the convergence of the strong-coupling method. Panels (a), (c),(d), and (e) of Fig. 2 show data for different lattice depths at a constant maximum value of . We again find that the dependence on may depend very much on the lattice depth. While for the shallow lattice, , increasing the modulation amplitude yields a stronger signal, we observe the opposite effect in a deeper lattice, . This striking difference is due to the increasing nonlinearity of as increases. For a shallow lattice, still exhibits a nearly linear behaviour, so the peak strength is proportional to the amplitude. In a deep lattice, is strongly nonlinear and the system is rather kicked than driven. An increased amplitude decreases the kick strength in a deep lattice, because is close to for shorter time spans during the modulation. As the lattice gets deeper, a second order peak appears at , which is approximately as strong as the first-order peak for the strong modulation amplitude. The lattice depths between and interpolate between these two behaviors. In the very deep lattice, for , the strongest doublon production can be achieved with a rather small amplitude corresponding to , or .
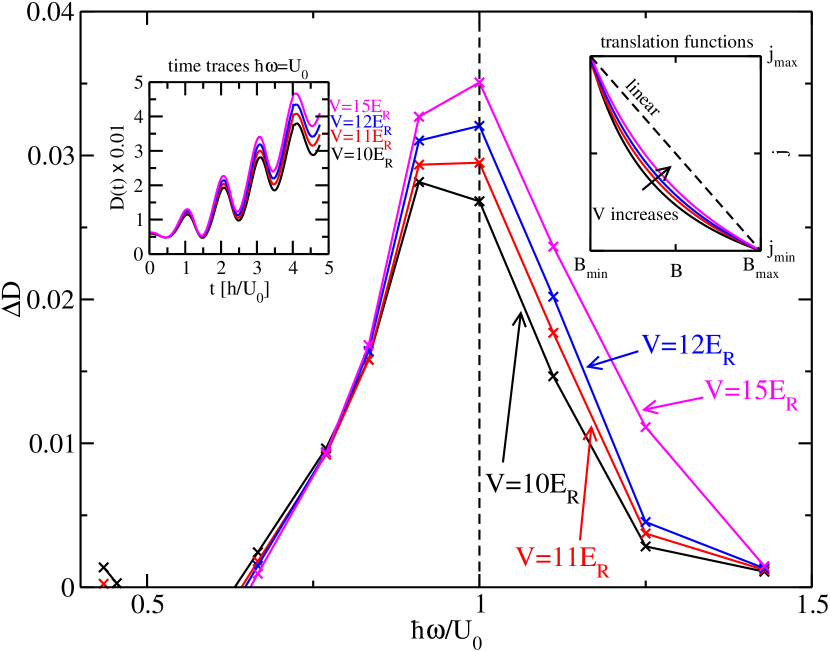
Finally, in order to compare different lattice depths, we fix the values of and in such a way that the renormalized hopping oscillates between the values and . The resulting resonance curves at different lattice depths are shown in Fig. 3. In contrast to the scenarios discussed in Fig. 2, the curves are now essentially identical. This underlines the central role of the renormalized hopping in interpreting both Feshbach and lattice depth modulation spectroscopy. However, we also observe a tendency towards a strong doublon production for deeper lattices. As can be seen in the left inset of Fig. 3, this is not related to the initial number of doubly occupied sites which is essentially identical for each lattice depth. Rather, the tendency is due to the shape of the translation function between magnetic field and effective hopping, as shown in the right inset of Fig. 3. As the lattice depth is increased, the convexity of the translation function is decreased and approaches a linear behavior. This gives rise to an increase in the doublon production.
Conclusion. In this work we have proposed an experimental technique that is an alternative to conventional lattice modulation spectroscopy, where tuning and modulating a magnetic field near a Feshbach resonance allows for the system to have a time dependent interaction, with a constant hopping (the renormalized hopping, of course is time dependent). This changes the behavior of the driving of the system from a more kicked drive in the conventional approach to a smoother evolution in this case. We find that in some cases, the signal can have strong resonant effects that require fine tuning of the magnetic field, and hence have the potential to produce higher precision measurements. In addition, we find that the “two-photon” peak at a frequency equal to half the average interaction strength, is often enhanced in these systems making it easier to study nonlinear excitation effects. Finally, we conjecture that even more interesting behavior will occur when the Feshbach modulation spectroscopy is pushed through the Feshbach resonance itself and allows for molecule formation. The many mutually coupled degrees of freedom in the FRH Wall2012 promise a rich variety of physical effects which will be interesting to investigate both experimentally and theoretically. In particular, it will be interesting to explore the channels that lead to molecule formation spectroscopically. We do not yet have the ability to model and calculate the behavior of such spectroscopy, but experiments could potentially investigate such effects in the near future.
I Acknowledgments
This work was supported by a MURI grant from the Air Force Office of Scientific Research numbered FA9559-09-1-0617. Supercomputing resources came from a challenge grant of the DoD at the Engineering Research and Development Center and the Air Force Research and Development Center. The collaboration was supported by the Indo-US Science and Technology Forum under the joint center numbered JC-18-2009 (Ultracold atoms). JKF also acknowledges the McDevitt bequest at Georgetown. HRK acknowledges support of the Department of Science and Technology in India. AD was in part supported by the Collaborative Research Center 1073 of the German Research Council.
References
- (1) I. Bloch, J. Dalibard, and W. Zwerger, Rev. Mod. Phys. 80, 885 (2008).
- (2) T. Esslinger, Annual Review of Condensed Matter Physics 1, 129 (2010).
- (3) J.K. Freericks, M.M. Maśka, Anzi Hu, Thomas M. Hanna, C.J. Williams, P.S. Julienne, R. Lemański, Phys. Rev. A 81, 011605(R) (2010)
- (4) M.L. Wall and L.D. Carr, Phys. Rev. Lett. 109, 055302 (2012).
- (5) P.G. Kevrekidis, G. Theocharis, D. J. Frantzeskakis, and Boris A. Malomed, Phys. Rev. Lett. 90, 230401 (2003).
- (6) F. Kh. Abdullaev, E. N. Tsoy, B. A. Malomed, and R. A. Kraenkel, Phys. Rev. A 68, 053606 (2003).
- (7) Jiangbin Gong, Luis Morales-Molina, and Peter Hänggi, Phys. Rev. Lett. 103, 133002 (2009).
- (8) Ákos Rapp, Xiaolong Deng, and Luis Santos, Phys. Rev. Lett. 109, 203005 (2012).
- (9) M. Di Liberto, C. E. Creffield, G. I. Japaridze, and C. Morais Smith, Phys. Rev. A 89, 013624 (2014).
- (10) Sebastian Greschner, Luis Santos, and Dario Poletti, preprint, arxiv:1407.6096 (2014), unpublished.
- (11) S. E. Pollack, D. Dries, and R. G. Hulet, K. M. F. Magalhaes, E. A. L. Henn, E. R. F. Ramos, M. A. Caracañhas, and V. S. Bagnato, Phys. Rev. A 81, 053627 (2010).
- (12) Ch. Chin, R. Grimm, P. Julienne, E. Tiesinga, Rev. Mod. Phys. 82, 1225 (2010).
- (13) J. Hubbard, Proceedings of the Royal Society of London 276 (1365), 238–257 (1963).
- (14) W. Kohn, Phys. Rev. 115, 809 (1959).
- (15) K. Mikelsons, J.K. Freericks, H. R. Krishnamurthy, Phys. Rev. Lett. 109, 260402 (2012).
- (16) A. Dirks, K. Mikelsons, H.R. Krishnamurthy, J.K. Freericks, Phys. Rev. A 89, 021602(R) (2014).
- (17) A. Dirks, K. Mikelsons, H.R. Krishnamurthy, J.K. Freericks, Phys. Rev. E 89, 023306 (2014).