VLA and GBT Observations of Orion B (NGC 2024, W12) : Photo-dissociation Region Properties and Magnetic field
Abstract
We present images of C110 and H110 radio recombination line (RRL) emission at 4.8 GHz and images of H166, C166 and X166 RRL emission at 1.4 GHz, observed toward the starforming region NGC 2024. The 1.4 GHz image with angular resolution 70″ is obtained using VLA data. The 4.8 GHz image with angular resolution 17″ is obtained by combining VLA and GBT data in order to add the short and zero spacing data in the uv plane. These images reveal that the spatial distributions of C110 line emission is confined to the southern rim of the H ii region close to the ionization front whereas the C166 line emission is extended in the north-south direction across the H ii region. The LSR velocity of the C110 line is 10.3 km s-1 similar to that of lines observed from molecular material located at the far side of the H ii region. This similarity suggests that the photo dissociation region (PDR) responsible for C110 line emission is at the far side of the H ii region. The LSR velocity of C166 is 8.8 km s-1. This velocity is comparable with the velocity of molecular absorption lines observed from the foreground gas, suggesting that the PDR is at the near side of the H ii region. Non-LTE models for carbon line forming regions are presented. Typical properties of the foreground PDR are K, cm, cm, path length pc and those of the far side PDR are 200 K, 50 cm, cm, 0.03 pc. Our modeling indicates that the far side PDR is located within the H ii region. We estimate magnetic field strength in the foreground PDR to be 60 G and that in the far side PDR to be 220 G. Our field estimates compare well with the values obtained from OH Zeeman observations toward NGC 2024. The H166 spectrum shows narrow (1.7 km s-1) and broad (33 km s-1) line features. The narrow line has spatial distribution and central velocity ( 9 km s-1) similar to that of the foreground carbon line emission, suggesting that they are associated. Modeling the narrow H166 emission provides physical properties K, cmand pc and implies an ionization fraction of 10-4. The broad H166 line originates from the H ii region. The X166 line has a different spatial distribution compared to other RRLs observed toward NGC 2024 and is probably associated with cold dust clouds. Based on the expected low depletion of sulphur in such clouds and the 8.1 km s-1 velocity separation between X166 and C166 lines, we interpret that the X166 transition arises from sulphur.
1 Introduction
NGC 2024 (Orion B, W12, Flame Nebula) is a well studied starforming region located at a distance of 415 pc (Anthony-Twarog 1982) in an extended ( 1o.5 4o) molecular cloud complex of mass 105 M(Tucker et al. 1973). It is located about 4o north of the Great Orion Nebula (Orion A). The optical emission from the nebula is obscured by a dark dusty structure in the molecular material. The main ionizing star is IRS2b, a star in the spectral range O8 V – B2 V (Bik et al. 2003).
At radio wavelengths, NGC 2024 is a source of abundant molecular and recombination line emission (see for example, Buckle et al. 2010, Anantharamaiah et al. 1990). Radio recombination line (RRL) emission from NGC 2024 is particularly striking as spectral transitions of hydrogen, carbon and a heavy element are observed. The richness of RRL emission toward NGC 2024 has led to several single dish recombination line observations (Palmer et al. 1967, Gordon 1969, Chaisson 1973, MacLeod et al. 1975, Rickard et al. 1977, Wilson & Thomasson 1975, Pankonin et al. 1977, Krügel et al. 1982).
The hydrogen radio recombination lines (HRRLs) observed at frequencies 2 GHz show broad ( 30 km s-1) and narrow (4 km s-1) components. The broad HRRL arises from the H ii region and is also observed at frequencies 2 GHz (Krügel et al. 1982). The central velocity and turbulent width features of broad HRRL as well as the radio continuum emission suggest that the H ii region is ionization bounded to the S (Krügel et al. 1982). The narrow hydrogen line, referred to as H0RRL, has an LSR velocity 9 km s-1 (Ball et al. 1970).
The carbon radio recombination line (CRRL) observed toward NGC 2024 at low frequencies (2 GHz) has an LSR velocity of 9 km s-1. At these frequencies, the CRRL emission is dominated by stimulated emission, suggesting that the carbon line originates from partially ionized gas in front of the H ii region (Dupree 1974, Hoang-Binh & Walmsley 1974, Wilson & Thomasson 1975, Pankonin et al. 1977, Krügel et al. 1982). This partially ionized gas, located at the interface between the H ii region and molecular material, is referred to as photo-dissociation region (PDR). The high resolution (45″) interferometric observation of RRLs toward NGC 2024 at 1.4 GHz shows velocity and spatial coincidence of CRRL and H0RRL emission, suggesting that the two line forming regions coexist (Anantharamaiah et al. 1990).
The CRRLs observed at high frequencies (5 GHz) have LSR velocity 10 km s-1 (Pankonin et al. 1977) similar to that of line emission from dense molecular material at the far side of the H ii region. This similarity suggests that the high frequency carbon lines originate from PDR located at the far side (Pankonin et al. 1977, Krügel et al. 1982).
The spectrum at frequencies 2 GHz also shows a line component with LSR velocity 0 km s-1 with respect to carbon line. This line is attributed to emission from a heavy element and is referred to as Xn, where n is the principal quantum number.
In addition to RRL detections, there are numerous observations of molecular lines (CS, HCN, OH, H2CO, CO; Buckle et al. 2010, Graf et al. 1993 and reference therein), IR fine structure lines (CI, CII; eg. Graf et al. 2012 and reference therein), H i 21cm line (van der Werf et al. 1993 and reference therein) and IR continuum (Mezger et al. 1992 and reference therein) toward NGC 2024. High angular resolution ( 13″) H2CO observations at 6 cm have shown absorption lines against the H ii region with a velocity of 9 km s-1 (Crutcher et al. 1986). This gas, located in front of the H ii region, has a density, 8 104 cm(Henkel et al. 1980). Millimeter wave emission lines of H2CO, on the other hand, are observed at a velocity 10.5 km s-1 with a derived gas density, 3.6 105 cm(Mangnum & Wootten 1993). The study of CS line emission at 10.5 km s-1 has shown that the core of the molecular cloud may have density 2 106 cm(Snell et al. 1984). The presence of a two component gas structure is also evident from other molecular line (eg. CO) observations (eg. Graf et al. 1993), as well as H i absorption line data (van der Werf et al. 1993).
The picture of the NGC 2024 gas distribution that emerges from previous studies is the following : the low density ( 105 cm) component, part of which is located in front of the H ii region, has a total mass 300 Mand the dense ( 106 cm) gas, located at the far side and S of the H ii region, has size 0.04 0.3 pc extending along a N-S direction with mass 140 M(Barnes et al. 1989, Mezger et al. 1992). In this picture, the PDR responsible for the low frequency CRRL and H0RRL emissions is co-located with the foreground low density gas while the high frequency CRRLs originate from the PDR associated with the denser material at the far side of the H ii region (eg. Wilson & Thomasson 1975, Pankonin et al. 1977, Krügel et al. 1982).
Almost all previous studies of RRL emission toward NGC 2024 were single dish observations. At frequencies 15 GHz, the angular resolutions of these observations are several arcminutes. The angular resolution of the single dish observations are, however, inadequate for modeling CRRL and H0RRL emission as the beam dilution factor is unknown. High angular resolution images at frequencies 15 GHz with full spatial information are needed to better estimate the physical properties of the PDR. In this paper, we present new high sensitive, high angular resolution RRL observations toward NGC 2024 at 1.4 GHz (angular resolution 70″) and 4.8 GHz (angular resolution 17″) with the VLA (Very Large Array). To obtain the complete spatial information at 4.8 GHz, we combined RRL observations made with the GBT (Green Bank Telescope) to VLA data. The observations and data analysis methods are described in Section 2. The observed features of the continuum and RRL emission are discussed in Section 3 and 4, respectively. The data set is used to model the physical properties of the region responsible for CRRL and H0RRL emission, which is discussed in Section 5. In Section 6, the physical properties are used to derive the magnetic field in the CRRL emitting region using method proposed by Roshi (2007). Discussion and summary of the results are given in Section 7.
2 Observation and data reduction
We observed recombination lines toward NGC 2024 using the D-configuration of the VLA near 1.4 and 4.8 GHz in dual polarization mode. The RRLs observed are the 166 transition of carbon (1425.444 MHz) and hydrogen (1424.734 MHz) near 1.4 GHz and the 110 transition of carbon (4876.589 MHz) and hydrogen (4874.157 MHz) near 4.8 GHz. The uv sampling of VLA at the shortest spacing is not adequate to image the full angular extent of NGC 2024 at 4.8 GHz. Therefore we observed the source in “On-the-fly” mapping mode with the Green Bank Telescope (GBT) at 4.8 GHz and combined this data with that obtained with the VLA at the same frequency. Both VLA and GBT observations were done during test times. A summary of the observation log is given in Table 1.
The interferometric data was analyzed using Astronomical Image Processing Software (AIPS). After editing and calibration of the default continuum data provided by the VLA (channel 0 data), the flag and calibration tables were transferred to the spectral line data set. The system band-shapes were obtained with the AIPS task BPASS. 3C48 was observed at both frequencies for bandpass and flux density calibration. For continuum subtraction the task UVLSF was used, which also provided the continuum data. The spectral cubes and continuum images were obtained with the AIPS task IMAGR. The final images were corrected for primary beam gain variation using the task PBCOR.
An “On-the-fly” map of size about 0o.5 0o.5 centered at RA(2000) , DEC(2000) was made with the GBT. The telescope was scanned along RA and at the end of every 6th RA scan a reference position (RA(2000) , DEC(2000) ) was observed. The FWHM beam width of the GBT at the observing freq of 4.9 GHz is 2′.5. The RA scan rate and integration time were chosen to provide about 4 samples within the 2′.5 beam. Along the declination direction, the telescope was scanned at an interval of 0′.5. The GBT data were analyzed using GBTIDL. A modified version of task ‘getrefscan’ was used to obtain the spectra in units of antenna temperature and re-sampled to the spectral resolution corresponding to the VLA data. A telescope gain of 2 K/Jy was used to convert the spectra in units of Jy per beam. The telescope gain was also measured by observing the calibrator source 3C123. A 3rd order polynomial baseline was removed from each of the calibrated spectrum. The zeroth order coefficient of the polynomial baseline was used to obtain the continuum data set. The calibrated data were converted to a UVFITS file using the program SDFITS2UV, developed by Glenn Langston. The UVFITS file was transferred to AIPS and the image was made using the SDGRID task. The VLA and GBT data were combined using the CASA function Feather.
3 Continuum Emission
The continuum images of NGC 2024 at 1.4 GHz and 4.8 GHz are shown in Fig. 1. The angular resolution of the 1.4 GHz image obtained from VLA data is 75″ 67″ and the total flux density is 61.0 1.2 Jy. The image at 4.8 GHz, obtained from the combined GBT and VLA data, has an angular resolution of 22″ 20″. The total flux density in this image is 52.5 0.2 Jy. This value is less than the flux-density (57 3 Jy) in the low resolution (152″ 152″) GBT image. The half power beamwidth of the VLA antenna at 4.8 GHz is 10′ and, for our observations, centered at RA(2000) , DEC(2000) . As seen in Fig. 1, the continuum emission in the GBT image and the 1.4 GHz VLA image extends beyond the 10′ beamwidth of the VLA antennas at 4.8 GHz. We therefore attribute the difference in flux density in the 4.8 GHz GBT image and the 4.8 GHz combined data image to emission extending beyond the half power beam width of the VLA antenna. The flux density obtained for NGC 2024 at the two frequencies are consistent with earlier observations (eg. Barnes et al. 1989).
Our continuum images are consistent with higher resolution (4″.9 3″.8) images of Barnes et al. (1989) as well as those presented by Anantharamaiah et al. (1990). A radio plume extending roughly 5′ northwards from the main nebula emission is detected in both the 1.4 GHz VLA image and 4.8 GHz GBT image (see Fig. 1). The radio plume was detected and imaged earlier at other frequencies as well (see, for example, Subrahmanyan et al. 1997 at 327 MHz).
4 Recombination Line Emission towards NGC 2024
We have detected broad ( km s-1) H166 and H110 lines at the two observed frequencies (1.4 and 4.8 GHz). The C166 and C110 transitions are also detected. In addition, the H0166 and X166 lines are detected at 1.4 GHz observations. In this Section, we present images of the line emission and their observed characteristics.
4.1 H and H0 Recombination Lines
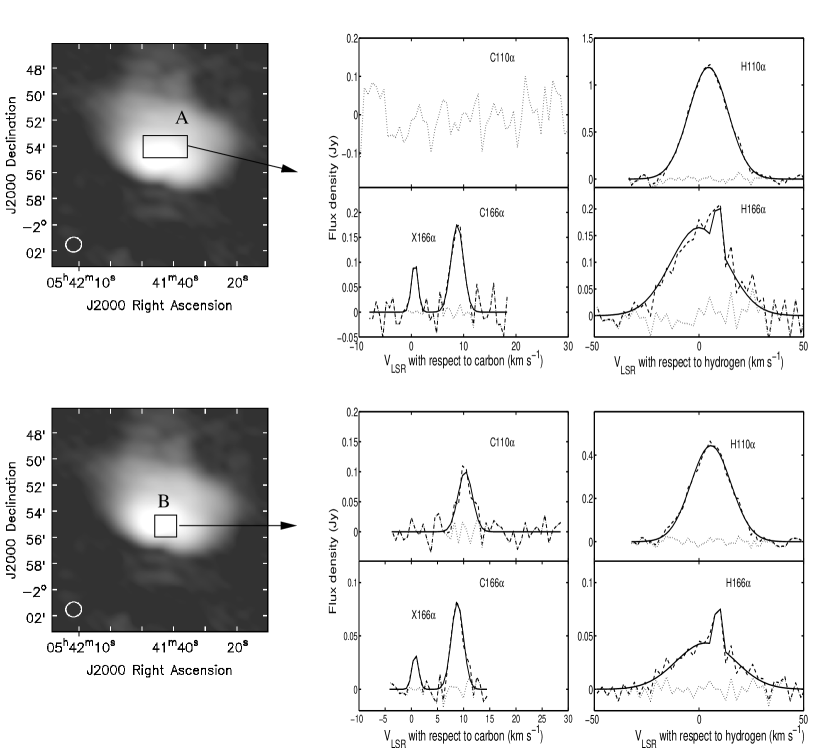
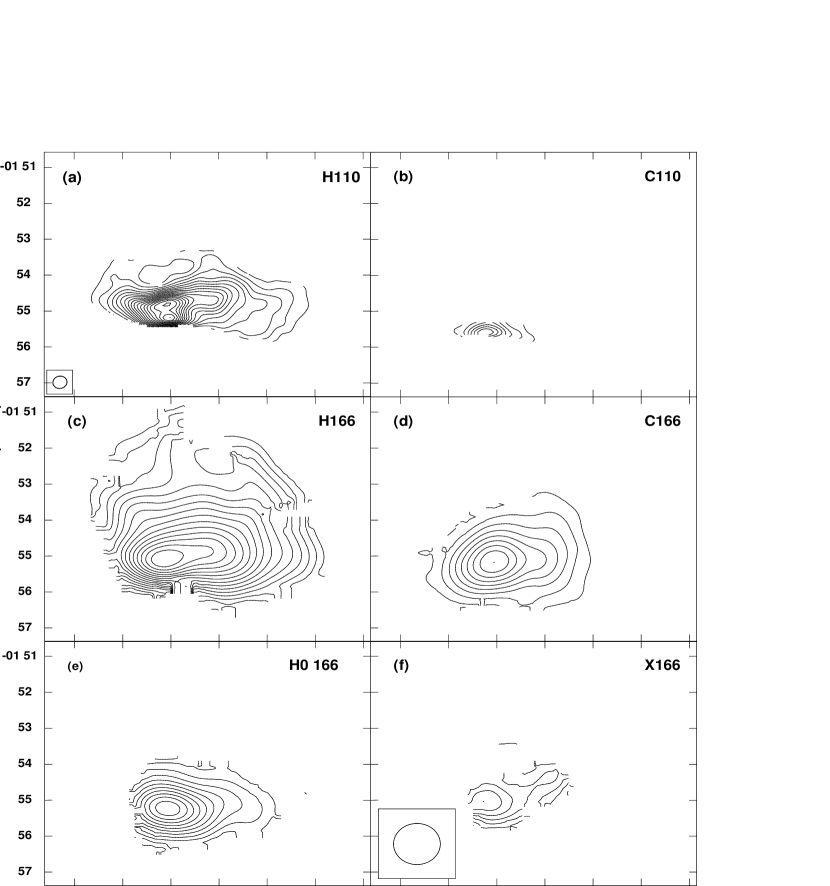
Representative profiles of H110 and H166 line emission are shown in Fig. 2. The line parameters are summarized in Table 2. The regions over which the data is averaged to obtain the profiles are also included in Table 2. The H166 line emission shows a narrow component ( 1.7 km s-1) in addition to a broad feature ( 33 km s-1). At 4.8 GHz only the broad component is detected, with a line width km s-1. The spatial distributions of the broad HRRL at the two observed frequencies are shown in Fig. 3.
The line-to-continuum ratio of the broad H110 provides an electron temperature of 7200 K (assuming LTE). This value is consistent with the electron temperature obtained by Krügel et al. (1982) from H76 observations. As mentioned above, the observed H166 line width is 1.5 times higher than the width of H110 line. We suggest that the increase in line width is due to pressure broadening. The inferred local electron density is 1400 cm. The transverse size of the H ii region is 0.3 pc. If we assume that the extent of the H ii region along the line-of-sight is also 0.3 pc, then the derived electron density indicates an emission measure of 6 105 cmpc. This value is comparable to the emission measure derived from other observations (eg. Subrahmanyan et al. 1997 at 327 MHz).
The H0166 line is detected over a 2′ 4′ region and is centered near the continuum peak (see Fig. 3). The spatial distribution of line emission obtained from our data is similar to that observed earlier by Anantharamaiah et al. (1990). The LSR velocity ( 9 km s-1) of this feature is about 5 km s-1 higher than that of the broad H166 line and is closer to the central velocity of the C166 line emission (see below). The spatial distributions of both H0166 and C166 lines are also in good agreement.
4.2 Carbon Recombination Lines
Representative profiles and images of carbon line emission are shown in Fig. 2 and Fig. 3, respectively. The C110 line emission is detected over a region 0′.5 2′.5, confined to the southern ridge along the H ii region – molecular cloud interface. The integrated line flux density of C110 transition is 425 mJy. The central velocity of the C110 line ranges between 10.0 and 10.5 km s-1, with an average 10.25 km s-1.
The angular size of C166 line emission is 2.5′ 5′, larger than the angular size of C110 line emission. The distinct feature of C166 emission is that the LSR velocity ranges from 8.7 km s-1 to 10.5 km s-1. The C166 line emission to the N has velocity 8.8 km s-1 while the emission to the SE, nearer the ionization front, has a velocity 10.0 km s-1. The similar central velocity of the southern C166 emission and C110 line emission suggests that the two line forming regions are associated.
The spatial distributions of the H0166 and C166 line emissions in the VLA images are similar (see Fig. 3). Further, the central velocity of H0166 line ( 9 km s-1 ) is comparable to the northern C166 line emission. The line widths of the two lines are also comparable. These similarities suggest that the two line forming regions are spatially co-located (see also Anantharamaiah et al. 1990).
Molecular line observations over a wide range of frequencies (1.6 GHz to 100 GHz) have shown that the H ii region is partially enclosed by the parent molecular cloud (Barnes et al. 1989; see also Fig. 5 and Section 7). The LSR velocity of the gas in front of the H ii region is 9 km s-1, similar to the central velocity of the northern C166 line emission. This similarity in LSR velocity suggests that the low frequency ( 2 GHz) carbon line forming region is associated with molecular gas in front of the H ii region. The dense gas located on the far side has an LSR velocity 10.5 km s-1 (see for example Mangnum & Wootten 1993). This LSR velocity compares well with that of the C110 line, suggesting that the line emission is associated with the dense gas located on the far side of the H ii region. (see also Section 7 and Fig. 5).
4.3 X Recombination Lines
The velocity of X166 is 8.1 km s-1 relative to the C166 line, which implies a transition from a heavy element such as S, Mg, Si or Fe. The spatial distribution of X166 emission is shown in Fig. 3 and representative line profiles are shown in Fig 2. The spatial distribution and line width of X166 are different from those of C166 and H0166. We conclude that the X166 line emission is not associated with the carbon and H0 line forming regions. Anantharamaiah et al. (1990) came to a similar conclusion based on their 1.4 GHz observations. The X166 line width is about 0.8 km s-1, which is about one third that of the carbon line. This smaller width may suggest that the X166 line is associated with colder ( 100 K) dust clouds. In such clouds sulphur is less depleted relative to other heaver elements such as Mg, Si and Fe (Pankonin et al. 1977). Based on the expected low depletion of sulphur and velocity separation, we suggest that the X166 line emission arises from sulphur.
5 Models for Carbon and H0166 Line emission
We consider a simplified model consisting of homogeneous ‘slabs’ of PDR, co-located with the molecular gas. The recombination line flux density from the PDRs is obtained by solving the radiative transfer equation for non-LTE cases. A program to compute the non-LTE departure coefficients and was developed. This program uses new numerical techniques to solve for the departure coefficients based on the formulism developed by Brocklehurst & Salem (1977) and Walmsley & Watson (1982). For a given gas temperature () and electron density (), we solve separately for the departure co-efficients of hydrogenic and carbon cases. The atomic level population is altered by stimulated emission, which is due to background radiation field. Therefore, a background thermal radiation field from the H ii region (see below) is included when solving for the departure co-efficients. The depletion of carbon in PDR is inferred to be small ( 25 % Natta et al. 1994). Therefore in our computation the abundance of carbon is taken to be 0.75 of the cosmic value 3.98 10-4 (Morton 1974). The dielectronic like recombination process that modifies the level population of the carbon atom (Walmsley & Watson 1982) is also included in the calculation. The coefficients are computed by considering a 10000 level atom with the boundary condition at higher quantum states.
The line brightness temperature, , due to the slab is given by (Shaver 1975)
| (1) |
where
| (2) |
is the contribution to the line temperature due to the background radiation field and is the intrinsic line emission from the slab. In Eq. 2, is the background radiation temperature due to the H ii region; is the continuum optical depth of the PDR. The non-LTE line optical depth of the spectral transition from energy state to , , is defined as where is the LTE line optical depth, and are the departure coefficients of energy state . , where is the ion density and is the line-of-sight path length of the PDR; is equal to for the carbon line computation, while is equal to for the hydrogen line computation. For the carbon line computation we assume that ; thus . The neutral density, , in the PDR is obtained as . The line brightness temperature is finally converted to flux density using the observed angular sizes of the line emission, tabulated in Table 2.
5.1 Foreground Carbon line emission
The observed parameters of the line emission from the foreground PDR is obtained by averaging the spectra over region A shown in Fig. 2. The region is selected such that it is northward of the C110 line emission, thus avoiding contribution from the PDR emission from the far side of the H ii region. The line and continuum parameters are given in Table 2. The images at the two observed frequencies are convolved to the same angular resolution (73″ 69″) before obtaining these parameters. The continuum flux density at 1.4 and 4.8 GHz toward region A is consistent with emission from an H ii region with parameters Te 7000 K and EM 3.5 105 pc cm.
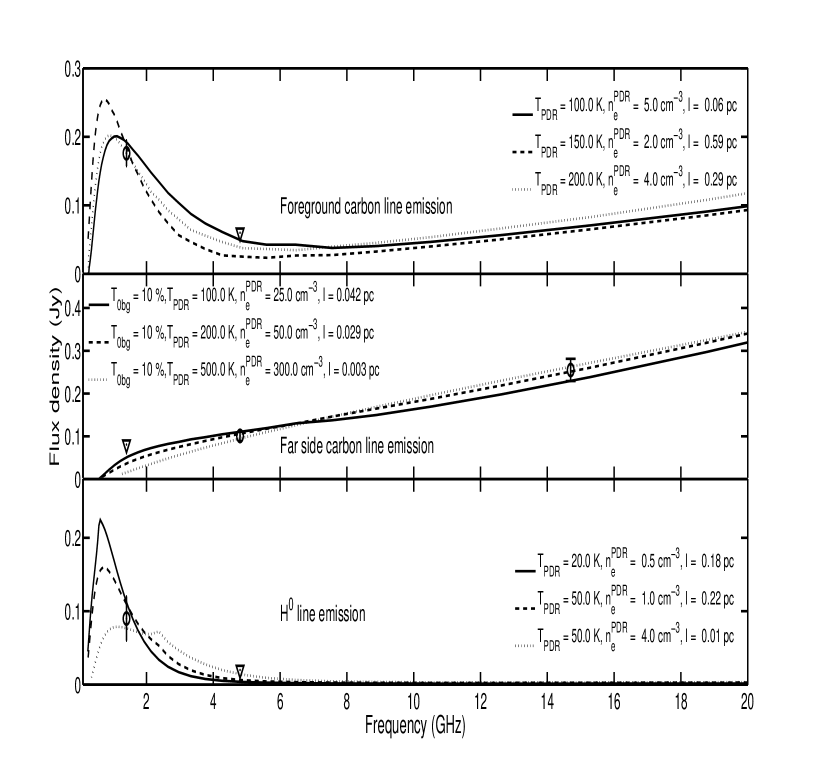
The foreground PDR is approximated with a slab of partially ionized gas with background radio continuum emission due to H ii region with the above mentioned properties. Departure coefficients are obtained for a set of between 100 and 200 K and between 1 and 10 cm. The model flux density for these gas properties are required to be consistent with the observed values. This requirement is realized by varying . A range of models are found to be consistent with the observed RRL data. Model flux density vs frequency for three gas properties are shown in Fig. 4. Modeling shows that the upper limit on is 5 cm, corresponding to a neutral density of 1.7 cm. For this density, the thickness of the PDR would be 0.06 pc, if the gas temperature is 100 K. To further constrain the PDR properties, we compare the neutral density with values obtained for the foreground gas from molecular line observations. The density obtained from H2CO absorption studies is 4 104 cm. This density is in rough agreement with the neutral density for the cmmodel. Based on this agreement, we conclude that the physical properties of the foreground PDR is K, cm, cmand pc.
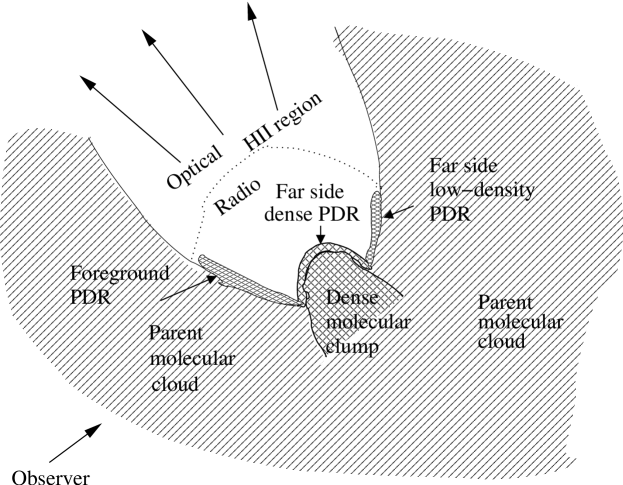
The H ii region in NGC 2024 is partially enclosed in the parent molecular cloud (see Fig. 5). In this geometry, a PDR with similar physical properties as that of the foreground PDR should exist on the far side of the H ii region. This PDR is referred to as ‘far side low-density PDR’ in Fig. 5. We investigate whether such a PDR would produce observable RRLs. For this investigation, the line flux density is calculated by setting the background continuum emission to zero (ie in Eq. 2). The computed line flux density is 10 mJy at all the observed frequencies and therefore we conclude that RRLs from such a PDR would not be detectable. This lower flux density is due to lack of stimulated emission in the absence of background continuum emission.
5.2 Carbon line emission from the far side of the H ii region
The observed parameters of the carbon line from the far side of the H ii region are obtained by averaging the data over region B shown in Fig 2. Region B is chosen so as to minimize contamination from the foreground PDR at 1.4 GHz. The images at the two observed frequencies are convolved to the same angular resolution (73″ 69″) to obtain these parameters. The line and continuum parameters are listed in Table 2. The continuum emission within region B is consistent with emission from ionized gas of Te 7000 K, EM 5 105 pc cm.
The LSR velocity of carbon line (10.3 km s-1), is similar to the velocity of dense molecular tracers observed from the far side of the H ii region. H i , OH and H2CO lines show absorption features near 10 km s-1 as well as a component near 9 km s-1 . The component near 9 km s-1 is due to foreground gas. The absorption line near 10 km s-1 indicates that a part of the continuum emission is located behind the gas responsible for this line component (see also Crutcher et al. 1999). As mentioned earlier, the PDR responsible for the 10 km s-1 carbon line emission is co-located with this gas. Thus the PDR responsible for the 10 km s-1 line component must be located within the H ii region (see Fig. 5 and Section 7). As discussed below such a geometry is required to explain the CRRL emission from this PDR.
To model carbon line emission, we approximate the far side PDR to be a single slab of partially ionized gas. OH observation shows that a small part of the radio continuum is located behind this PDR (Crutcher et al. 1999). For modeling, we assume that 10 % of the observed radio continuum emission is located behind the PDR. The line flux densities used to constrain the model are those of C166, C110 (see Table 2) and C76 emission. The line flux density of C76 averaged over region B is estimated to be 25526 mJy from the Krügel et al. (1982) observations. The foreground PDR contributes to the C166 emission, thus this line flux density defines an upper limit to the emission from the far side PDR at 1.4 GHz. The departure coefficients for between 100 and 500 K are computed with a thermal radiation field from ionized gas of Te 7000 K, EM 5 105 pc cm. Results from three representative models are shown in Fig. 4. We found that for gas temperature between 100 and 500 K, models with in the range 25 to 300 cm are consistent with the carbon line observations. The temperature of the PDR cannot be constrained. Representative physical properties for the far side PDR are K, cm, pc. The C166 flux density predicted by the model is about half the observed value. Since the electron density is an order of magnitude larger than that of the foreground PDR, we refer to this interface region as the ‘far side dense PDR’ (see Fig. 5). The neutral density in the PDR is 1.7 cm, comparable to the density derived from H2CO emission line (LSR velocity 10.5 km s-1) observations (3.6 105 cm; Mangnum & Wootten 1993).
5.3 H0 line forming region
For modeling H0 line emission, the line parameters are obtained by averaging the spectra over region B shown in Fig. 2. The line and continuum parameters are given in Table 2. The observed continuum emission from this region is consistent with emission from ionized gas with K and EM pc cm. The upper limit on the temperature of the PDR obtained from the width of H0166 line is 70 K. Therefore, for modeling H0 line emission, we considered in the range 20 to 70 K. The departure coefficients for these models were obtained for the hydrogenic case. Model flux density vs frequency is shown for three models in Fig. 4. Our data provide an upper limit for of 4 cmfor the H0 region; for higher density the model line flux density exceeds the observed upper limit at 4.8 GHz. No additional constraints on the PDR properties can be obtained from the existing data set. Representative PDR properties are : K, cmand pc. As suggested in Section 4.2, the H0 region is co-located with the foreground carbon line forming region. If we assume that the neutral density of the H0 line forming region is similar to that of the foreground PDR, the ionization fraction is 10-4.
6 Magnetic field in the PDR
Alfen waves in the PDR are strongly coupled to ions, affecting the non-thermal width of the spectral lines. Roshi (2007) used this effect to derive magnetic fields from the observed widths of carbon recombination lines. The thermal contribution to the line width is removed using the values for to obtain the non-thermal width . The magnetic field is then obtained as:
| (3) |
where is in cm sec-1, is the mass density in grams and B is in Gauss. The density, , is obtained from the neutral density in the PDR by considering the effective mass of the gas as 1.4. The derived magnetic field for the foreground PDR is 60 G and that for the far side dense PDR is 220 G. The error in the estimated field strength is due to error in the observed line width and PDR modeling limitations. We estimate the error in the derived field strength to be about 60 %.
Crutcher et al. (1999) used OH Zeeman observations to determine the distribution of magnetic field across NGC 2024. The angular resolution of their observation is 1′, comparable to our observations. The OH line component used to derive the magnetic field has LSR velocity 10.2 km s-1, similar to the carbon line emission from the far side PDR. A peak field strength of 87 5.5 G is obtained toward RA(2000): , DEC(2000): . Zeeman observations measure the line-of-sight component of the magnetic field; the measured field strengths are scaled by a factor of 2 to obtain the total magnetic field strength (Crutcher 1999). Our analysis provides the total magnetic field (see Roshi 2007) and the field strength obtained toward RA(2000): , DEC(2000): is 220 G, which compares well with the total field strength (ie 87 2 = 174 G) obtained from OH Zeeman measurements. To our knowledge no Zeeman measurements of the magnetic field strength of the foreground gas exists.
7 Discussion and Summary
Radio Recombination line transitions H166, C166, X166, H110 and C110 were imaged towards the starforming region NGC 2024. We deduced the spatial location and extent of line emitting regions from the images and the LSR velocity structure. Further, we constructed non-LTE models for RRL emission to obtain the physical properties of the line forming regions.
A schematic of NGC 2024 is shown in Fig. 5. This schematic is based on the structure of NGC 2024 proposed by Barnes et al. (1989) and Krügel et al. (1982). As illustrated, the starforming region comprises of H ii region partially enclosed by the parent molecular cloud with mean density 105 cm. A dense molecular clump, with core density larger than 106 cm, is located at the far side of the H ii region. Photo dissociation regions exist at the H ii–molecular gas interface. We refer to the interface between the parent molecular cloud and H ii region at the near side as the ‘foreground PDR’ and that at the far side as the ‘far side low-density PDR’. The interface between the dense clump and H ii region is referred to as the ‘far side dense PDR’.
The C166 line image reveals that the emission extends in the N-S direction. The LSR velocity of the line ranges from 8 km s-1 in the N to 10 km s-1 in the SE, with a mean velocity of 9 km s-1. The mean velocity is similar to that of molecular lines observed from the near side of the H ii region. Thus we conclude that the C166 emission originates in the foreground PDR. Non-LTE modeling of CRRL emission shows that this PDR has properties K, cm, cmand pc. The model also shows that in the absence of stimulated emission, CRRL emission from the far side low-density PDR is not detectable. The estimated magnetic field in the PDR is 60 G.
The image of C110 line shows that the emission is confined close to the southern boundary of the H ii region with an LSR velocity of 10.3 km s-1. This LSR velocity is similar to that of molecular lines observed from the dense clump at the far side. We conclude that the C110 originates from the far side dense PDR. From CRRL modeling we obtain properties for this PDR i.e 200 K, 50 cm, cmand 0.03 pc. To explain the observed CRRL emission we postulate that the far side dense PDR protrudes into the H ii region (see Fig. 5). We suggest that this protrusion is due to Lyman continuum photons eroding the low density molecular material on either side of the dense clump. This geometry is consistent with the detection of OH absorption line at 10 km s-1, since part of the radio continuum originates from behind the far side dense PDR (Crutcher et al. 1999). The estimated magnetic field in this PDR is 220 G, comparable with field strength obtained from OH Zeeman observations (Crutcher et al. 1999).
The H166 line exhibits narrow and broad components. The LSR velocity of narrow hydrogen is 9 km s-1, similar to that of molecular lines in the foreground gas and C166. Images of H0166 shows that the emission extends in the N-S direction and is similar to C166 emission. We conclude that the H0166 line emission is co-located with the foreground PDR. The gas properties deduced from modeling H0166 line emission are K, cmand pc. The ionization fraction in the H0 line forming region is 10-4. The broad H166 line originates from the H ii region.
A recombination line from a heaver element has been observed at 1.4 GHz. The spatial distribution of the X166 is different from that of H0166 and C166 line emission. The smaller line width of X166 compared to C166 line may indicate that the line emission is associated with colder dust clouds. Based on the expected low depletion of sulphur in such clouds and the 8.1 km s-1 velocity offset relative to C166, we conclude that the X166 line emission arises from sulphur.
Observations presented in this paper are the first high-angular resolution RRL observations with full spatial information at 4.8 GHz. The 1.4 GHz observations complement earlier interferometric observations presented by Anantharamaiah et al. (1990). Our data set was used to constrain non-LTE models of CRRL and H0RRL line emission. The high angular resolution of the observations allowed us to measure the angular size and construct models for the line forming region. Based on this modeling we have presented a new geometry for the H ii/molecular cloud toward NGC 2024 (see Fig 5). We have also used the data set to demonstrate for the first time that the magnetic field obtained using CRRLs is comparable with values obtained from Zeeman observations.
| Parameters | Values | |
|---|---|---|
| 166 | 110 | |
| VLA observations | ||
| Date of observations | 08-SEP-2000 | 01-AUG-2000 |
| Field center RA (J2000) | ||
| Field center DEC (J2000) | ||
| RRLs observed | C166 | C110 |
| H166 | H110 | |
| Velocity range (km s-1) – CRRL | 40 | 47 |
| – HRRL | 162 | 95 |
| Velocity resolution (km s-1)– CRRL | 1.3 | 1.5 |
| – HRRL | 3.1 | 1.8 |
| Phase calibrator | J0521+166 | J0530+135 |
| On-source observing time (hrs) | 2.9 | 2.6 |
| Synthesized beam (arcsec) | 75 67 | 18 15 |
| Position angle of the | ||
| synthesized beam (deg) | ||
| Largest angular size (arcmin) | 20 | 6.5 |
| RMS noise in the spectral | ||
| cube (mJy/beam) | 8 | 15 |
| RMS noise in the | ||
| continuum images (mJy/beam) | 4 | 22 |
| GBT observations | ||
| Date of observations | 12-AUG-2002 | |
| Field center RA (J2000) | 05h39m13s.0 | |
| Field center DEC (J2000) | 01o5604 | |
| RRLs observed | C110, H110 | |
| Velocity range (km s-1) | 308 | |
| Velocity resolution (km s-1) | 0.3 | |
| On-source observing time (hrs) | 1.0 | |
| Beam (arcmin) | 2.7 2.7 | |
| RMS noise in the spectral | ||
| cube (mJy/beam) | 34 | |
| RMS noise in the | ||
| continuum images (mJy/beam) | 12 | |
| Line | Flux density | VLSR | aaLine widths are corrected for the broadening due to finite spectral resolution. | SizebbSize of the region over which the data are averaged to obtain the spectra. | Comment | |
|---|---|---|---|---|---|---|
| cont | line | |||||
| (Jy) | (Jy) | (km s-1) | (km s-1) | (″ ″) | ||
| HII region | ||||||
| H166 | 7.1 | 0.044(0.004) | 3.3(1.2) | 33.4(2.8) | 76 76 | Note c |
| H110 | 6.9 | 0.444(0.006) | 5.7(0.1) | 22.6(0.3) | 76 76 | Note c |
| H0 line | ||||||
| H0166 | 7.1 | 0.09(0.01ggThe error in amplitude is estimated from the residual spectrum obtained after subtracting the Gaussian components) | 9.0 | 1.7(1.5) | 76 76 | Note c |
| H0110 | 6.9 | (0.02) | 76 76 | Note c | ||
| Far side carbon line emission | ||||||
| C166 | 7.1 | 0.08(0.01)ffThe C166 line flux density can have a contribution from foreground PDR and therefore the listed flux density should be considered as an upper limit to the emission from the far side PDR. | 8.8(0.1) | 2.4(0.2) | 76 76 | Note c |
| C110 | 6.9 | 0.10(0.01) | 10.3(0.2) | 2.8(0.4) | 76 76 | Note c |
| Foreground carbon line emission | ||||||
| C166 | 22.3 | 0.18(0.02) | 8.8(0.2) | 2.5(0.3) | 236 108 | Note d |
| C110 | 20.1 | (0.06) | 236 108 | Note d | ||
| X region | ||||||
| X166 | 22.3 | 0.10(0.03) | 0.7eeLSR velocity with respect to carbon.(0.2) | 0.8(0.4) | 236 108 | Note d |
| X110 | 20.1 | (0.06) | 236 108 | Note d | ||
References
- Anantharamaiah et al. (1990) Anantharamaiah, K. R., Goss, W. M. & Dewdney, P. E. 1990, in Proceedings of IAU Colloq. 125, Radio Recombination Lines: 25 Years of Investigation, ed. M. A. Gordon & R. L. Sorochenko ( Puschino, USSR: Dordrecht:Kluwer), 123
- Anthony-Twarog (1982) Anthony-Twarog, B. J. 1982, AJ, 87, 1213
- Ball et al. (1970) Ball, J. A., Cesarsky, D., Dupree, A. K., Goldberg, L., & Lilley, A. E. 1970, ApJ, 162L, 25
- Barnes et al. (1989) Barnes, P. J., Crutcher, R. M., Bieging, J. H., Storey, J. W. V., & Willner, S. P. 1989, ApJ, 342, 883
- Bik et al. (2003) Bik, A., Lenorzer, A., Kaper, L., et al. 2003, A&A, 404, 249
- Brocklehurst & Salem (1977) Brocklehurst, M. & Salem, M. 1977, Computer Phys. Commun., 13, 39
- Buckle et al. (2010) Buckle, J. V., Curtis, E. I., Roberts, J. F., et al. 2010, MNRAS, 401, 204
- Chaisson (1973) Chaisson, E. J. 1973, ApJ, 182, 767
- Crutcher et al. (1999) Crutcher, R. M., Roberts, D. A., Troland, T. H., & Goss, W. M. 1999, ApJ, 515, 275
- Crutcher (1999) Crutcher, R. M. 1999, ApJ, 520, 706
- Crutcher et al. (1986) Crutcher, R. M., Henkel, C., Wilson, T. L., Johnston, K. J., & Bieging, J. H. 1986, ApJ, 307, 302
- Dupree (1974) Dupree, A. K. 1974, ApJ, 187, 25
- Gordon (1969) Gordon, M. A. 1969, ApJ, 158, 479
- Graf et al. (1993) Graf, U. U., Eckart, A., Genzel, R., et al. 1993, ApJ, 405, 249
- Graf et al. (2012) Graf, U. U., Simon, R., Stutzki, J., et al. 2012, A&A, 542L, 16
- Henkel et al. (1980) Henkel, C., Walmsley, C. M., & Wilson, T. L. 1980, A&A, 82, 41
- Hoang-Binh & Walmsley (1974) Hoang-Binh, D., & Walmsley, C. M. 1974, A&A, 35, 49
- Krügel et al. (1982) Krügel, E., Thum, C., Pankonin, V., & Martin-Pintado, J. 1982, A&AS, 48, 345
- MacLeod et al. (1975) MacLeod, J. M., Doherty, L. H., & Higgs, L. A. 1975, A&A, 42, 195
- Mangnum & Wootten (1993) Mangnum, G. J., & Wootten, A. 1993, ApJS, 89, 123
- Mezger et al. (1992) Mezger, P. G., Sievers, A. W., Haslam, C. G. T., et al. 1992, A&A, 256, 631
- Morton (1974) Morton, D. C, 1974, ApJL 193, L35
- Natta et al. (1994) Natta, A., Walmsley, C. M., & Tielens, A. G. G. M. 1994, ApJ, 428, 209
- Palmer et al. (1967) Palmer, P., Zuckerman, B., Penfield, H., Lilley, A. F., & Mezger, P. G. 1967, AJ, 72, 821
- Pankonin et al. (1977) Pankonin, V., Walmsley, C. M., Wilson, T. L., & Thomasson, P. 1977, A&A, 57, 341
- Roshi (2007) Roshi, D. A. 2007, ApJ, 658L, 41
- Shaver (1975) Shaver, P. A. 1975, Parmana, 5, 1
- Snell et al. (1984) Snell, R. L, Mundy, L. G., Goldsmith, P. F., Evans II, N. J., & Erickson, N. R. 1984, ApJ, 276, 625
- Subrahmanyan et al. (1997) Subrahmanyan, R., Goss, W. M., Megeath, S. T., & Barnes, P. J. 1997, MNRAS, 290, 431
- Tucker et al. (1973) Tucker, K. D., Kutner, M. L., & Thaddeus, P. 1973, ApJ, 186L, 13
- Rickard et al. (1977) Rickard, L. J, Zuckerman, B., Palmer, P., & Turner, B. E. 1977, ApJ, 218, 659
- van der Werf et al. (1993) van der Werf, P. P., Goss. W. M., Heiles, C., Crutcher, R. M., & Troland, T. H. 1993, ApJ, 411, 247
- Walmsley & Watson (1982) Walmsley C. M., & Watson W. D. 1982, ApJ, 260, 317
- Wilson & Thomasson (1975) Wilson, T. L., & Thomasson, P. 1975, A&A, 43, 167