Quasi-periodicities of the BL Lac Object PKS 2155-304
Abstract
We have searched for periodicities in our VRIJHK photometry of PKS 2155-304, which covers the years 2005-2012. A peak of the Fourier spectrum with high significance is found at T315 days, confirming the recent findings by Zhang et al. (2014). The examination of the gamma-ray light curves from the Fermi archives yields a significant signal at 2T, which, while nominally significant, involves data spanning only 6T. Assuming a black hole mass of the Keplerian distance corresponding to the quasi-period T is cm, about 50 Schwarzschild radii.
1 Introduction
Variability is one of the main tools for constraining models of BL Lac objects. The time scales can be so short (e.g. hours, minutes) that, even taking into account relativistic beaming effects, they can shed light on sizes comparable with the gravitational radius of the black hole that is supposed to lie at their center (e.g. Urry & Padovani, 1991). Variability on month/year time scale is a probe of the relativistic jet structure indicating for instance a global helicoidal pattern, and a possible stratification in the direction perpendicular to the jet axis (e.g. Marscher et al., 2008). This kind of variability is essentially non periodic, describing turbulent mechanisms that may ultimately have been triggered by some instability in the accretion process (e.g. Ulrich et al., 1997).
Up to now the only strong claim of periodicity in emission of a BL Lac object was raised in the case of OJ 287 where, on the basis of optical records extending for a century, a period of 12 years was suggested (Sillanpaa et al., 1988). It may be interpreted as a Keplerian period of a system of two black holes of masses 1.7 x and 1.4 x and orbital semi-major axis of 0.056 pc (Lehto & Valtonen, 1996). Note, however, that this periodicity is still widely discussed (e.g. Hudec et al., 2013).
In this letter we concentrate on the case of the BL Lac object PKS 2155-304 (z=0.116, V 13), which is a prototype of the class, and one of the most intensely observed objects, since its discovery in the seventies. It is a highly variable source, and numerous multifrequency observations from radio to TeV are now available (e.g. Aharonian et al., 2007; Foschini et al., 2008, and references therein). Possible quasi-periodicities on various time scales have been reported. Urry et al. (1993) found a repetition time scale of 0.7 days in ultraviolet and optical bands in a campaign lasting about one month. Lachowicz et al. (2009) using few days of data from XMM-Newton proposed a quasi-periodicity of 4.6 h, with a rather convincing sinusoidal folded light curve. Fan & Lin (2000) collected a miscellaneous set of data from 17 years of UBVRI observations, and found evidence of quasi-periodicity at 4 and 7 years.
More recently Zhang et al. (2014) made a collection of rather inhomogeneous optical data over the last 35 years. In particular they produced an R-band light curve with 8000 points deriving from the photometrical data of 25 different astronomical groups. This light curve was searched for periodicity with various procedures, namely, epoch-folding (Leahy et al., 1983), the Jurkevich method (Jurkevich, 1971) and the discrete correlation function (Edelson & Krolik, 1988), that yielded, with high significance, a quasi-period T 317 days.
2 REM data
Our photometric study of PKS 2155-304 was obtained with the Rapid Eye Mounting Telescope (REM, 60 cm, Zerbi et al., 2004; Covino et al., 2004) in the VRIJHK bands from 2005/05/18 (MJD 53508) to 2012/05/29 (MJD 56076). Results and details about reduction and analysis procedures are thoroughly discussed in Sandrinelli et al. (2014). Instrumental magnitudes were obtained via aperture photometry. Calibration was performed by means of comparison stars in the field reported in Two Micron All Sky Survey Catalog111http://www.ipac.caltech.edu/2mass/ (2MASS, Skrutskie et al., 2006) for NIR images and in Hamuy & Maza (1989) for the optical. Check stars were used in all CCD frames. Though the photometry is fully automatized, a direct eye check of the data was performed. Several frames were excluded, because the target or the reference stars were at the border, or other obvious problems were apparent.
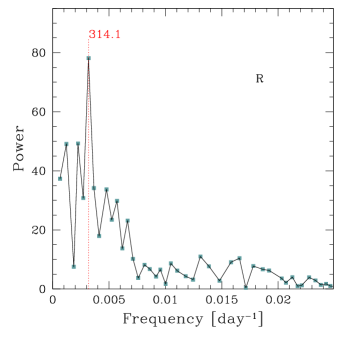
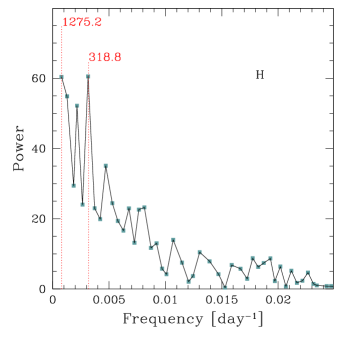
Since we are interested in a long periodicity, we considered light curves based on nightly averages. We searched for periodicity using the Date Compensated Discrete Fourier Transform (DC DFT, Ferraz-Mello, 1981; Foster, 1995) and the Lomb-Scargle (LS) algorithms (Scargle, 1982). Results are reported in Table 1 and in Figure 1. The Fourier spectra of the photometry in the VIJK filters are very similar to those in R and H, and are not reported in the Figure.
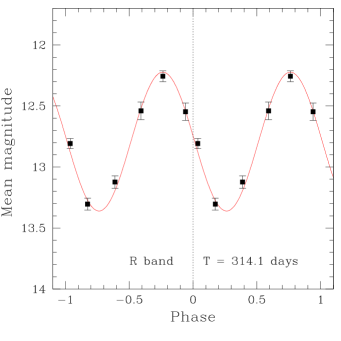
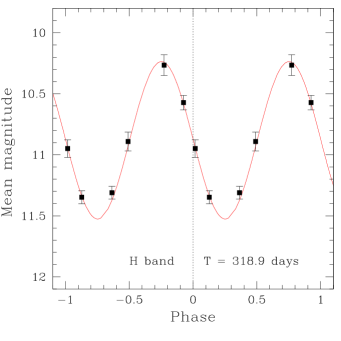
Our most prominent peaks are in the = 306-319 days range and their significance is high. In the NIR Fourier spectra other noticeable peaks appear at 461 days and at 1270 days (). Folded light curves based on DC-DFT222http://www.aavso.org periods are shown in Figure 1, where data are divided in width bins. The folded light curves are clearly sinusoidal, with an amplitude of 0.6 mag. Therefore we basically confirm the results of Zhang et al. (2014) with completely independent optical and NIR data.
| LS | DC-DFT | ||||||||
| Band | T | Power | p-value | T | Power | A | p-value | ||
| [days] | [days] | [mag] | |||||||
| (a) | (b) | (c) | (d) | (e) | (f) | (g) | (h) | (i) | (j) |
| V | 1938 | 275 | 306 | 75.42 | 309 | 81.15 | 0.65 | ||
| R | 1903 | 297 | 309 | 74.54 | 314 | 78.14 | 0.60 | ||
| I | 1743 | 281 | 315 | 77.85 | 316 | 76.24 | 0.58 | ||
| J | 547 | 274 | 317 | 62.21 | 316 | 62.99 | 0.65 | ||
| H | 646 | 258 | 314 | 62.32 | 319 | 60.50 | 0.64 | ||
| K | 455 | 243 | 318 | 61.09 | 317 | 62.03 | 0.71 | ||
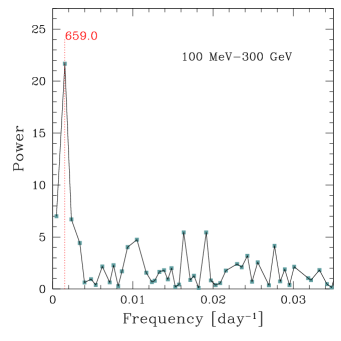
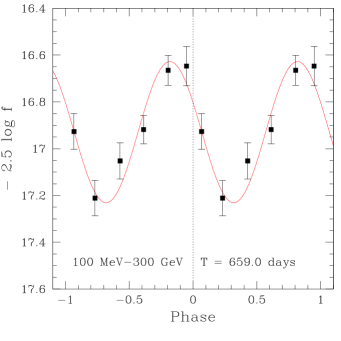
| 100 MeV - 300 GeV | – | 305 | 650 | 22.02 | 659 | 21.67 | 0.30 | ||
| 300 MeV -1 GeV | – | 295 | 625 | 12.28 | 621 | 12.26 | 0.16 | ||
Notes: (a) Band or range of energy. (b) Number of observations. (c) Number of night-average photometric points, or one-week integrations for -rays. (d) Period corresponding to the maximum frequency in LS periodogram. (e) Power of maximum frequency in LS periodogram. (f) LS p-value. (g) Period corresponding to the maximum frequency in DC-DFT technique. (h) Power of maximum frequency in DC-DFT technique. (i) Amplitude. (j) DC-DFT p-value.
3 Fermi data
PKS 2155-304 is a well known -ray emitter ( photon cm and photon index , Nolan et al., 2012). We considered the Fermi333http://fermi.gsfc.nasa.gov/ssc/data/access/lat/msl_lc/ light curves as provided by the automatic standard analysis procedure. Light curves cover the interval 2008/08/06 (54684 MJD) to 2014/06/09 (56817 MJD). We took one week integrations and selected the two energy ranges 100 MeV - 300 GeV and 300 MeV - 1 GeV. The data were searched again with LS and DC-DFT (Table 1 and Figure 1). It is apparent that the periodicity peaks at 630-640 days, which is consistent with twice the optical/NIR period . Note, however, that the folded light curves cover a time interval of only 3 , so this must be considered a tentative result at this time. Moreover the present data do not allow to comment about a possible phase shift of optical and -ray bands
4 Discussion
The simple fact that we recover the T 317 days period of Zhang et al. (2014) on independent data, though with an overlap of the observing time interval, makes their claim of this quasi-periodicity more robust. The discovery of a possible quasi-periodicity at T 2 T1 in -rays, is intriguing, and per se an indirect confirmation of T1. At this stage, because of the limited number of monitored periods, it is impossible to discriminate between a quasi-periodicity and a real period. Note that Fermi satellite follows this source with no interaction with Sun constraints so that the light curve is not annually biased. For the optical-NIR data, T 317 days can be distinguished from 1 yr period, given the length of our data-train and this distinction is even stronger for the data collected by Zhang et al. (2014). In fact in our Fourier spectra (Figure 1, top and central panels on the left) the power associated to a 1 yr periodicity is significantly lower than that at . In principle, it is also possible that T1 is a beat frequency for instance with a 1 yr period. In this case the true period could be 168 days (0.46 yr) or 2246 days ( 6.15 yr). The former period does not appear in our power spectra, while the latter is comparable with the duration of our optical observations. Further information on the quasi-periodicity may come from unpublished archived observations, which we expect to be numerous since the source is a rather common target. Additional Fermi data will show whether our tentative quasi-periodicity in -rays holds up long enough to be fully convincing. Of interest would also be a detailed study of the X-ray light curves beyond that performed by Lachowicz et al. (2009). This will be a delicate business. In fact because of the nature of most X-ray observations, a combination of data from numerous different instruments is required.
One can assume a mass of the black hole in PKS 2155-304 , as proposed by Falomo et al. (1991) and Kotilainen et al. (1998) on the basis of the absolute magnitude of the host galaxy. If () were a real periodicity one could consider a Keplerian frame which yields an orbital radius of cm ( cm), 40 (70) Schwarzschild radii. The tidal effects on a star orbiting the supermassive black hole at such radius would be very relevant, a subject which deserves further investigations.
References
- Aharonian et al. (2007) Aharonian, F., Akhperjanian, A. G., Bazer-Bachi, A. R., et al. 2007, ApJ, 664, L71
- Covino et al. (2004) Covino, S., Stefanon, M., Sciuto, G., et al. 2004, Proc. SPIE, 5492, 1613
- Edelson & Krolik (1988) Edelson, R. A., & Krolik, J. H. 1988, ApJ, 333, 646
- Falomo et al. (1991) Falomo, R., Giraud, E., Melnick, J., et al. 1991, ApJ, 380, L67
- Fan & Lin (2000) Fan, J. H., & Lin, R. G. 2000, A&A, 355, 880
- Ferraz-Mello (1981) Ferraz-Mello, S. 1981, AJ, 86, 619
- Foschini et al. (2008) Foschini, L., Treves, A., Tavecchio, F., et al. 2008, A&A, 484, L35
- Foster (1995) Foster, G. 1995, AJ, 109, 1889
- Hamuy & Maza (1989) Hamuy, M., & Maza, J. 1989, AJ, 97, 720
- Hudec et al. (2013) Hudec, R., Bašta, M., Pihajoki, P., & Valtonen, M. 2013, A&A, 559, A20
- Jurkevich (1971) Jurkevich, I. 1971, Ap&SS, 13, 154
- Kotilainen et al. (1998) Kotilainen, J. K., Falomo, R., & Scarpa, R. 1998, A&A, 336, 479
- Lachowicz et al. (2009) Lachowicz, P., Gupta, A. C., Gaur, H., & Wiita, P. J. 2009, A&A, 506, L17
- Leahy et al. (1983) Leahy, D. A., Darbro, W., Elsner, R. F., et al. 1983, ApJ, 266, 160
- Lehto & Valtonen (1996) Lehto, H. J., & Valtonen, M. J. 1996, ApJ, 460, 207
- Marscher et al. (2008) Marscher, A. P., Jorstad, S. G., D’Arcangelo, F. D., et al. 2008, Nature, 452, 966
- Nolan et al. (2012) Nolan, P. L., Abdo, A. A., Ackermann, M., et al. 2012, ApJS, 199, 31
- Sandrinelli et al. (2014) Sandrinelli, A., Covino, S., & Treves, A. 2014, A&A, 562, A79
- Scargle (1982) Scargle J. D., 1982, ApJ, 263, 835
- Sillanpaa et al. (1988) Sillanpaa, A., Haarala, S., Valtonen, M. J., Sundelius, B., & Byrd, G. G. 1988, ApJ, 325, 628
- Skrutskie et al. (2006) Skrutskie, M. F., Cutri, R. M., Stiening, R., et al. 2006, AJ, 131, 1163
- Ulrich et al. (1997) Ulrich, M.-H., Maraschi, L., & Urry, C. M. 1997, ARA&A, 35, 445
- Urry & Padovani (1991) Urry, C. M., & Padovani, P. 1991, ApJ, 371, 60
- Urry et al. (1993) Urry, C. M., Maraschi, L., Edelson, R., et al. 1993, ApJ, 411, 614
- Zhang et al. (2014) Zhang, B.-K., Zhao, X.-Y., Wang, C.-X., & Dai, B.-Z. 2014, Res. in Astronomy and Astrophysics, in press (arXiv:1405.6858)
- Zerbi et al. (2004) Zerbi, F. M., Chincarini, G., Ghisellini, G., et al. 2004, Proc. SPIE, 5492, 1590