Assessment Model for Opportunistic Routing
Abstract
Due to the increased capabilities of mobile devices and through wireless opportunistic contacts, users can experience new ways to share and retrieve content anywhere and anytime, even in the presence of link intermittency. Due to the significant number of available routing solutions, it is difficult to understand which one has the best performance, since all of them follow a different evaluation method. This paper proposes an assessment model, based on a new taxonomy, which comprises an evaluation guideline with performance metrics and experimental setup to aid designers in evaluating solutions through fair comparisons. Simulation results based on the proposed model revisit the performance results published by Epidemic, PROPHET, and BubbleRap, showing how they perform under the same set of metrics and scenario.
Index Terms:
opportunistic routing; assessment modelI Introduction
The increasing capability of portable devices allow users to quickly form networks by sharing resources (i.e., processing, storage) and connectivity. Such spontaneous networks are possible by taking advantage of opportunistic contacts among nodes that can carry and forward information on behalf of other nodes, allowing information to reach a given destination even in the presence of intermittent connectivity (resulting from node mobility, power-saving schemes, physical obstacles).
Several routing proposals emerged taking advantage of devices capability to overcome intermittency. In such proposals, devices process and store data until another good intermediate node or destination is found, based on the store-carry-and-forward paradigm. Routing proposals range from approaches using node mobility to flood the network for fast delivery, up to approaches able of controlling such flooding based on encounter history, prioritization, and encounter prediction. In recent years, approaches based on social similarity metrics emerged making use of social relationships, interests, and popularity to improve opportunistic routing.
This paper starts by proposing an assessment model, which we call Universal Evaluation Framework (UEF), comprising a set of parameters related to network density and traffic aiming to aid designers to carry out fair comparisons among proposals and effectively assess their performance. It is based on a classification model which identifies common properties (i.e., routing strategy and metrics) among opportunistic routing prior-art, aiming to support an efficient development of new proposals. Then, we compare the performance of Epidemic [1], PROPHET [2], and BubbleRap [3] under the conditions specified in the UEF.
This paper is organized as follows. Section II analyzes work related to existing routing strategy classifications and evaluation models. The new classification and UEF are presented in Sections III and IV, respectively. In Section V, results from a fair assessment between Epidemic, PROPHET, and BubbleRap based on the proposed assessment model are discussed. Finally, Section VI concludes the paper.
II Related Work
Our motivation to propose an assessment model comes from the fact that opportunistic routing proposals do not consider neither a similar set of performance metrics nor comparable experimental scenarios. This results in unfair comparisons between proposals, since evaluation metrics and conditions may vary. In this section, we present different classifications of routing strategies that helped us achieve our goal of proposing a UEF.
II-A Classification of Routing Strategies
Different proposals found in the literature classify routing strategies, but few provide a way to somehow evaluate them.
Jain et al. (2004) [4] classify proposals based on knowledge from network oracles or route computation and determination. A routing evaluation framework is provided considering the different knowledge oracles to evaluate the amount of knowledge each proposal requires in specific application scenarios.
Zhang (2006) [5] provides a classification with two main categories, deterministic and stochastic, which also considers the type of knowledge used for routing. The main goal is to solely categorize routing solutions based on the information used to perform data exchange.
Likewise Jain et al. and Zhang, D’Souza and Jose (2010) [6] classify solutions considering the required knowledge. Proposals are divided into three major categories based on flooding, history, and, special devices. It is important to note that this taxonomy succeeds in including the new social-aware routing trend observed in the last three years.
The most recent classification proposed by Spyropoulos et al. (2010) [7] groups opportunistic routing proposals according to the message exchange scheme they employ: forwarding, replication, and coding. Authors also identify different types of utility functions that can be applied to such schemes. Additionally, Disruption Tolerant Networks (DTN) are classified based on characteristics that have major impact on routing such as connectivity and mobility. Authors succeed in mapping routing solutions to the different DTN types, which allows them to evaluate proposals accordingly.
We observe that the main goal of these classifications is uniquely to identify the different families of routing solutions. Some of them [4, 7] provide evaluation principles that simply aid designers to identify the application requirements in order to propose the “right” algorithm. We, on the other hand, use our classification to identify common aspects among the analysed solutions to propose a fair way to assess routing performance independently of the amount of needed knowledge and application scenario.
II-B Evaluation models
Regarding evaluation models, we highlight a proposal based on Evolving Graph theory to design and evaluate least cost routing protocols. Ferreira et al. (2010) [8] use a formalized metric (i.e., foremost) to determine journeys (i.e., future temporary connections between nodes that may provide a path over time) that quickly reach the destination.
This model provides an algorithm that has good performance when connectivity patterns are known, and is used as a lower bound reference to compare MANET routing solutions. Still, it lacks a guideline of how performance metrics and experimental setups can be used. We, on the other hand, want to identify the different families of routing solutions according to their distinct goals and routing strategies, and to provide a set of experimental setups to aid in a fair performance assessing of opportunistic routing solutions.
III Classification Model
Observing the opportunistic routing approaches present in the literature, it is clear the existence of different trends based on specific goals. Thus, there is the need for a well-balanced and updated taxonomy able to include trends identified over the last years, focusing solely on the branch that best reflects opportunistic contacts (i.e., stochastic [5]). In this section, we briefly describe this new taxonomy and direct the reader to a detailed version in our report [9].
The taxonomy in Fig. 1 considers the analysis of proposals (spanning a ten-year period) and evolved from a previous analysis done in [10]. It starts by identifying three major categories based on forwarding, flooding, and replication.
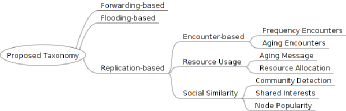
The forwarding-based category, also known as single-copy forwarding, is quite interesting from the resource consumption viewpoint, as proposals are able to spare network and node resources. However, they suffer from high delay rates, which results in low delivery rate. Examples of this category are presented by Spyropoulos et al. (2008) [11].
Albeit being rather aggressive, flooding-based algorithms are capable of achieving high delivery rates, but with a high cost (i.e., resource consumption). The classical example of this category is the Epidemic [1] approach.
In order to reduce resource waste, replication-based proposals aim at increasing delivery rate by adding extra message copies in the network in a controllable manner. Due to the different routing algorithms and metrics, replication-based solutions are further divided based on encounters, resource usage or social similarities.
In the encounter-based category, proposals consider the history of encounters with a specific destination to support opportunistic forwarding of messages. The frequency nodes met in the past, or the time elapsed since the last encounter with the destination is used to decide about next hops. PROPHET [2] falls into this sub-category.
Proposals based on resource usage aim to avoid messages to be kept being forwarded in the network, occupying resources, by creating metrics that define the age of message copies. They also take forwarding decisions that wisely use available resources (e.g., RAPID [12]).
In the social similarity category, proposals follow more complex algorithms aiming at: i) avoiding flooding with high probability; and, ii) exploiting social behavior related to community detection, shared interest, and node popularity. Bubble Rap [3] is a good representative of this category.
IV Universal Evaluation Framework
Our study shows that evaluation methods used so far do not always consider a homogeneous set of parameters or comparable experimental setups, which endangers the veracity and fairness of conclusions. Thus, even with a stable taxonomy, there is the need to devise an evaluation model based on common performance metrics and experimental scenarios, avoiding future assessments considering irrelevant performance metrics and bias scenarios.
To achieve such goal, we looked at seventeen proposals (2000/2010) that best represented the categories in our taxonomy to identify evaluation/comparison patterns. For a more detailed view of our findings, refer to our report [9].
IV-A Performance Metrics
Previously [10], we checked several metrics and observed the lack of a naming convention and the use of the same performance metric with different definitions. This different understanding surely influences performance assessment.
We observe that delivery rate, cost, and delay are the most used metrics. Thus, to establish a naming convention and homogeneous definition, these metrics are defined next.
Delivery rate is defined as the number of messages delivered, per unit of time, out of the total number of messages created. This is an important metric, because it reflects the proposal effectiveness. Proposals able to reach high delivery rates are classified as having good performance. However, there is always a cost associated to the delivery of each message. We define cost as the number of replicas per delivered message. This number of replicas gives an idea of how much resources are consumed. Additionally, message utility is correlated to its TTL, and it is imperative to remove stale data from the network to avoid resource waste. Hence, it is important that messages arrive to their destination within useful time. So, we define delay as the time required to deliver all the bytes encompassing a message.
IV-B Experimental Scenario
Another concern is the experimental setup in which no rules are followed as parameters vary in evaluations found in the literature. We observe that the most common performance assessment parameters considered among the seventeen analyzed proposals were the number of nodes and source-destination pairs, meeting times and time between meetings, area size, message size, network load, message TTL, buffer size, mobility model, node speed, transmission range, and beacon usage.
We could observe that proposals really differ regarding the experimental scenario. Some proposals provide detailed information while others provide it only partially. We were also able to identify two main parameter classes: network density (network area, number of nodes, mobility model, transmission range and beacon control), and traffic (distribution of sources/destinations, load generation, message size, message TTL, and buffer size). Tables I and II show what UEF recommends along with what is used in PROPHET and BubbleRap. We limit our discussion to these proposals since both are benchmarks for comparison studies. The former is under standardization process in the DTN research group and best represents the encounter-based category, and the latter is a good example of a new trend based on social similarity. Thus, we start by giving an overview of what the UEF suggests for each main parameter class and highlight what each proposal considered in their assessment study.
Network density allows an understanding about behavior on sparse (sporadic contacts, observing delivery rate when delay is high) and dense (frequent contacts, assessing the ability to cope with randomness when choosing next hops) scenarios. Such sparseness may be tuned by configuring the number of nodes. In average, the number of nodes in the seventeen analyzed proposals lie between 100-150 (excluding extreme cases as FRESH [13]), which are the values proposed in UEF to define network density.
In addition, mobility models should consider different speed and pause time as nodes represent people and vehicles. These parameters do influence contact and inter-contact times. We observe that some approaches considered these times as exponentially and power law distributions [12, 3], whereas others obtained them from datasets.
We also analyze the transmission range and beacon usage. In what concerns the former, we propose ranges from 10-250 meters, since they should represent the devices capabilities. Yet, beacons should not be used very often, as battery needs to be spared. However, using it rarely may lead to losing good contact opportunities. Thus, beaconing at every 100 ms may provide sufficient network knowledge while saving energy. We point out that the usage of this parameter in the UEF requires further investigation to be validated.
Concerning network density parameters (cf. Table I), PROPHET considers the same number of nodes (50) for different area densities and mobility models. This is a very interesting approach as the proposal is subject to scenarios with sporadic contacts/long delays (Random Waypoint) and frequent contacts/many forwarding opportunities (Community). Another good point is that this proposal is evaluated under a mobility model that attempts to mimic human behavior. It is imperative to consider transmission ranges that actually represent the different devices capabilities, and the authors also evaluated the proposal under different ranges.
![[Uncaptioned image]](/html/1407.8372/assets/x2.png)
Despite considering different area densities and mobility models, the evaluation of PROPHET is done in homogeneous scenarios. This is not realistic as there are nodes moving according to different patterns which suggests that, for a better performance evaluation, the scenario must consider different mobility models simultaneously. Additionally, node speed must also comply with reality and should be specified according to whomever/whatever is carrying the device. The same applies to transmission range that should suitably represent the capabilities of devices: 10-250 meters shall approximate the simulation to the real world as they can represent Bluetooth and 802.11b cards, for instance.
As for BubbleRap, since its evaluation is fully based on human traces, authors succeed in having different area densities (from conference to city-wide areas). Although no mobility model is explicitly used, BubbleRap follows the human behavior found in traces, which also results in appropriate node meeting/inter-meeting times [12, 3]. The transmission range considered was that of Bluetooth, which represents the devices used for collecting the traces.
When compared to PROPHET, BubbleRap stands out in terms of acceptable UEF network density parameters. However, its evaluation is done in a static manner, i.e., communities are formed and betweenness centrality is determined based on collected information. Our interest is to see how the proposal behaves in a dynamic scenario, which shall influence the way centrality and communities are computed.
Regarding traffic, we observe that, at almost every proposal, the number of source-destination pairs was statically defined and randomly assigned. We see no problem in having this number statically defined, but we certainly agree that changing it during the same experiment or in different ones shall impose some challenges. However, this number should be the same and, most importantly, the pairs should remain the same (which cannot be assured with random choice) to guarantee similar conditions for assessment study.
Load generation is a parameter that adds more variations to experiments. We observe proposals generating a message per second [1, 2], a number of messages uniformly distributed [3] as well as providing little to no information on the load used. We believe it must be carefully addressed and homogenized to guarantee fair comparisons.
As applications generate different-sized messages, load must be considered as it reflects network and node resource consumption. It should be tuned to represent the different applications that are expected in a opportunistic scenario (e.g., chat messages, email, file transfer). We observe that only few proposals provide information about this parameter (1 KB [1, 12] or between 10-100 KB [14]).
Traffic levels in the network can be affected by message TTL. If the latter is too high, network and node resource consumption may increase. Otherwise, messages may not even reach destination. Observed TTL was defined as the number of hops [1, 2] or time units, and normally varied between 3-10 hops in average. Hui et al. [3] shows that only 5% of nodes have some level of relationship with the destination in the first hop, thus we suggest starting evaluation with at least 3 hops (as interaction values improve around 35%), and varying it to observe the proposals behavior.
We also observe how a proposal performance can be influenced by buffer size. This parameter reflects how much of the device storage a user is willing to sacrifice on behalf of others. Unlimited buffer is not realistic, whereas providing all space is acceptable in scenarios where nodes are there to serve others [12]. Thus, based on our observations of the seventeen routing proposals, we suggest to limit buffer to 200 messages (10KB each).
From Table II we observe that PROPHET has a different setting for each of the mobility models employed. Message load varies with the mobility model, and authors evaluate the proposal considering different message TTL (TTL may vary according to the message content or application generating it). Normally, buffer space can be a constraint, since nodes may not be willing to share it all. So, considering limited buffer space is closer to the real world scenario, and PROPHET’s authors succeed in that.
![[Uncaptioned image]](/html/1407.8372/assets/x3.png)
Yet, related to these parameters, BubbleRap only provides information on the source/destination distribution and load, where it generates 1000 messages between all node pairs.
This is actually the set of parameters that actually deviates the most in comparison studies. Normally, source/destination pairs are a subset of randomly chosen nodes. This influences the evaluation assessment, as this set will vary as simulations are run. Thus, evaluation studies should consider the same subset of source/destination pairs and the number of generated messages must also remain the same.
In both proposals, authors do not mention anything about the message size. This is an important parameter as real world applications generate messages with different sizes. Despite having the concern of sparing buffer, BubbleRap does not indicate what size was considered for evaluation.
Although not explicitly stated, BubbleRap considers message TTL and suggests that a minimum of no less than 3, since most of the nodes first met (1 and 2 hops) still belong to the community of the message’s carrier. Thus, in order for the message to reach nodes from the same community as the message’s destination, more hops should be considered.
V Fair Evaluation
In this section we present the performance evaluation of Epidemic, PROPHET, and BubbleRap under the same conditions specified in the UEF. It is important to note that our goal is twofold: first, to show the importance of a homogeneous evaluation while assessing routing proposals from categories as different as flooding-based, encounter-based, and based on social similarities; and second, to show how the usage of different parameter setups and performance metrics can result in assessment that is bias to some proposals.
V-A Evaluation settings and methodology
Following the proposed UEF, the considered scenario has 150 nodes distributed in 17 groups (8 of people and 9 of vehicles). One of the vehicle groups, with 10 nodes, follows the Shortest Path Map Based Movement mobility model [15] and represent police motorbike patrols. They move with speed between 7-10 m/s and have a waiting time between 100-300 seconds when arriving at the randomly chosen destination.
The other vehicle groups represent buses routes. Each group is composed of 2 vehicles. They follow the Bus Movement mobility model [15] with speeds between 7-10 m/s and have waiting times between 10-30 seconds.
Regarding people groups, they follow the Working Day Movement mobility model [15] with walking speeds ranging from 0.8-1.4 m/s. People may also use buses to move around. Each of these groups have different meeting spots, as well as offices and home locations. People spend 8 hours at work and present 50% probability of having an evening activity after leaving work. In the office, nodes move around and have a pause time ranging from 1 minute to 4 hours. Evening activities can be done alone or in groups with a maximum of 3 people, and can last between 1 to 2 hours.
Every node is equipped with a wireless interface with transmission speed of 11 Mbps and range of 100 meters.
Traffic load is previously configured with established source/destination pairs, where approximately 500 messages are generated per day among the same subset of node pairs. Message size ranges from 1 to 100 kB and TTL is set at 24 hours. The buffer space is of 2 MB. These values comply with different applications, and the assumption about user’s limited willingness to share storage capacity.
Simulations are run on Opportunistic Network Environment [15] and represent a 12-day interaction between nodes (with 2 days of warmup, which is not considered for the results). Each simulation is run ten times (with different random number generator seeds for the used movement models) in order to provide a 95% confidence interval for the results. All the results are evaluated considering the average delivery probability, cost, and delay.
V-B Results
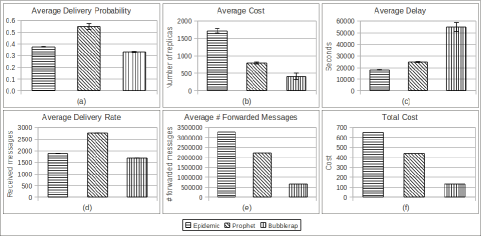
Fig. 2 shows the performance metrics considered in the UEF (a, b, and c), as well as the ones used in the evaluation of PROPHET (c, d, and e) and BubbleRap (a and f).
When comparing Epidemic and PROPHET under the UEF scenario, it is still observed the same behavior reported by Lindgren et al. (2003) [2]: PROPHET has better performance by delivering over 860 more messages (Fig. 2d) with 32% less forwardings (Fig. 2e) than Epidemic. However, PROPHET average delay (Fig. 2c) is much higher (6661.3s) than the one of Epidemic, presenting a different behavior than the one reported by Lindgren et al., where PROPHET is able to deliver messages in less time.
Generally speaking, the performance of PROPHET in the UEF scenario presents higher average delivery rate, forwarded messages, and average delay than the one reported in the original paper. It needed (roughly and based on the results presented in its original paper) far more forwardings (over 340 times) to deliver almost 2.6 more messages with a delay close to 10 times more. Regarding the UEF performance metrics, we still believe that the overhead (i.e., average cost) is quite too exhaustive for a small increase in delivery probability. The increase in cost (Fig. 2b) is explained by the message TTL (set at 24 hours), which allows messages to propagate (i.e., replicate) more in the system. This consequently contributes to the increase in the average delay (Fig. 2c) as messages are held for a wiser decision. In addition, it is expected that the number of delivered messages also increase due to messages being further replicated in the system.
The results of PROPHET with the UEF show an example of a proposal that was shown to have suitable performance in the original paper, but end up with not so interesting results (e.g., more overhead) in more heterogeneous scenarios.
Now, moving on to the performance comparison between PROPHET and BubbleRap under the UEF scenario. Here we consider the delivery success ratio (a.k.a., average delivery probability) and total cost as presented by Hui et al. (2008) [3]. We observe the same performance behavior, but like it happened between Epidemic and PROPHET, the difference in the gains are much more evident.
Regarding the delivery success ratio (Fig. 2a), the difference is over 17 percentage points between these proposals for a 24-hour TTL (i.e., 1 day), whereas such difference is reported to be very subtle in BubbleRap original paper. As for the total cost, the gap is even bigger, going from ~40% in the original paper to ~70% with UEF. Thus, in terms of cost, BubbleRap has a very interesting behavior, but with a lower delivery ratio than reported in the original paper.
It is also observed that while the delivery success ratio of both solutions lay around 15% for a 24-hour TTL in the original paper, with UEF this success ratio goes up to 55% and 33% for PROPHET and BubbleRap, respectively. These results really show the burden (i.e., time spent) of solutions based on community formation and this is the main reason for the poor performance of BubbleRap with UEF. Although the protocol is given two days (i.e., warmup period) so it learns about possible communities, it is still not enough for the protocol to wisely determine the existing communities.
These results show how important it is to consider a dynamic scenario. The performance of BubbleRap is assessed over static scenarios (based on human traces), i.e., first communities are formed and centralities determined, then the proposal uses such information to deliver messages. Despite considering traces of human interaction, the proposal is not able to adapt when nodes interact to represent the inherent dynamism. Consequently, its performance is degraded.
In what concerns the UEF performance metrics, we observe that the difference in terms of cost (Fig. 2b) between Epidemic, PROPHET, and BubbleRap is small. This is because UEF considers the number of replicas proposals require to perform a successful delivery. We believe this is a reasonable approach since nodes may be quite resource constrained, so replication decisions must be wisely taken.
VI Conclusions
The increased capability of devices allows users to experience new ways to exchange content through opportunistic contacts. However, this new form of communication must deal with link intermittency, which has given rise to different solutions that attempt to lessen such issue. Nevertheless, it is difficult to understand which one has the best performance as every one of them has a different evaluation method.
Analyzing the last ten years, we observed different trends based on specific goals and with different opportunistic routing solutions. Thus, we analyzed different proposals according to the identified trends, collected information on their evaluation process, and found common properties (i.e., routing strategy and metrics). The result was a UEF which provides guidelines, based on a taxonomy including the new trend identified recently (i.e., social similarity), comprising a set of performance parameters and experimental setup to aid designers fairly assessing the performance of opportunistic routing solutions. To validate our principles, we simulate Epidemic, PROPHET, and BubbleRap under the same UEF conditions, and we are able to see that differences among the proposals are more evident with UEF.
We believe that we have reached our goal of providing a way for designers to classify their new solutions as well as fairly assessing them. As new proposals emerge, we will keep our taxonomy up-to-date with the latest trends identified in the field of opportunistic networks.
Acknowledgment
Thanks are due to FCT for financial support via PhD grant (SFRH/BD/62761/2009) to Waldir Moreira and UCR project (PTDC/EEA-TEL/103637/2008).
References
- [1] A. Vahdat and D. Becker, “Epidemic routing for partially connected ad hoc networks,” Tech. Rep. CS-200006, Duke University, April 2000.
- [2] A. Lindgren, A. Doria, and O. Schelén, “Probabilistic routing in intermittently connected networks,” SIGMOBILE Mob. Comput. Commun. Rev., vol. 7, no. 3, pp. 19–20, July 2003.
- [3] P. Hui, J. Crowcroft, and E. Yoneki, “Bubble rap: social-based forwarding in delay tolerant networks,” in Proc. of ACM MobiHoc, Hong Kong, China, May 2008.
- [4] S. Jain, K. Fall, and R. Patra, “Routing in a delay tolerant network,” in Proc. of ACM SIGCOMM, Portland, USA, August 2004.
- [5] Z. Zhang, “Routing in intermittently connected mobile ad hoc networks and delay tolerant networks: Overview and challenges,” IEEE Communications Surveys and Tutorials, vol. 8, no. 1-4, pp. 24–37, January 2006.
- [6] R. J. D’Souza and J. Jose, “Routing approaches in delay tolerant networks: A survey,” International Journal of Computer Applications, vol. 1, pp. 8–14, February 2010.
- [7] T. Spyropoulos, R. N. Rais, T. Turletti, K. Obraczka, and A. Vasilakos, “Routing for disruption tolerant networks: taxonomy and design,” Wirel. Netw., vol. 16, pp. 2349–2370, November 2010.
- [8] A. Ferreira, A. Goldman, and J. Monteiro, “Performance evaluation of routing protocols for manets with known connectivity patterns using evolving graphs,” Wirel. Netw., vol. 16, pp. 627–640, April 2010.
- [9] W. Moreira and P. Mendes, “Survey on opportunistic routing for delay tolerant networks,” Tech. Rep. SITI-TR-11-02, SITI, University Lusofona, February 2011.
- [10] W. Moreira and P. Mendes, “Routing metrics for delay tolerant networks,” in Proc. of CRC, pp. 217–219, Braga, Portugal, November 2010.
- [11] T. Spyropoulos, K. Psounis, and C. S. Raghavendra, “Efficient routing in intermittently connected mobile networks: the single-copy case,” IEEE/ACM Trans. Netw., vol. 16, no. 1, pp. 63–76, February 2008.
- [12] A. Balasubramanian, B. Levine, and A. Venkataramani, “Dtn routing as a resource allocation problem,” in Proc. of SIGCOMM, Kyoto, Japan, August 2007.
- [13] H. Dubois-Ferriere, M. Grossglauser, and M. Vetterli, “Age matters: efficient route discovery in mobile ad hoc networks using encounter ages,” in Proc. of ACM MobiHoc, Annapolis, USA, June 2003.
- [14] S. Nelson, M. Bakht, and R. Kravets, “Encounter-based routing in DTNs,” in Proc. of INFOCOM, Rio de Janeiro, Brazil, April 2009.
- [15] A. Keränen, J. Ott, and T. Kärkkäinen, “The one simulator for dtn protocol evaluation,” in Proc. of SIMULTools, Rome, Italy, March 2009.