A study of dynamical processes in the Orion KL region using ALMA– Probing molecular outflow and inflow
Abstract
This work reports a high spatial resolution observations toward Orion KL region with high critical density lines of CH3CN (124-114) and CH3OH (8-1,8-70,7) as well as continuum at 1.3 mm band. The observations were made using the Atacama Large Millimeter/Submillimeter Array with a spatial resolution of 1.5′′ and sensitives about 0.07 K and 0.18 K for continuum and line, respectively. The observational results showed that the gas in the Orion KL region consists of jet-propelled cores at the ridge and dense cores at east and south of the region, shaped like a wedge ring. The outflow has multiple lobes, which may originate from an explosive ejection and is not driven by young stellar objects. Four infrared bubbles were found in the Spitzer/IRAC emissions. These bubbles, the distributions of the previously found H2 jets, the young stellar objects and molecular gas suggested that BN is the explosive center. The burst time was estimated to be 1300 years. In the mean time, signatures of gravitational collapse toward Source I and hot core were detected with material infall velocities of 1.5 km s-1 and 0.6 km s-1, corresponding to mass accretion rates of 1.210-3M☉/Yr and 8.010-5M☉/Yr, respectively. These observations may support that high-mass stars form via accretion model, like their low-mass counterparts.
1 Introduction
The dynamical processes in massive star formation region are still not well understood. Molecular outflow and inflow are critical for testing if high mass stars form in the same way as their low mass counterparts. The Orion BN/KL is a massive star formation region closest to us. The Orion KL region consists of different spatial components including the ”ridge” and ”hot core”. The velocity ranges of these components are from 2.5 to 9 km s-1 (Wright, Planmbeck & Wilner, 1996, and the references therein). Every component harbors high-mass young stellar objects (YSOs) identified with near and middle infrared emissions. And many of the YSOs have subcomponents revealed by high spatial resolution observations (Shuping, Morris, & Bally, 2004, and the references therein).
The first high velocity molecular outflow was identified and discovered by use of CO J=1-0 line in Orion KL region (Kwan & Scoville, 1976). The outflow attracted extraordinary attention and was further imaged by dense molecular tracers such as HCO+ J=1-0 and SO (32-21) (Schulz et al., 1995; Friberg, 1984, and the references therein). Besides the high velocity phenomena detected in mm line emissions, finger-like H2 filaments were discovered in BN/KL region by near infrared observations also (Taylor et al., 1984). Line emissions of atoms, ions and high energy level CO were detected in the outflow region too, indicating the presence of shocked and hot gas in the outflow (Doi, O’Dell, & Hartigan, 2002; Gry et al., 1999; Beuther et al., 2010). Different masers including H2O, OH, SiO and CH3OH were identified or imaged in the Orion KL outflow region, and the masers may be excited by shocks (Matthews et al., 2010; Hirota, Kim & Honma, 2012, and the references therein). The properties of the molecular outflow are still under investigation. Recently, Zapata et al. (2012) observed an outflow in the Orion KL region using SiO (J=8-7, v=0) line with the Atacama Large Millimeter/Submillimeter Array (ALMA). The high velocity gas lobes are shaped like a butterfly. The driving source of the outflow in the KL region remains uncertain. It may be produced by the disruption of massive stellar system occurred 500 years ago, which ejected massive stellar objects BN, I and n (Zapata et al., 2009; Bally et al., 2011). While Beuther & Nissen (2008) suggested that the submm core SMA1 may host the driving source of the outflow. The Source I was identified as the driving source of the SiO (J=8-7, v=0) outflow (Zapata et al., 2012). The origin of the outflow needs to be further tested and explored.
Material infall toward cores or forming stars is another kind of essential motion in star formation regions. Although the infall studies progress more slowly than those of molecular outflows, gravitational collapse candidates were frequently found toward massive star formation regions with blue profile (Wu & Evans, 2003; Wu et al., 2007; Chen et al., 2010, and the references therein). Stronger collapse signature, inverse P Cygni profile was detected early with high resolution observations (Welch et al., 1987; Zhang & Ho, 1997; Qin et al., 2008; Liu, Wu, & Zhang, 2013, and the references therein). The dynamical collapse or inflow motion in this active star formation region were not reported before.
To examine the dynamical processes and especially to uncover the origin of the outflow in this region, observations with tracers of high excitation temperature and critical density are needed. This paper presents the results of an observational study of Orion KL at the 1.3 mm with the ALMA. Using continuum emission and spectral lines of CH3CN (124-114) and CH3OH (8-1,8-70,7) in both emission and absorption, an outflow with multiple lobes in the KL region was detected. Inflow motion was identified toward Source I and the hot core.
2 Observations
The data used in this paper was obtained from ALMA science verification (SV) at band 6. The observations were made with 1612 m antennas of ALMA on January 20, 2012, with baselines ranging from 18 to 253 k. The phase center was at R.A. = and Dec. = -. There are 20 spectral windows (SPW) of 1.875 GHz wide. Each spectral window consists of 3840 channels with a spectral resolution of 0.488 MHz ( 0.7 km s-1). Callisto was used for bandpass calibration and flux calibration while quasar J0607-085 provided the phase calibration. The primary beam size of FWHM is about 30 and the emission of the KL region falls well inside of the FWHM.
The synthesized images with the calibrated data were carried out by use of the Common Astronomy Software Applications (CASA) package and MIRIAD (Sault et al., 1995). The continuum map was constructed from the line-free channels of the five spectral windows at highest frequency bands. The natural-weighted beam size and the rms noise level for the continuum are 1 with P.A.=-20.7 and 8 mJy beam-1 (0.07 K), respectively. The CH3CN (124-114) and CH3OH (8-1,8-70,7) lines were extracted from spectral windows ”spw1” and ”spw19”, respectively, while the 13CH3CN (123-113) and (133-123) transitions were identified in spectral windows ”spw5” and ”spw6”, respectively. bThe typical channel rms for lines is about 20 mJy beam-1 per channel (0.18 K).
3 Results
3.1 Continuum
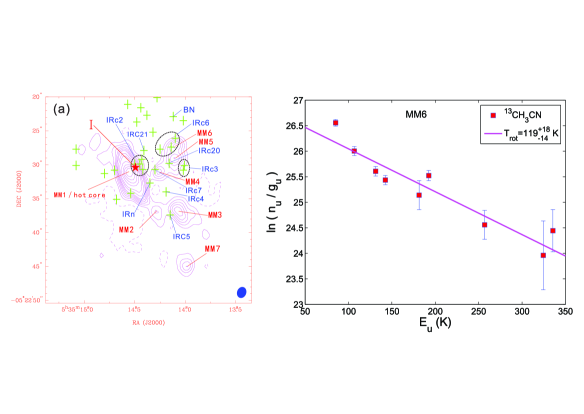
The continuum image of the 1.3 mm emission is presented in Figure 1a. Seven millimeter cores are identified and denoted with MM followed by a number. MM1 is the strongest and largest one, which corresponds to the hot core (Wilson et al., 2000). The others are located in the compact ridge. MM7 is far away from the phase center and is excluded from the further analysis. The known infrared sources were plotted on the map and shown by crosses (Shuping, Morris, & Bally, 2004). Two dimensional gaussian fits were made toward the continuum cores. The peak position is listed in column 2 of Table 1. Column 3 is the core size, here 414 pc was adopted as the distance (Menten et al., 2007). The peak emission intensity and the total flux of the cores are given in Columns 4 and 5 of Table 1.
13CH3CN (123-113) and (133-123) transitions were extracted from each of the cores. The systematic velocities (Vlsr), and the mean line widths ( V) of the 13CH3CN lines by Gaussian fitting are given in columns 6 and 7 of Table 1. We also calculated the rotational temperatures of the cores with the rotational temperature diagram (RTD) method (Araya et al., 2005; Goldsmith & Langer, 1999; Liu et al., 2002; Qin et al., 2010) . Only the lines not blended and with high S/N levels () are used for RTD analysis. Assuming that the local thermodynamic equilibrium (LTE) holds and the lines are optical thin, Trot values are obtained, which are listed in the eighth column of Table 1. Figure 1b shows the rotational temperature diagram of MM6 as an example. bWe estimated the virial mass of the MM cores with the relation (MacLaren, Richardson & Wolfendale, 1988): which is given in the last column of Table 1.
3.2 Line profiles and spatial distribution of gas emissions
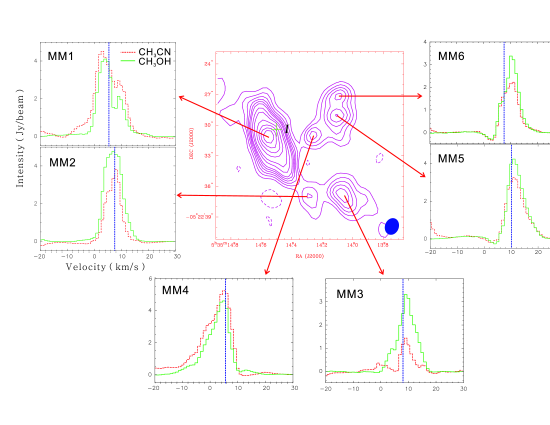
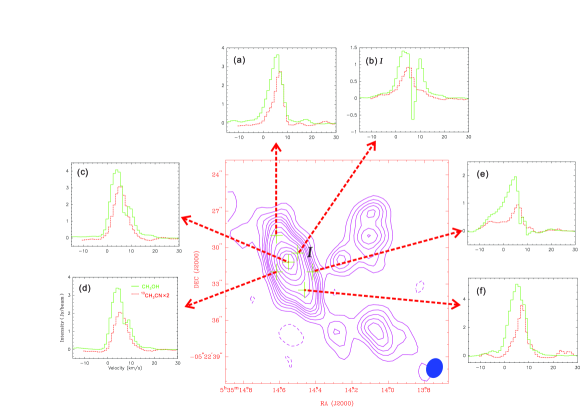
Figure 2 shows the spectral lines of CH3CN (124-114) and CH3OH (8-1,8-70,7) from the peak position of each dust core observed with ALMA. There are two kinds of line profiles from these cores. One has the emission distributed in both sides of the systemic velocity, e.g., the lines at MM1 and MM2 positions. Both CH3CN and CH3OH lines at MM1 have double peaks with the blue one stronger than the red one, and the absorption dip is red shifted with respect to the systemic velocity. These absorption dips are unlikely to be caused by missing flux since the emission of the KL region falls well inside the primary beam, especially the CH3CN (124-114) and CH3OH (8-1,8-70,7) lines that we used have high excitation densities. Additionally both lines from the core MM2 are symmetric, indicating that the instrument effect cannot account for the absorption, which can be interpreted as gas inflow motion toward the core (See more in Sect. 3.4).
The other kind of line profiles show that most of gas emission is located in one side of the systemic velocity. The spectral line at MM4 has stronger emission on the blue side, and on the red side the intensity decreases sharply from the peak. In contrast to the MM4, the spectral emission of MM3, MM5 and MM6 are mainly on the red side. These profiles show characteristics of high velocity gas moving toward us or away from us, which are similar to the fast moving molecular bullets near YSOs as shown in Figure 7 and Figure 9 of Bachiller et al. (1990), but there are apparent differences. The high velocity gas observed here are not molecular bullets ejected from the immediate vicinity of the YSOs, but are jet propelled cores (hereafter JPCs). Firstly, the JPCs in Orion KL show strong dust emission with total flux ranging from 0.43 to 1.27 Jy, which are very rare among the bullets in bipolar molecular outflows or HH objects. Their virialization masses range between those of the hot core and core MM2. While the total masses of bullets near low-and high-mass YSOs are 0.07 M⊙ in L1448 (Bachiller et al., 1990; Richer, Hills, & Padman, 1992; Hatchell, Fuller, & Ladd, 1999). Secondly, the molecular bullets near YSOs are always highly collimated, and the blue and red bullets in high or low mass star formation regions are located along an outflow axis (Richer, Hills, & Padman, 1992; Hatchell, Fuller, & Ladd, 1999). In the Orion KL region, the JPCs have no such bipolar structure, but appear to distribute within the inner edge of the gas region. Thirdly, the JPCs are hot with Trot of 100 to 182 K. Usually line profiles of bullets in bipolar molecular outflows have been observed in low transition lines of CO J=1-0, 2-1 (Bachiller et al., 1990; Hatchell, Fuller, & Ladd, 1999). But for the JPCs in Orion KL, no such profile was found in lines of CO J=1-0, 3-2, HCO+ J=1-0 and SO (32-21) (Erickson et al., 1982; Olofsson et al., 1982; Friberg, 1984). In addition, the spectral profiles of the JPCs are different from those of molecular bullets in bipolar outflows near YSOs. The former have single component while the later are usually accompanied by a line from the host molecular core (Bachiller et al., 1990; Richer, Hills, & Padman, 1992; Hatchell, Fuller, & Ladd, 1999), indicating that the JPCs in the Orion KL region were not ejected by a YSO. Their systemic velocity is not separated from the high velocity emission, meaning that the original gas in the KL region was impacted and propelled by the explosive jets (Taylor et al., 1984; Bally et al., 2011; Zapata et al., 2011). These cores are not explosive jets but jet-propelled cores.
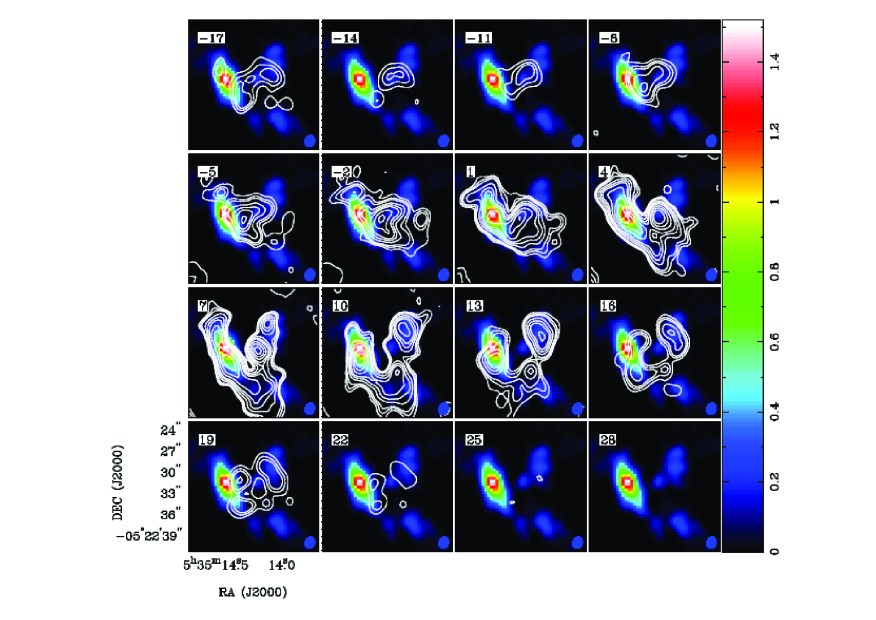
The spectral features can also be seen from channel maps of CH3CN (124-114) line illuminated in Figure 3, where the white contours denote the emission intensity averaging over 3 km s-1 velocity range. The gas emission at velocity (-13) km s-1 is contaminated by CH3CH2CN (252,24-242,23) line. The major bulk of the gas distribute within velocity range of -5 to 16 km s-1. A comparison with Figure 1(a) shows that as the velocity increases, the emission first arises from the west of MM1, and then from MM4 and south-east of MM5. From 1 to 16 km s-1, the morphology of the emission region looks like a semi-wedge ring. A complete wedge ring appears with velocity ranging from 6 to 11 km s-1, which is similar to an angle open to the north. These results show that the molecular gas emissions of the KL region are physically related to different velocity components including molecular JPCs and cores.
In the blue-shifted high velocity range of -14 to -2 km s-1, gas emission arises from MM4, the south-east of MM5 and the west of MM1, then extends to north-east and south. The red-shifted high velocity gas emissions arise from MM6-MM5, the south-west of MM1 and near MM2/MM3 with velocity range of 19 to 22 km s-1. The components of the high velocity gas also consist of emissions of JPCs and cores.
3.3 High velocity gas – an outflow with multiple lobes
From Figure 2, the blue and red-shifted high velocity gas range from -13 to -3 km s-1 and 15 to 24 km s-1, respectively. The contours of the velocity integration intensities of the high velocity gas measured with the CH3CN (124-114) line are presented in Figure 4, in which the crosses represent the infrared sources.
The CH3CN (124-114) outflow has two blue lobes and five red lobes. The blue shifted high velocity gas peaks near MM4 and the west of MM1. The red shifted high velocity gas reaches the maximum near MM5. The spectra of MM1 and Source I have core emission profile with blue and red high velocity wings, but the lines of the JPCs have much more obvious blue or red shifted emissions (Figure 2 and Figure 5, see also next section). The distribution of the high velocity gas suggests that the outflow mainly overlaps or connects with JPCs. The dissimilarities between the spectra of the cores and the JPCs also demonstrate that the molecular outflow is not from MM1 or Source I.
The red outflow has 5 lobes and looks like a projection of a bracelet, while the blue outflow has two lobes. The outflow covers JPCs MM4-MM6. The south-west part of MM1 overlaps with the outflow, and Source I is located outside of the outflow. Both MM1 and Source I can not be the origin or the driving source of the outflow. The other YSOs in this region are located in different lobes and can not serve as the driving source of the outflow too (see Figure 4). These results demonstrate that the high velocity gas in the KL region is not caused by a usual bipolar molecular outflow derived by a YSO, but is mainly from distinct molecular cores propelled by bullets from a burst. That is why blue and red lobes cannot be separated, and the bipolar outflow detected in the KL region with CO at the early period has poor collimation (Kwan & Scoville, 1976; Wu et al., 2004).
3.4 Gravitational collapse toward Source I and inflow motion to the MM1
To examine the line emissions of MM1 (the hot core) and Source I, we plot the CH3OH (8-1,8-70,7) and 13CH3CN (133-123 lines at the boundaries of MM1 and source I in Figure 5. The CH3OH spectral profile from Source I shows blue-shifted emission and red-shifted absorption with respect to the systematic velocity of 5.5 km s-1. It presents an inverse P Cygni profile, indicating that both the gases behind and in front of the continuum source are moving toward the continuum source.
The spectrum of CH3OH at MM1 has gas self absorption dip which is red-shifted relative to the systematic velocity. The blue peak of CH3OH line is stronger than the red one with a ratio of TB/TR=2.16. For the line profile, the asymmetry parameter () defined by Mardones et al. (1997) was calculated, giving -0.25 for the blue profile, where Vthick is the peak velocity of the optical thick line, Vthin and are the systemic velocity and the line width of the optically thin line, respectively. For the line pairs of the center of MM1, =-0.26 was obtained. The two parameters of TB/TR and both satisfy the criteria of the blue profile.
The optical thick and thin spectral lines from position (d), east of MM1 have similar intensity and velocity partner to those from the center of MM1. The ratio of TB/TR=2.13 and the V=-0.25 satisfy the criteria of a blue profile. The signature is slightly weaker than that of the center one, suggesting that inflow motion in MM1 is moving toward the core center.
The line of the position (e), from MM1, has a profile that belongs to those of JPCs and has blue-shifted high velocity gas. This suggests that the west side of the core MM1 was impacted by the explosive jets. The profiles of the lines from north and south of MM1 seem to be affected by the explosive outflow but not as significant as the one at position (e).
4 Discussion
4.1 The JPCs
As stated before, the molecular gas of the KL region actually consists of different velocity components. Beside the cores, there are JPCs mainly distributed in the compact ridge. There are two kinds of line profiles produced from JPCs. One has blue wings and the other has red wings. The high velocity wings in the two kinds spectra are from -13 to -3 km s-1 and 15 to 24 km s-1 respectively, which are similar to those from SiO (8-7, v=0) (Zapata et al., 2012). Such high velocities may be excited by C-type shock since they are below the critical velocities of J-type shocks, which range from 25 to 45 km s-1. J-type shocks are also with emissions primarily in the UV and optical, while C-type shocks mainly excite the vibrational and high rotational levels of molecules in infrared and radio emissions (Wang & Scoville, 1992). Unlike the spectra of molecular bullets near YSOs, the emissions of ambient and high velocity gas of JPCs are not separated. From Table 1 and Figure 5, one can see that the Vlsr of the JPCs are different. The spectra of JPCs with blue wings have smaller Vlsr while those with red wings have larger Vlsr. If we take the average value of the peak velocities of all the JPCs and cores in the KL region, 7.7 km s-1 as the systemic velocity of the KL region gas, then the shifts of the peak velocities of the JPCs range from -2.4 to 2.3 km s-1. The JPCs are moving away or towards us at slow speed. The slow systemic motions of the JPCs may be caused by a rocket effect when the JPCs were propelled by the jets.
4.2 Explosive molecular outflow
4.2.1 High velocity molecular outflow driven by explosive jets
The high velocity molecular outflow has multiple lobes (see Figure 4). The outflow gas mainly distributes in the ridge and only a small part overlaps with the south-east of MM1 and the north of MM2, indicating that the high velocity gas comes mainly from the JPCs. From Figure 2 and Figure 5 one can see that the blue shifted JPCs are located east of the ridge and the red ones distribute more widely. Unlike bipolar molecular outflows in which usually a YSO driving the high velocity gas emission, every blue or red lobe in the KL region harbors YSOs. Source I and IRn are located far from the outflow center. These results suggest that the outflow is unlikely to be driven by some young stellar objects in the outflow region.
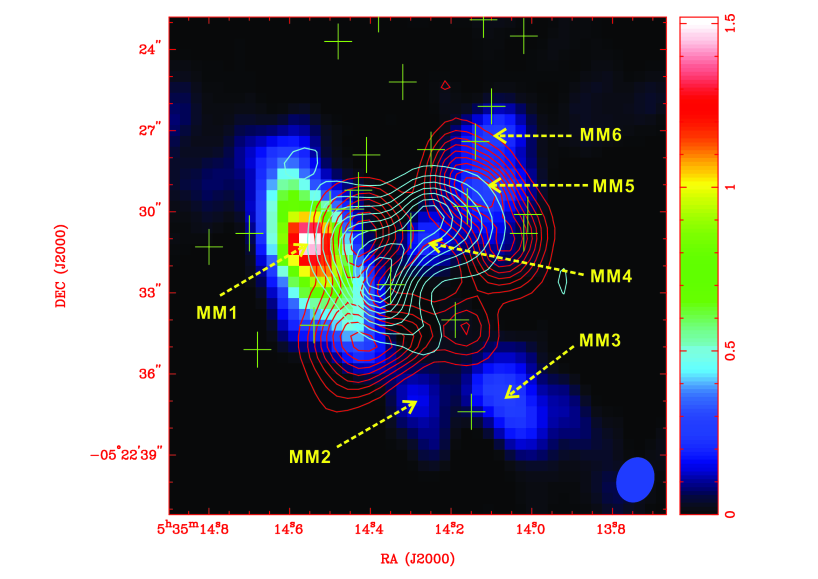
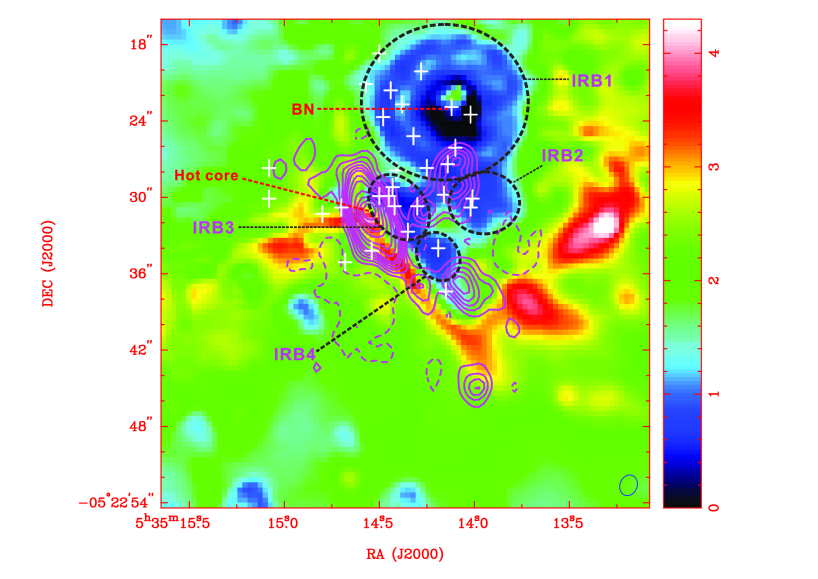
To examine the origin of the high velocity gas and shock effects on the JPCs, we investigated the distribution of the IRAC [4.5/3.6] flux ratio in the Orion KL region. The 4.5 band emissions detected with IRAC of Spitzer contain lines excited by shocks (Cyganowski et al., 2009). A ratio 1.5 represents shocks or jets (Takami et al., 2010). The ratio map with color scale overlaid with the continuum map is displayed in Figure 6. Four infrared bubbles (IRBs) were identified, and the largest and brightest one IRB1 is centered at BN and the emissions are saturated at the inner region. IRB2 is the second largest and is connected with IRB1 and IRB3. IRB4 is located south of the region. Among the ALMA detected dust cores, MM6 and MM5 are located at the outer part of IRB1 and IRB2 respectively. MM4 is located at the outer part of IRB 3. The north-east of MM3 is connected with IRB4. These bubbles have the flux ratio between 1.0 and 1.4, and seem to be swept out by wind and jets. The JPCs are located outside the bubbles or partially overlap with bubbles. It is notable that the strongest and largest shocked area in the KL region is a large wedge ring, and surrounds the KL gas wedge. This ring is well associated with the H2 2.12 and 2.15 clumps (Stolovy et al., 1998), suggesting shocked effects in this region.
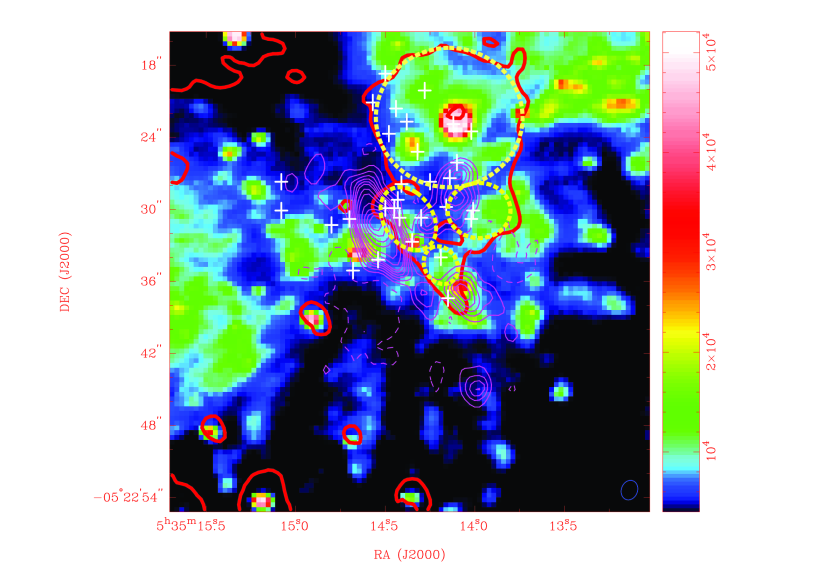
To further probe the excitation mechanism of the molecular outflow, we also plot the JPCs and cores of the KL region overlaid with the 2.12 H2 jets (Bally et al., 2011, and the references there in) in Figure 7. Clearly the JPCs do not overlap with the finger-like jets. The western side of the core MM1 where the shocked gas (Figure 5) was detected partially overlaps with a finger-like jet. These results indicate that the jets break into the region and the cores are propelled or impacted. The gas is accelerated and entrained, resulting in the multi-lobe molecular outflow.
We identified the BN object as the explosive center in the next section. Here we estimate the dynamical age of the expanding bubble. Using the distance from BN to the project center of the high velocity gas as the average length of the jets (8′′.9) and using the average velocity of the outflow, the dynamic time is estimated to be 1280 years, which is consistent with the numerical experiments of gradational slingshot (Chatterjee & Tan, 2012).
4.2.2 The explosive center
One astonishing characteristic seen from Figure 6 and Figure 7 is the distribution of YSOs. Almost all the YSOs in the ridge and BN region are located at the edges or outside of the jets, while all the YSOs are located within the bubbles or on the rings. BN is located at the center of the largest bubble IRB1. IRc15, IRc16W, IRc16S, IRc16N, IRc17, IRc6E, IRc6 and IRc6S are located in IRB1 (also see Shuping, Morris, & Bally, 2004, Fig.1). IRc3N and IRc3S are embedded in the second largest bubble IRB2. IRc2, IRc7 and IRcn are located in IRB3. IRc4 is located in IRB4. Recent evidence of triggered star formation were found in a number of bubbles (Watson et al., 2008; Deharveng et al., 2003). The ionizing stars responsible for the bubbles are located in the wind-evacuated cavity. A neutral material layer forms between the ionization front and the shock front when the HII region expands. This layer may collapse, fragment, and then form stars (Elmegreen & Lada, 1977; Churchwell et al., 2007; Watson et al., 2008; Deharveng et al., 2003). The shocked layers can be produced by various mechanisms including colliding clouds, expanding HII regions, stellar wind bubbles and supernova remnants. For Orion BN/KL region, there are explosive jets while around the BN has a hypercompact HII region (Plambeck et al., 2013). The facts about the gas distribution, and the position of BN in the bubble suggest that BN is very likely the explosive or expanding center.
BN is the hottest and evolved one among the stellar sources in the region. It is a B type star with emission variation (Becklin & Neugebauer, 1967). At the wavelengths 12.5 m and shorter infrared wavelengths, BN is the dominating object (Shuping, Morris, & Bally, 2004, and the references therein).
Besides the BN, there are many YSOs in the hot core and the ridge. Theses YSOs were identified from near or middle infrared observations around BN at different times and with different sensitivities. Their numbering generally has no order. Although the first 5 YSOs discovered were numbered with IR1-IR5 located south-east of BN (IR1) (Rieke, low, & Kleinmann, 1973), the sources found later can not be numbered following this way. For example, IR6 and IR7 were detected, and surrounded by the BN, IR2 and IR3 (Downes et al., 1981). Because of the large extinction at near and middle infrared wavelengths, their positions may be not so accurate. However, the following analysis showed that the evolutionary states of these YSOs are correlated with their distance from the BN object.
The YSOs of IRc6, IRc3 and IRc 20 are closest to BN, and are likely more evolved than those in other places of the region. Their mid-infrared emission are rather weak (Shuping, Morris, & Bally, 2004) and strong emissions at longer wavelengths were not seen. At the northwest fringe of the wedge ring, there is no cold gas emission detected with the inversion lines of 15NH3 (3,3) (Wilson et al., 2000), meaning that IRc6 is really hot.
The objects IRc2, IRn and IRc7 are located farther away from BN and younger than those of IRc6, IRc3 and IRc20. IRc2 A+B, IRc7 and IRcn have much stronger mid-infrared emissions than those of IRc6, IRc3 and IRc20 in the IRB2. VLA observations showed that a shell of water masers was located at IRc2 A, the connected region of the infrared cluster IRc2 and MM1 (Plambeck & Wright, 1988).
IRc4 is the farthest one from BN among the YSOs in the ridge. Infrared spectroscopic observations show that IRc4 is separated from IRc2 (Aitken et al., 1981). It has little emission at middle infrared but has strong emission at 20 m wavelength (Shuping, Morris, & Bally, 2004, and the references therein). More recently, SOFIA observations show that IRC4 has the strongest emission at 37.1 (De Buizer et al., 2012), suggesting it is the youngest one among the YSOs in this region.
The physical state of the gas in Orion-KL region show that BN is the power source. Figure 3 shows that the cavity of the hot gas wedge ring detected with CH3CN (124-114) is open toward BN object, sighting the powered direction. From Figure 6 one can see that the largest shock ring clearly opens to the BN object. MM6, MM5 and MM3 are located along the symmetric axis of the wedge. Such structure can be seen in images of other wavelengths. Infrared continuum measurements at 2-30 m with resolution 2—2.2 show that the KL region is like a clumpy cavity with a diameter about 10 (WynnWilliams et al., 1984). It is also shaped like a wedge ring. The most of north infrared emission is located in its west fringe and covers IRc6. However in this region there is no emission of the rather cold gas detected with the inversion line of 15NH3 (3,3), meaning the gas closest to the BN is hot.
The evolutionary states of the YSOs in the ridge correlate with their distances from the BN object, that also support that the BN is the powering source of the KL region.
For the explosive center of the Orion BN/KL region, various mechanisms were suggested (see Sect. 1). In this work we report some observational characteristics for BN as the explosive center. More theoretical analysis and observation are needed to confirm our identification.
4.3 Dynamics of Source I and the hot core MM1
The inverse P Cygni profile of line (b) shown in Figure 5 indicates gravitational collapse toward Source I. The material infall velocity can be estimated as 1.5 km s-1 from the Vsys and Vobs of the absorption peak (Welch et al., 1987). Here we take the Vsys of Source I as same as that of the core MM1. Assuming the inflow is free fall (Pineda et al., 2014), the mass accretion rate of 1.210-3M☉/Yr can be obtained with dM/dt=3V/2G, which is much lager than those of low mass cores (Myers et al., 1996). The result is consistent with the mass of Source I, which is about 10 M☉ (Testi, Tan, & Palla, 2010; Liu, Wu, & Zhang, 2013).
For the core MM1, the lines at the center and position (d) have blue profiles showing inflow motion. The infall velocity is calculated with the model of Myers et al. (1996):
| (1) |
where is the brightness temperature of the dip (assumed it is optically thick), and are the height of the blue and red peaks above the dip, respectively. The velocity dispersion km s-1 is obtained from the optically thin 13CH3CN(133-123) line. Thus the infall velocities inferred from CH3CN (124-114) and CH3OH (8-1,8-70,7) lines are 0.4 and 0.8 km s-1, respectively. Taking the average value 0.6 km s-1 as Vin, the mass accretion rate of 8.010-5M☉/Yr was obtained. Both the infall velocity and the mass accretion rate are smaller than those of Source I but still larger than those of low mass cores (Myers et al., 1996).
Signatures of gravitational collapse or inflow motion were detected in Orion KL region for the first time (See Sect.1). For Source I, the material infall velocity and mass accretion rate are computable with those of high mass sources (see Liu, Wu, & Zhang, 2013, and the references therein). Early, an outflow from the Source I was detected with v=0, J=2-1 line of SiO (Plambeck et al., 2009), which is from NE to SW and is mainly distributed within the hot core. Around Source I, an ionized disk was imaged with radio and 7 mm continuum emission (Reid et al., 2007). Recently a hot and neutral circumstellar disk around Source I was detected with ALMA (Hirota et al., 2014). The collapse signature, disk, and outflow suggest that the high-mass YSO in Source I forms in similar way to those of low mass stars.
Blue profiles were detected in the hot core, indicating that the inflow motion is weaker than that in Source I. Previous observations showed that inflows occur more frequently and more strongly in UCHii regions than UCHii precursors (see Wu et al., 2007, and the reference therein). The inflow difference of Source I and MM1 is attributed to the fact that Source I is a radio source while there is no YSO found yet in the hot core.
5 Conclusion
We have studied Orion KL region with 1.3 mm continuum and lines of CH3CN (124-114), 13CH3CN (123-113),(133-123) and CH3OH (8-1,8-70,7) observed with ALMA. Seven dust cores MM1 to MM7 were detected. Emissions of IRAC 3.6 and 4.5 m was included in the analysis. Our main findings are as the following:
1. Molecular emissions of CH3CN (124-114) and CH3OH (8-1,8-70,7) were detected from the dust cores. The derived rotation temperatures Trot are from 119 to 198 K. Lines from MM1 and MM2 have usual profiles of cores, and those from MM3, MM4, MM5 and MM6 show jet propelled line characteristics. The line from the western area of MM1 also presents the JPC profile similar to that of MM4. The gas emission of the Orion KL region consists of these JPCs and the cores. The morphology of the major body of the gas emission is similar to a wedge ring.
2. The high velocity gas ranges from -13 to -3 km s-1 and 15 to 24 km s-1 for the blue and red wings respectively. The morphology of the outflow shows multiple lobes. The high velocity gas mainly comes from the JPCs and overlaps with MM1 at its south-west and with the north of MM2. The outflow does not seem to be driven by YSOs like usual bipolar outflows but origins from an explosion.
3. Four infrared bubbles were found with the ratio of [4.5]/[3.6] from infrared emissions with IRAC, Spitzer, which are related to molecular bullets and contain the YSOs in the region. The properties of the BN object, the possible formation mechanism and evolutionary states of the YSOs as well as the distribution of molecular gas in this region were analyzed. Results seem to support that the BN object is the explosive center and the explosion occurred 1300 yrs ago.
4. Properties and spectral profile of Source I and core MM1 are presented. An inverse P Cygni profile was found toward Source I showing gravitational collapse. The infall velocity and mass infall rate are 1.5 km s-1 and 1.210-3M☉/Yr respectively. Inflow motion shown in blue profile was detected toward MM1 (hot core), which has infall velocity 0.6 km s-1 and mass infall rate 8.010-5M☉/Yr.
Acknowledgement
References
- Aitken et al. (1981) Aitken, D. K., Roche, P. F., Spenser, P. M., Jones, B., 1981, MNRAS, 195, 921
- Araya et al. (2005) Araya, E., Hofner, P., Kurtz, S., Bronfman, L., DeDeo, S., 2005, ApJS, 157, 279
- Bachiller et al. (1990) Bachiller, R., Martin-Pintado, J., Tafalla, M., Cernicharo, J., Lazareff, B., 1990, A&A, 231, 174
- Bally et al. (2011) Bally, J., Cunningham, N. J., Moeckel, N., Burton, M. G., Smith, N., Frank, A., Nordlund, A., 2011, ApJ, 727, 113
- Becklin & Neugebauer (1967) Becklin, E. E. & Neugebauer, G., 1967, ApJ, 147, 799
- Beuther & Nissen (2008) Beuther, H. & Nissen, H. D., 2008, ApJ, 679, L121
- Beuther et al. (2010) Beuther, H. Linz, H. Bik, A., Goto, M., Henning, Th., Astron. & Astrophys., 512, 29 (2010)
- Chatterjee & Tan (2012) Chatterjee, S., & Tan, J. C., 2012, ApJ, 754, 152
- Chen et al. (2010) Chen, X., Shen, Z., Li, J., Xu, Y., He, J., 2010, ApJ, 710, 150
- Churchwell et al. (2007) Churchwell, E., Watson, D., Povich, M., Taylor, M., Babler, B., 2007, ApJ, 670, 428
- Cyganowski et al. (2009) Cyganowski, C. J., Brogan, C. L., Hunter, T. R., Churchwell, E. 2009, ApJ, 702, 1615
- De Buizer et al. (2012) De Buizer, J. M., Morris, M. R., Becklin, E. E., Zinnecker, H., Herter, T. L., et al., 2012, ApJ, 749, L23
- Deharveng et al. (2003) Deharveng, L., Zavagno, A., Salas, L., Porras, A., Caplan, J. et al. 2003, A&A,399, 1135
- Doi, O’Dell, & Hartigan (2002) Doi, T., O’Dell, C. R., & Hartigan, P. 2002, AJ, 124, 445
- Downes et al. (1981) Downes, D., Genzel, R., Becklin, E. E., Wynn-Williams, C. G., 1981, ApJ, 244, 869
- Elmegreen & Lada (1977) Elmegreen, B. G.; Lada, C., 1977, ApJ, 214, 725
- Erickson et al. (1982) Erickson, N. R., Goldsmith, P. F., Snell, R. L., Berson, R. L., Huguenin, G. R., Ulich, B. L., Lada, C. J., 1982, ApJ, 261, L103
- Friberg (1984) Friberg, P., 1984 A&A, 132, 265
- Goldsmith & Langer (1999) Goldsmith, P. F., & Langer, W. D., 1999, ApJ, 517, 209
- Gry et al. (1999) Gry, C.; Pineau des For ts, G.; Walmsley, C. M. 1999 A&A, 348, 227
- Hatchell, Fuller, & Ladd (1999) Hatchell, J., Fuller, G. A., & Ladd, E. F., 1999, A&A, 346, 278
- Hirota, Kim & Honma (2012) Hirota, T., Kim, M. K., & Honma, M., 2012, ApJ, 757, L1
- Hirota et al. (2014) Hirota, T., Kim, M. K., Kurono, Y., Honma, M., 2012, ApJ, 782, L28
- Kwan & Scoville (1976) Kwan, J., Scoville, N., 1976, ApJ, 210, L39
- Liu et al. (2002) Liu, S.-Y., Girart, J. M., Remijan, A., Snyder, L. E., 2002, ApJ, 576, 255
- Liu et al. (2011) Liu, T., Wu, Y., Liu, S., Qin, S., Su, Y. et al., 2011, ApJ, 730, 102,
- Liu, Wu, & Zhang (2013) Liu, T., Wu, Y., & Zhang, H. 2013, ApJ, 776, 29
- MacLaren, Richardson & Wolfendale (1988) MacLaren, I., Richardson, K. M., Wolfendale, A. W. 1988, ApJ, 333, 821
- Mardones et al. (1997) Mardones, D., Myers, P. C., Tafalla, M., Wilner, D. J., Bachiller, R. et al. 1997, ApJ, 489, 719
- Matthews et al. (2010) Matthews, L. D., Greenhill, L. J., Goddi, C., Chandler, C. J., Humphreys, E. M. L., Kunz, M. W., 2010, ApJ, 708, 80
- Menten et al. (2007) Menten, K. M., Reid, M. J., Forbrich, J., Brunthaler, A., 2007, A&A, 474, 515
- Myers et al. (1996) Myers, P. C., Mardones, D., Tafalla, M., Williams, J. P., & Wilner, D. J. 1996, ApJ, 465, L133
- Olofsson et al. (1982) Olofsson, H., Ellder, J., Hjalmarson, A., Rydbeck, G., 1982, A&A, 113, L18
- Pineda et al. (2014) Pineda, J. E., Maury, A. J., Fuller, G. A., Testi, L., Garcia-Appadoo, D. et al. 2014, A&A, 544, L7
- Plambeck et al. (2013) Plambeck, R., Bolatto, A., Carpenter, J., Eisner, J. Lamb, J. et al. 2013, ApJ, 765, 40
- Plambeck & Wright (1988) Plambeck, R. L. & Wright, M. C. H., 1988, ApJ, 330, L61
- Plambeck et al. (2009) Plambeck, R. L., Wright, M. C. H., Friedel, D. N., Widicus Weaver, S. L., Bolatto, A. D. et al. 2009, ApJ, 704, L25
- Qin et al. (2010) Qin, S., Wu, Y., Huang, M., Zhao, G., Li, D. 2010, ApJ, 711, 399
- Qin et al. (2008) Qin, S., Zhao, J., Moran, J., Marrone, D., Patel, N. et al., 2008, ApJ, 677, 353
- Reid et al. (2007) Reid, M. J., Menten, K. M., Greenhill, L. J., Chandler, C. J. 2007, ApJ, 664, 950
- Richer, Hills, & Padman (1992) Richer, John S., Hills, Richard E., & Padman, Rachael, 1992, MNRAS, 254, 525
- Rieke, low, & Kleinmann (1973) Rieke, G. H., Low, F. J., Kleinmann, D. E. 1973, ApJ, 186, L7
- Sault et al. (1995) Sault, R. J., Teuben, P. J., & Wright, M. C. H. 1995, in ASP Conf. Ser. 77, Astronomical Data Analysis Software and Systems IV, ed. R. A. Shaw, H. E. Payne, & J. J. E. Hayes (San Francisco, CA: ASP), 433
- Schulz et al. (1995) Schulz, A., Henkel, C., Beckmann, U., Kaseman, C., Schneider, G. et al. 1995, A&A, 295, 183
- Shuping, Morris, & Bally (2004) Shuping, R., Morris, M., & Bally, J., 2004, AJ, 128, 363
- Stolovy et al. (1998) Stolovy, S. R., Burton, M. G., Erickson, E. F., Kaufman, M. J., Chrysostomou, A.et al. 1998,ApJ, 492, L151
- Takami et al. (2010) Takami, M., Karr, J. L., Koh, H., Chen, H., Lee, H. 2010, ApJ, 720, 155
- Taylor et al. (1984) Taylor, K. N. R., Storey, J. W. V., Sandell, G., Williams, P. M., Zealey, W. J., 1984, Nature, 311, 236
- Testi, Tan, & Palla (2010) Testi, L., Tan, J., & Palla, F., 2010, A&A, 522, A44
- Wang & Scoville (1992) Wang, Z. & Scoville, N. Z. 1992, ApJ, 386, 158
- Watson et al. (2008) Watson, C., Povich, M., Churchwell, E., Babler, B., Chunev, G. et al. 2008, ApJ, 681, 1341
- Welch et al. (1987) Welch, Wm. J., Dreher, J. W., Jackson, J. M., Terebey, S., Vogel; S. N., 1987, Sience, 238, 1550
- Wilson et al. (2000) Wilson, T. L., Gaume, R. A., Gensheimer, P., Johnston, K. J., 2000, ApJ, 538, 665
- Wright, Planmbeck & Wilner (1996) Wright, M. C. H, Plambeck, R. L. & Wilner, D. J. 1996, ApJ, 469, 216
- Wu & Evans (2003) Wu, Jingwen. & Evans, Neal J., II., 2003, ApJ, 592, L79
- Wu et al. (2007) Wu, Y., Henkel, C., Xue, R., Guan, X., Miller, M., 2007, ApJ, 669, L37
- Wu et al. (2004) Wu, Y., Wei, Y., Zhao, M., Shi, Y., Yu, W. et al. 2003, A&A, 426, 503
- WynnWilliams et al. (1984) WynnWilliams, C. G, Genzel, R., Becklin, E. E., Downes, D., 1984, ApJ, 281, 172
- Zapata et al. (2009) Zapata, L. A., Schmid-Burgk, J., Ho, P. T. P., Rodriguuez, L. F., Menten, K. M., 2009, ApJ, 704, L45
- Zapata et al. (2011) Zapata, L. A., Loinard1, L.,Schmid-Burgk, J., Rodriguez, L. F., Ho, P.T.P,. and Patel, N. A., 2011, ApJ, 726, L12
- Zapata et al. (2012) Zapata, L. A., Rodríguez, L. F., Schmid-Burgk, J., Loinard, L., Menten, K. M., Curiel, S., 2012, ApJ, 754, L17
- Zhang & Ho (1997) Zhang, Q. & Ho, P., 1997, ApJ, 488, 241
| Name | Offset | R= | Ipeak | Sν | Vlsr | V | Trot | Mvirial |
|---|---|---|---|---|---|---|---|---|
| () | (10-3 pc) | (Jy beam-1) | (Jy) | (km s-1) | (km s-1) | (K) | (M☉) | |
| MM1/hot core | (2.900.05,3.610.08) | 6.6 | 1.34(0.06) | 6.18 | 5.4(0.3) | 6.5(0.3) | 198 | 59 |
| MM2 | (-1.070.11,-2.040.16) | 2.3 | 0.15(0.02) | 0.38 | 7.5(0.1) | 3.1(0.1) | 156 | 5 |
| MM3 | (-4.490.12,-1.97) | 3.8 | 0.28(0.03) | 1.02 | 8.0(0.2) | 2.4(0.2) | 100? | 5 |
| MM4 | (-1.58,4.090.13) | 2.4 | 0.22(0.03) | 0.43 | 5.5(0.2) | 5.9(0.8) | 182 | 18 |
| MM5 | (-3.610.07,6.090.15) | 6.7 | 0.28(0.02) | 1.27 | 10.1(0.1) | 5.4(0.2) | 157 | 41 |
| MM6 | (-3.720.09,7.580.12) | 2.2 | 0.28(0.02) | 0.61 | 7.5(0.3) | 5.7(0.3) | 119 | 15 |