Star catalog position and proper motion corrections in asteroid astrometry
Abstract
We provide a scheme to correct asteroid astrometric observations for star catalog systematic errors due to inaccurate star positions and proper motions. As reference we select the most accurate stars in the PPMXL catalog, i.e., those based on 2MASS astrometry. We compute position and proper motion corrections for 19 of the most used star catalogs. The use of these corrections provides better ephemeris predictions and improves the error statistics of astrometric observations, e.g., by removing most of the regional systematic errors previously seen in Pan-STARRS PS1 asteroid astrometry. The correction table is publicly available at ftp://ssd.jpl.nasa.gov/pub/ssd/debias/debias_2014.tgz and can be freely used in orbit determination algorithms to obtain more reliable asteroid trajectories.
keywords:
Asteroids , Orbit determination1 Introduction
Whenever we compute an asteroid’s orbit, it comes with an uncertainty region due to the limited accuracy of the available observations. In other words, orbits are only known in a statistical sense and the accuracy of the related probabilistic interpretation relies heavily on the observation accuracy and error modeling. Therefore, it is important to apply an appropriate statistical treatment to the observations used to compute the orbit.
The vast majority of asteroid astrometry is given by optical observations, i.e., each observation provides two angular measurements, typically right ascension (RA) and declination (DEC) in the equatorial reference frame J2000, describing the position of an asteroid on the celestial sphere at a specified time. Such measurements are obtained with respect to nearby reference stars, whose positions are provided by a reference star catalog. In general, the more accurate the star catalog, the more accurate the observation.
Despite the common assumption that observation errors have zero mean, Carpino et al. (2003) show that asteroid astrometry is significantly biased and suggest the reason is the presence of systematic errors in the star catalogs used to reduce the astrometry.
Chesley et al. (2010) computed star catalog systematic errors for USNO-A1.0 (Monet, 1996), USNO-A2.0 (Monet, 1998), USNO-B1.0 (Monet et al., 2003), UCAC2 (Zacharias et al., 2004b), and Tycho-2 (Høg et al., 2000) by comparing each of these catalogs to 2MASS (Skrutskie et al., 2006). Despite the lack of proper motions, 2MASS was chosen as the reference catalog because of its very accurate star positions at epoch J2000.0 and high spatial density. Chesley et al. (2010) showed that correcting asteroid astrometry using their computed biases leads to significantly lower systematic errors and statistically better ephemeris predictions.
Pan-STARRS PS1 (Hodapp et al., 2004) is one of the most accurate asteroid surveys with an astrometric quality of the order of 0.1”. Although this survey uses 2MASS as reference catalog for the astrometric reduction, Milani et al. (2012) found that Pan-STARRS PS1 data have surprisingly high biases on the order of 0.05–0.1” with a strong regional dependence. Tholen et al. (2013b) show that the lack of proper motion in 2MASS is likely to be the cause of the Pan-STARRS PS1 astrometry systematic errors and signatures. Moreover, they suggest that PPMXL (Roeser et al., 2010) be used as reference catalog because of its spatial density, accuracy comparable to that of 2MASS, and availability of proper motion information.
Since the lack of proper motion can be significant for high quality observations, in this paper we describe how to correct asteroid observations for both position and proper motion errors. Moreover, we perform this analysis for a more comprehensive list of star catalogs than that considered in Chesley et al. (2010).
2 Asteroid astrometry
As of January 2014 more than 600,000 asteroids have been designated, 60% of which are numbered. The number of asteroid optical observations is already larger than 100,000,000 and increases every day. Observers submit their observations to the Minor Planet Center (MPC)111http://www.minorplanetcenter.net/ and usually provide information on the catalog used to perform the astrometric reduction. The MPC in turn makes the catalog information publicly available by using an alphabetical flag222http://www.minorplanetcenter.net/iau/info/CatalogueCodes.html.
Table 1 shows the MPC flag, the number of stars, and the number of asteroid observations different catalogs. We only consider the catalogs for which the number of asteroid observations reported to the MPC with the corresponding catalog flag was larger than 40,000 as of January 2014. We also included the GSC-1.2 (Morrison et al., 2001) catalog to complete the GSC-1 catalog series. The most used catalog is USNO-A2.0, with more than 40,000,000 asteroid observations. 2MASS, which was used as the reference catalog by Chesley et al. (2010), is the fourth most used catalog and the related astrometry is dominated by Pan-STARRS PS1 observations (more than 75% of the sample). Observations reported with code ‘z’ were reduced with one of the GSC catalogs, but we do not know which one.
| Catalog | MPC | Number | Asteroid observations | Reference | |
|---|---|---|---|---|---|
| flag | of stars | Count | % | ||
| USNO-A2.0 | c | 526,280,881 | 40,408,360 | 38.47 | Monet (1998) |
| UCAC-2 | r | 48,330,571 | 29,793,925 | 28.37 | Zacharias et al. (2004b) |
| USNO-B1.0 | o | 1,045,175,762 | 12,834,999 | 12.22 | Monet et al. (2003) |
| 2MASS | L | 470,992,970 | 8,136,250 | 7.75 | Skrutskie et al. (2006) |
| UCAC-4 | q | 113,780,093 | 2,629,456 | 2.50 | Zacharias et al. (2013) |
| UCAC-3 | u | 100,766,420 | 2,228,325 | 2.12 | Zacharias et al. (2010) |
| USNO-A1.0 | a | 488,006,860 | 2,193,938 | 2.08 | Monet (1996) |
| USNO-SA2.0 | d | 55,368,239 | 1,698,129 | 1.62 | Monet (1998) |
| GSC-1.1 | i | 18,836,912 | 614,617 | 0.59 | Lasker et al. (1996) |
| UCAC-1 | e | 27,425,433 | 501,774 | 0.48 | Zacharias et al. (2000) |
| SDSS-DR7 | N | 357,175,411 | 479,914 | 0.46 | Abazajian et al. (2009) |
| GSC-ACT | m | 18,836,912 | 404,473 | 0.39 | Lasker et al. (1999) |
| CMC-14 | w | 95,858,475 | 361,928 | 0.34 | Copenhagen University et al. (2006) |
| Tycho-2 | g | 2,430,468 | 355,813 | 0.34 | Høg et al. (2000) |
| USNO-SA1.0 | b | 54,787,624 | 337,561 | 0.32 | Monet (1996) |
| GSC (unspecified) | z | N/A | 288,156 | 0.27 | N/A |
| ACT | l | 988,758 | 117,638 | 0.11 | Urban et al. (1998) |
| PPMXL | t | 910,468,688 | 88,328 | 0.08 | Roeser et al. (2010) |
| NOMAD | v | 1,117,612,732 | 58,266 | 0.06 | Zacharias et al. (2004a) |
| PPM | p | 378,910 | 41,468 | 0.04 | Roeser and Bastian (1991) |
| GSC-1.2 | j | 18,841,548 | 16,975 | 0.02 | Morrison et al. (2001) |
3 Star catalog position and proper motion corrections
To correct asteroid optical astrometry for star catalog systematic errors, we need to select a reference for comparison with the other catalogs. Such a selection is far from easy. Hipparcos (Perryman et al., 1997) and Tycho2 are space-based, so they are not subject to differential refraction corrections as ground-based observations are, possibly making them the best available catalogs. However, a reference catalog should be both dense and accurate and neither Tycho-2 nor Hipparcos are dense enough. As shown in Table 1, the catalogs with the largest number of stars include USNO-A1.0 (Monet, 1996), USNO-A2.0 (Monet, 1998), USNO-B1.0 (Monet et al., 2003), 2MASS (Skrutskie et al., 2006), PPMXL (Roeser et al., 2010), and NOMAD (Zacharias et al., 2004a). Chesley et al. (2010) proved that the USNO catalogs are affected by systematic errors in position as large as 1–2”. NOMAD is a simple merge of the Hipparcos, Tycho-2, UCAC2, and USNO-B1.0 and is therefore still affected by the biases present in USNO-B1.0. Tholen et al. (2013b) show that 2MASS is not the appropriate choice because of the lack of proper motion. PPMXL (Roeser et al., 2010) is also a merge of 2MASS and USNO-B1.0, but it includes proper motions and a critical reprocessing of star positions from 2MASS and USNO-B1.0. Therefore, PPXML seems a sensible choice for a reference catalog. However, tests similar to one presented in Sec. 4.3 were not satisfactory as we found that correcting with respect to PPMXL rather than 2MASS (as in Chesley et al., 2010) can provide less accurate predictions. As described by Roeser et al. (2010), more than 50% of PPMXL stars are based on USNO-B1.0 and are not accurate enough for our purposes. To fix this problem, we selected as a reference catalog the subset of PPMXL corresponding to over 400 millions stars derived from 2MASS. This reference benefits from the accuracy of 2MASS star positions and yet accounts for proper motions.
As in Chesley et al. (2010), to compare the different star catalogs to our reference catalog we divided the celestial sphere into 49,152 equal-area tiles (0.8 deg2) using the JPL HEALPix package (Górski et al., 2005). For all the catalogs analyzed, we took star positions at epoch J2000.0. To identify stars in common within a given tile we used a spatial correlation of 2”. Whenever more than one identification with the same star is possible, we need to be careful and avoid spurious identifications. If are the distances between the considered star and the matches in the reference catalog, as a safety measure we selected the identification only if for and . If none of the identifications met this condition we rejected all the identification to avoid including spurious matches in our analysis.
We also made sure that stars in the reference catalog were not paired to more than one star. For each tile we computed the average correction in position and proper motion for both right ascension and declination. Because of the present biases, for some catalogs the 2” spatial correlation may not be enough to find matching stars. Therefore, we applied the procedure iteratively, i.e., we corrected the stars in the catalog to be debiased by subtracting the systematic error for the corresponding tile found at the previous iteration.
At the end of the process, for each given tile and catalog we have a correction in RA and DEC at epoch J2000.0, , and proper motion corrections . These numbers can be used to correct asteroid astrometric observations by subtracting the following quantities:
where is the observation epoch, and , , , and are the position and proper motion corrections for the tile containing the astrometric observation. Note that , , and account for the spherical metric factor . Of course, the successful application of these corrections relies on the accuracy of the catalog information provided in the MPC observation database. The star position and proper motion correction table is publicly available at ftp://ssd.jpl.nasa.gov/pub/ssd/debias/debias_2014.tgz. The main differences with respect to the Chesley et al. (2010) debiasing scheme are:
-
1.
our reference catalog is not 2MASS but the subset of PPMXL based on 2MASS astrometry;
-
2.
the present debiasing scheme accounts for both position and proper motion errors, while Chesley et al. (2010) only considered position errors;
-
3.
we compute corrections for a more comprehensive list of star catalogs.
For each analyzed catalog, Table 2 reports the average size of the corrections in terms of RMS, e.g.
| (1) |
| Catalog | PM | Sky | ||||
|---|---|---|---|---|---|---|
| [arcsec] | [arcsec] | inc. | [mas/yr] | [mas/yr] | coverage | |
| Tycho-2 | 0.02 | 0.02 | Yes | 0.7 | 0.7 | 100% |
| ACT | 0.02 | 0.02 | Yes | 1.5 | 1.4 | 100% |
| 2MASS | 0.03 | 0.02 | No | 5.8 | 6.4 | 100% |
| USNO-A1.0 | 0.45 | 0.37 | No | 5.1 | 5.7 | 100% |
| USNO-SA1.0 | 0.45 | 0.37 | No | 5.0 | 5.5 | 100% |
| USNO-A2.0 | 0.21 | 0.24 | No | 5.1 | 5.7 | 100% |
| USNO-SA2.0 | 0.21 | 0.24 | No | 5.0 | 5.6 | 100% |
| USNO-B1.0 | 0.12 | 0.17 | Yes | 4.4 | 4.9 | 100% |
| UCAC-1 | 0.03 | 0.03 | Yes | 5.8 | 7.4 | 39% |
| UCAC-2 | 0.01 | 0.01 | Yes | 2.5 | 2.2 | 88% |
| UCAC-3 | 0.02 | 0.02 | Yes | 5.0 | 4.6 | 100% |
| UCAC-4 | 0.02 | 0.02 | Yes | 2.2 | 2.5 | 100% |
| GSC-1.1 | 0.47 | 0.38 | No | 6.8 | 6.6 | 100% |
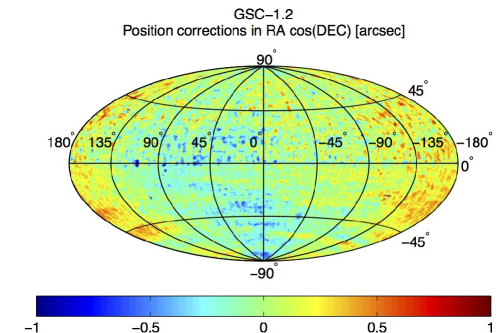
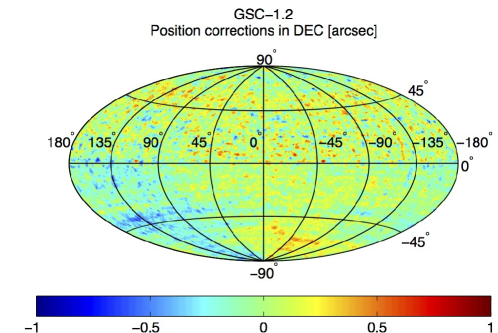
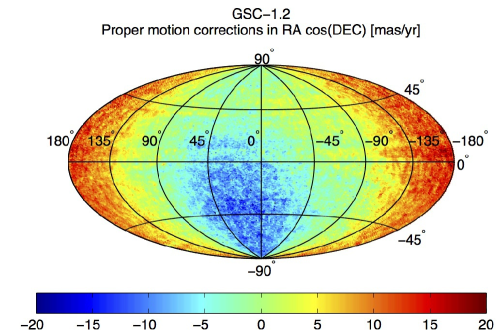
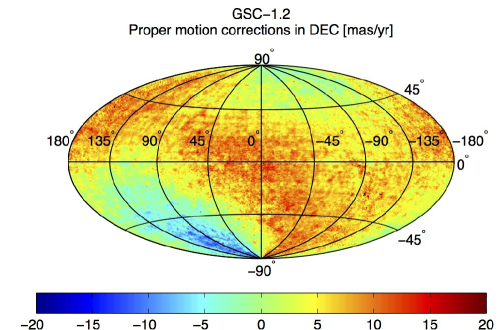
| GSC-1.2 | 0.20 | 0.18 | No | 6.7 | 6.6 | 100% |
| GSC-ACT | 0.15 | 0.13 | No | 6.7 | 6.6 | 100% |
| NOMAD | 0.10 | 0.15 | Yes | 3.7 | 4.3 | 100% |
| PPM | 0.23 | 0.24 | Yes | 4.1 | 4.2 | 100% |
| CMC-14 | 0.03 | 0.04 | No | 6.3 | 7.0 | 62% |
| SDSS-DR7 | 0.05 | 0.07 | Yes | 2.6 | 3.2 | 31% |
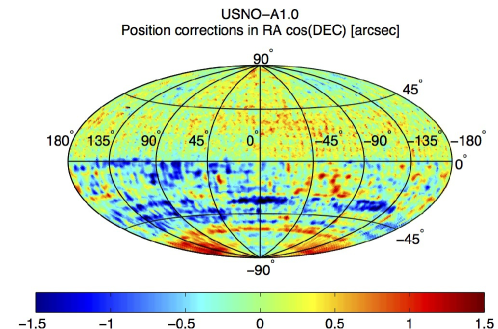
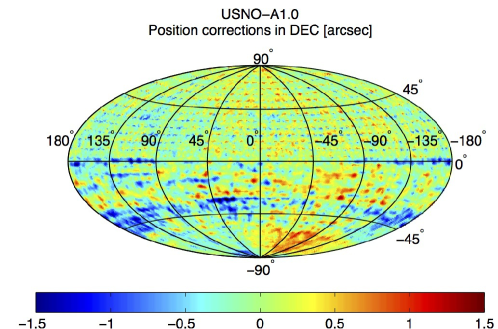
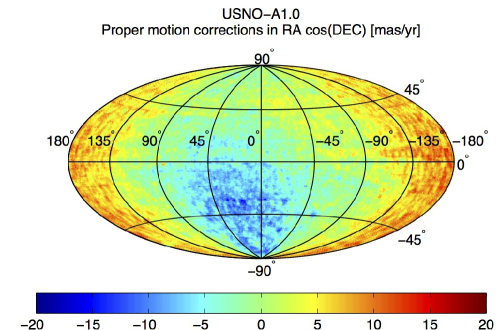
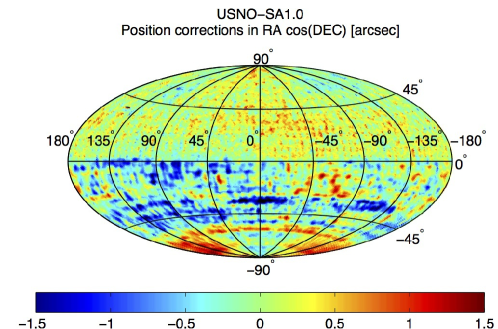
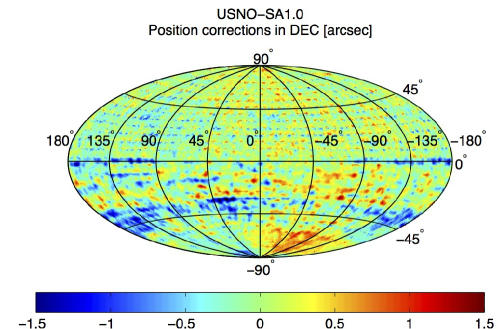
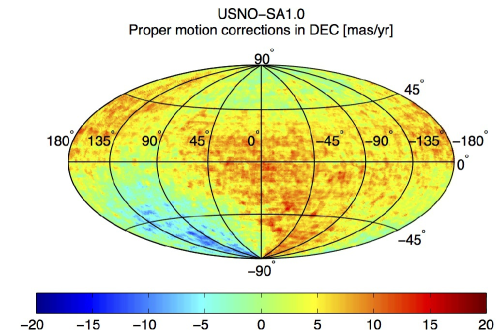
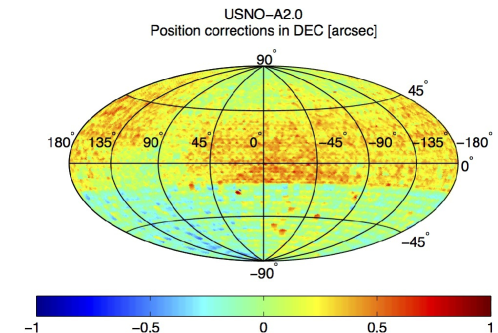
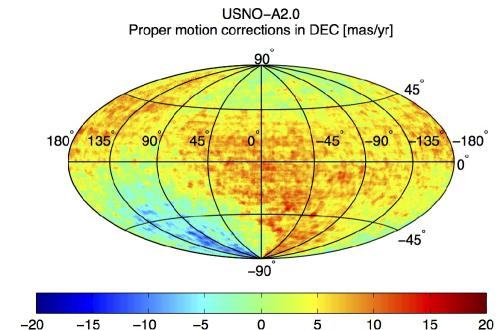
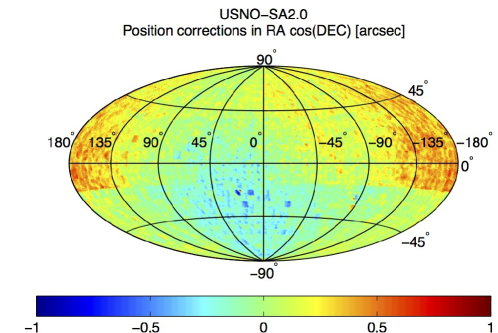
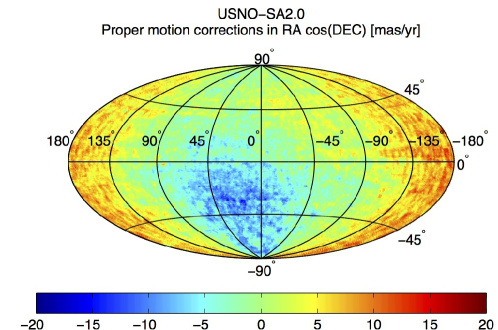
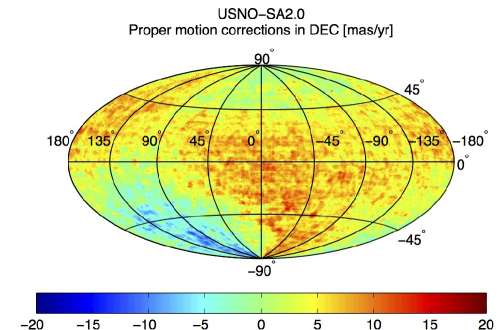
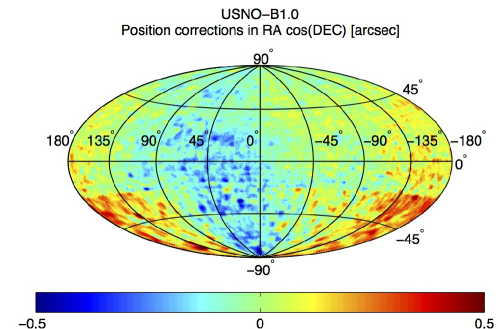
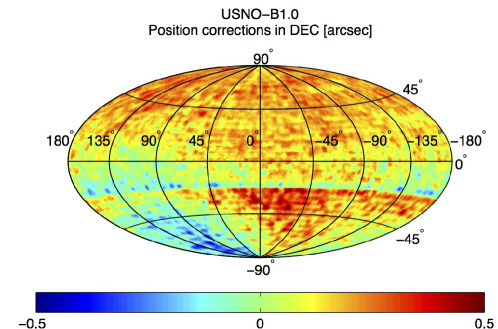
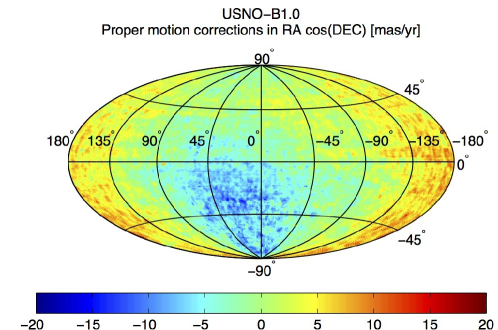
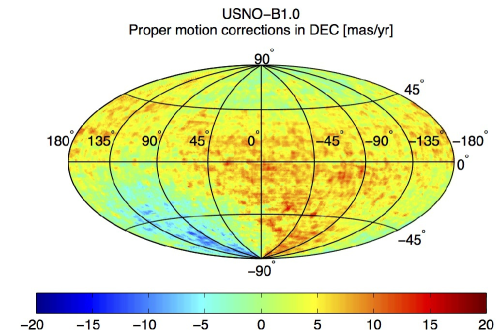
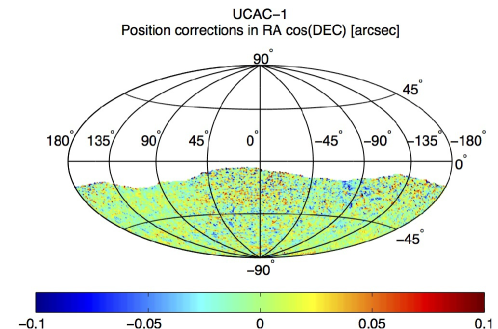
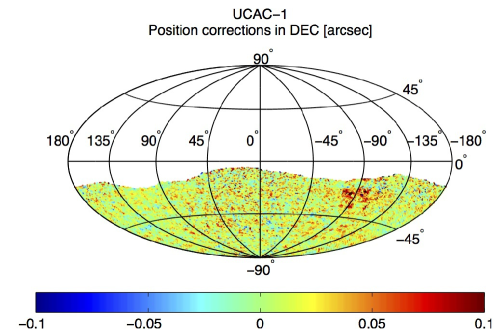
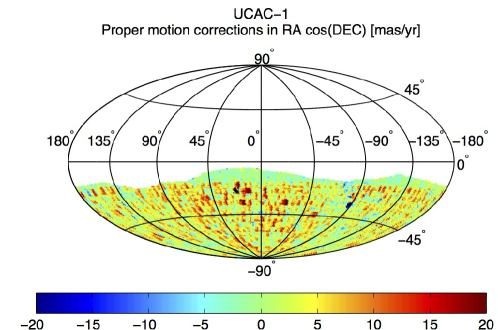
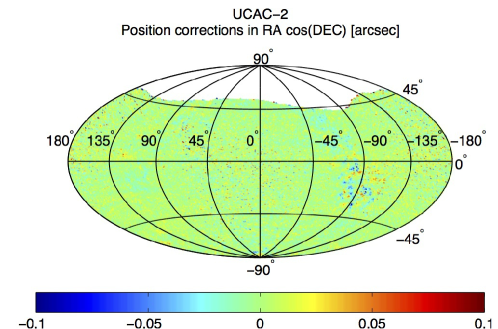
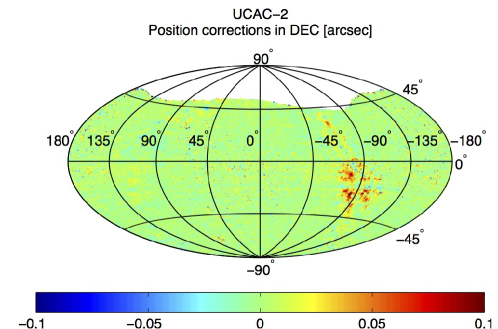
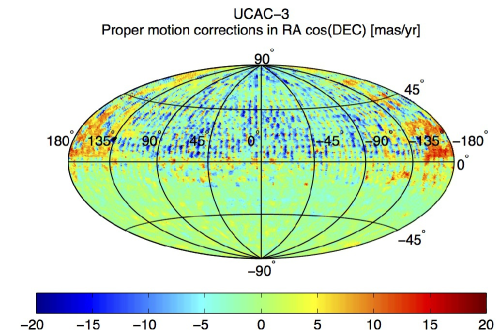
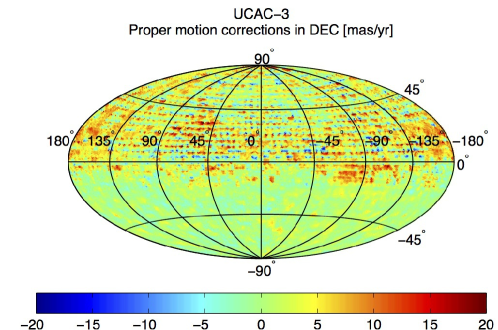
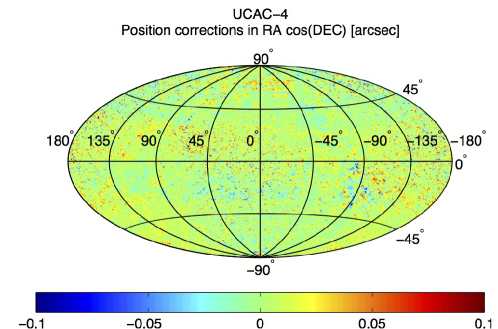
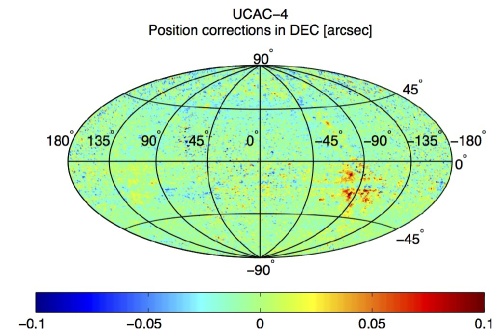
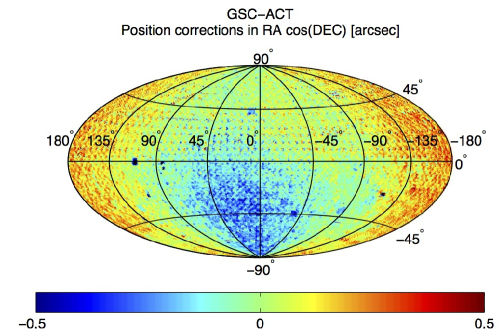
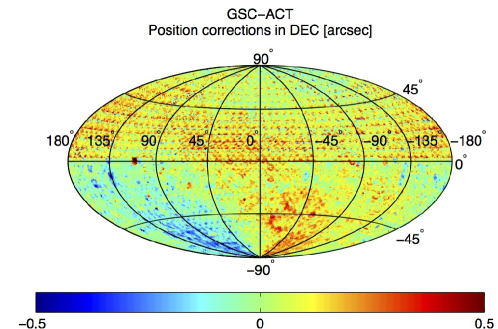
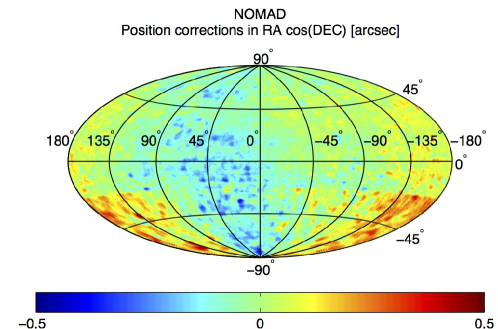
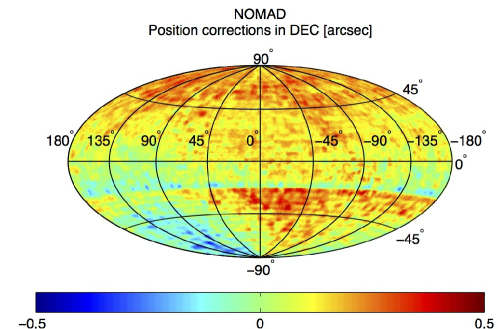
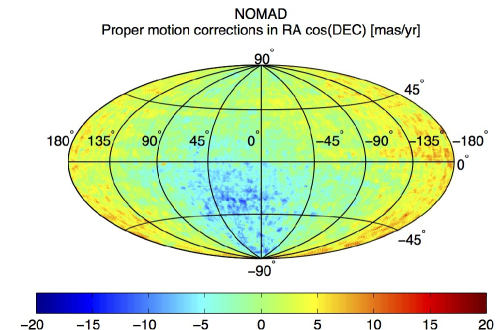
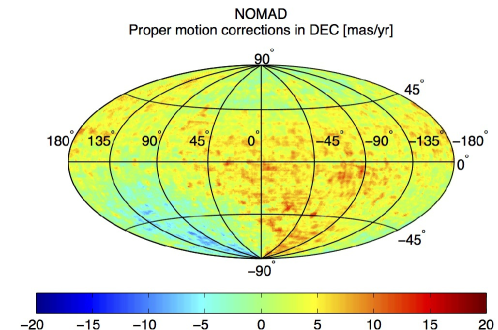
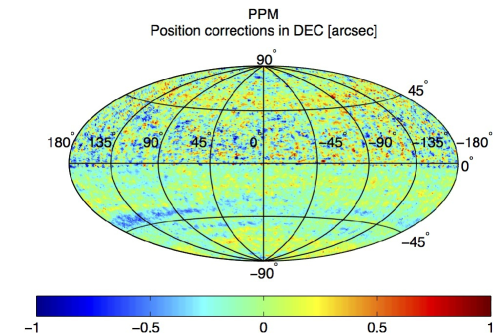
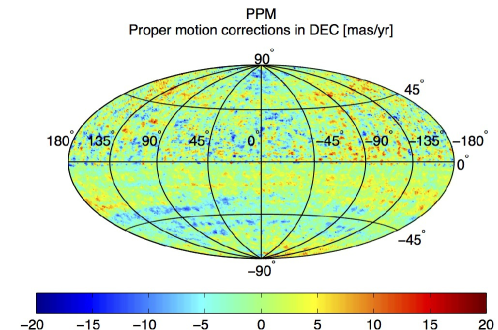
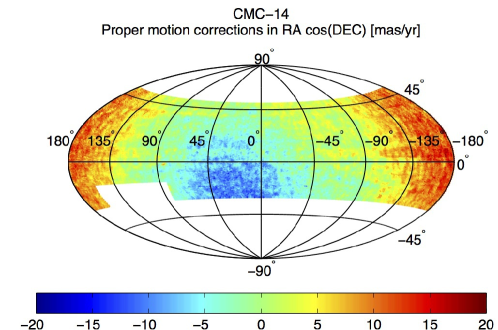
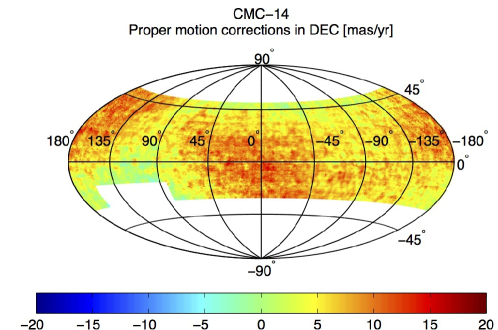
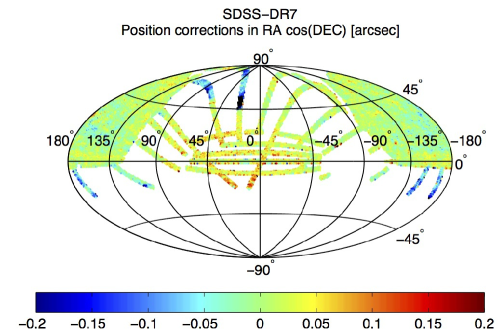
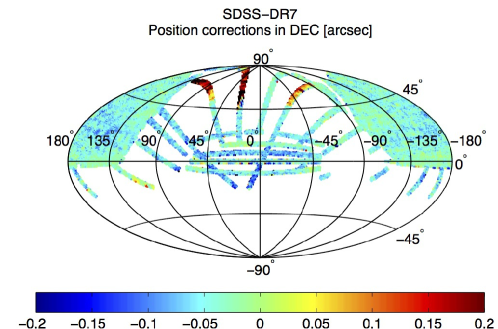
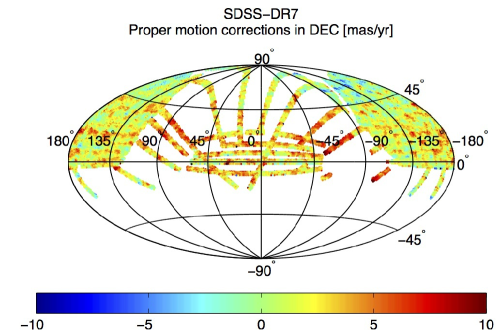
Figures 1–19 depict sky maps of the position and proper motion corrections for the analyzed catalogs, which we discuss in more detail in the following subsections. Note that the color scale is not the same for all catalogs to reveal the regional structures of the position and proper motion corrections.
As shown in Table 3, the right ascension and declination corrections are not available for 1.65% of the reported astrometry. In most of these cases ( 1,000,000 observations) we cannot apply corrections because there is no catalog information. Moreover, almost 290,000 observations were reported as reduced using a GSC catalog, without specifying which specific GSC catalog was used. Finally, about 100,000 observations were reduced with catalogs not included in our analysis.
| Type | MPC flag | Unknown catalog | Known Catalog | Total | Dates | |
| Corrected | Not corrected | |||||
| CCD | C | 530,374 | 99,938,430 | 279,375 | 100,748,179 | 1986–2014 |
| Corrected CCD | c | 440 | 1,214,291 | 1,778 | 1,216,509 | 1991–2013 |
| Former B1950 | A | 554,220 | 10,036 | 82,519 | 646,775 | 1802–1999 |
| Photographic | ’ ’ | 207,812 | 118,743 | 27,258 | 353,813 | 1898–2012 |
| Meridian or transit circle | T | 25,357 | 1,611 | 0 | 26,968 | 1984–2005 |
| Micrometer | M | 0 | 13,008 | 0 | 13,008 | 1845–1954 |
| Suppressed | X | 6,538 | 4,289 | 2,183 | 13,010 | 1891–2010 |
| Suppressed | x | 5 | 3,763 | 0 | 3,768 | 1996–2010 |
| Hipparcos | H | 5,494 | 0 | 0 | 5,494 | 1989–1993 |
| Occultation | E | 1,005 | 871 | 68 | 1,944 | 1961–2013 |
| Satellite | S | 4,331 | 1,996,679 | 1,335 | 2,002,345 | 1994–2013 |
| Roving observer | V | 102 | 92 | 0 | 194 | 2000–2012 |
| Normal place | N | 0 | 37 | 0 | 37 | 1906–1923 |
| Mini-normal place | n | 0 | 273 | 0 | 273 | 2009–2013 |
| Encoder | e | 1 | 14 | 1 | 16 | 1993–1995 |
| Total | 1,335,679 | 103,302,137 | 394,517 | 105,032,333 | ||
| 1.27% | 98.35% | 0.38% | ||||
3.1 PPMXL and 2MASS
Since our reference catalog is a subset of PPMXL, the comparison yields no corrections for PPMXL. Still, it is worth pointing out that astrometry reduced with PPMXL can suffer from the lower accuracy of USNO-B1.0 based stars.
Due to our choice for the reference catalog, we expect small differences in the 2MASS star positions. As a matter of fact, we have position differences of the order of 0.01” – well consistent with the 2MASS stated accuracy of (Skrutskie et al., 2006). Though these corrections are small, the top panels of Fig. 1 show some regional dependence, which may be due to the lack of proper motion for the time interval in which star positions were integrated.
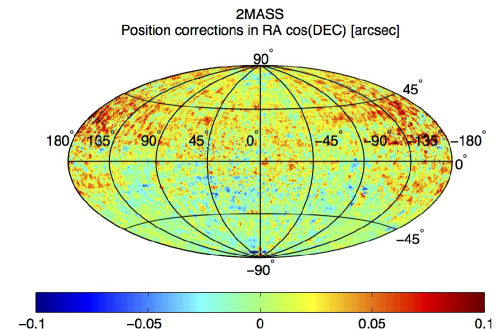
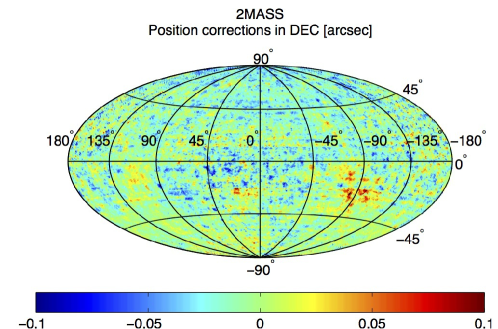
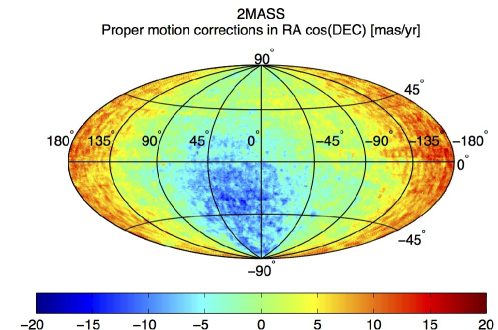
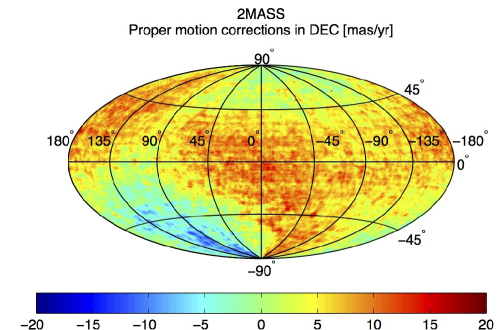
The bottom panels of Fig. 1 show the proper motion corrections to be applied to 2MASS. Since 2MASS does not have proper motions, these two panels give the proper motion distribution for stars that 2MASS and PPMXL have in common. There is an evident regional dependence and it is clear that the lack of proper motion may cause significant position errors if the observation epoch is not close to J2000.0. Thus, we apply both position and proper motion corrections to observations reduced with 2MASS.
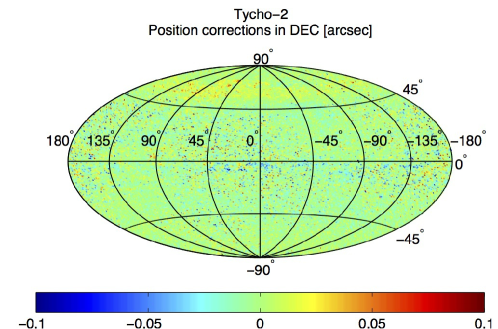
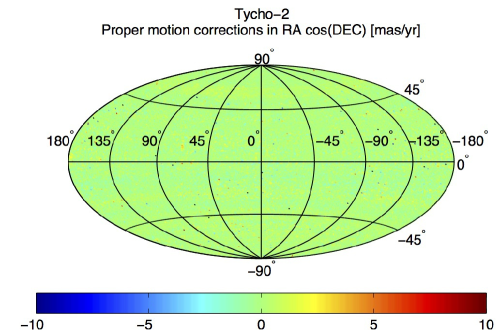
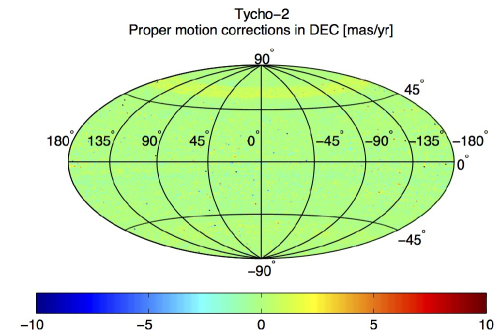
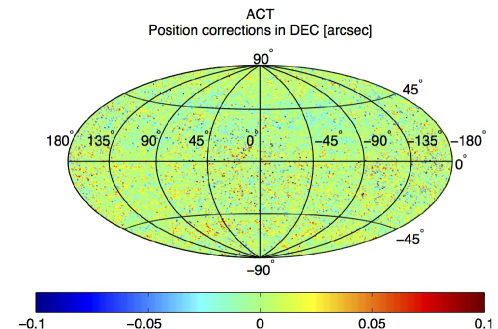
3.2 Tycho-2 and ACT
Tycho-2 (Fig. 2) and ACT (Fig. 3) are catalogs with a relatively low number of stars. Both positions and proper motions are close to those of our reference catalog. There is no clear signature and the differences could simply be noise. Therefore, we decided to apply no corrections to the Tycho-2 and ACT based astrometry. Good agreement between Tycho-2, which is space based, and our reference catalog gives us some additional confidence that our reference catalog has good positions and proper motions, at least for the stars in common.


3.3 USNO catalogs
Chesley et al. (2010) showed that the USNO catalogs (Fig. 4 – Fig. 8) present significant position biases. Moreover, the USNO-A catalogs do not account for proper motions. Although USNO-B1.0 does have proper motions for some of its stars, the proper motion differences with our reference are of the same order of the USNO-A catalogs thus indicating that USNO-B1.0 proper motions are not generally accurate enough. We therefore correct all the astrometry based on the USNO catalogs for both position and proper motion errors.


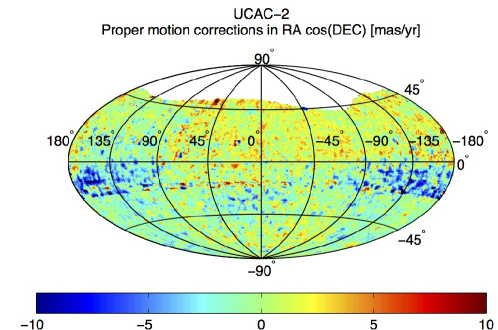
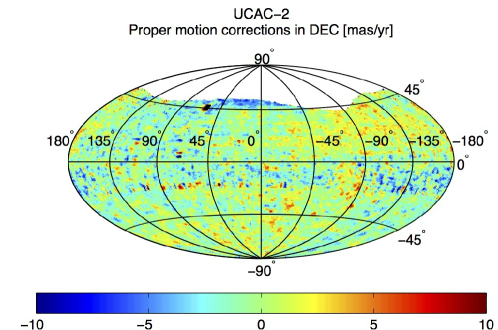
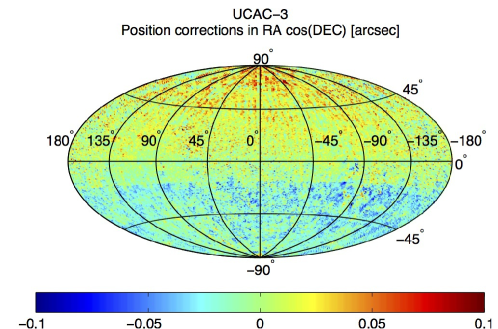
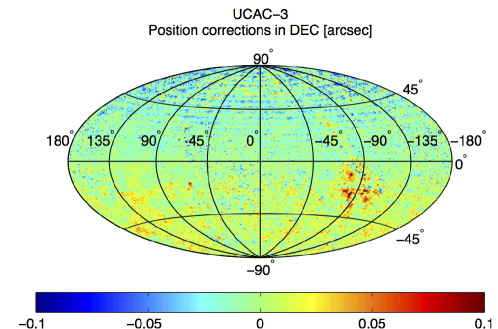
3.4 UCAC catalogs
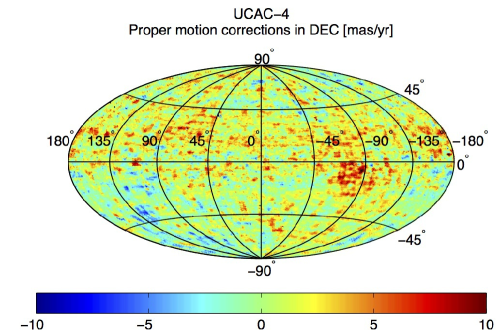
The UCAC catalogs (Fig. 9 – Fig. 12) provide extremely good star positions, very close to those of our reference. However, proper motions look problematic: UCAC-1 and UCAC-3 have significant corrections of the order of 5 mas/yr, while UCAC-2 and UCAC-4 seem to have better proper motions. Roeser et al. (2010) report problems in UCAC-3 proper motions, in particular for declinations greater than .
Despite being the final product of the UCAC series, UCAC-4 has some regional dependence of the proper motions suggesting that there are still unresolved issues with proper motions. Moreover, the comparison between UCAC-4 and Tycho-2 provides average proper motion corrections of 2 mas/yr, while the comparison between the subset of PPMXL that we are using as reference and Tycho-2 gives average proper motion differences mas/yr. Due to the high quality of Tycho-2, these differences further suggest that UCAC-4 proper motions have correctable errors.
These indications suggest that proper motion in the UCAC catalogs should be corrected, but corrections in positions are small. For consistency, we correct both positions and proper motions.


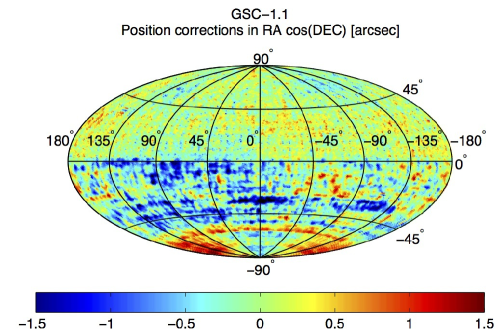
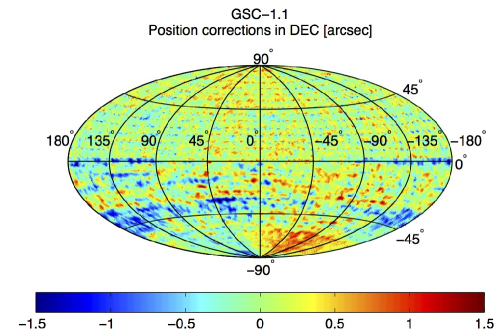
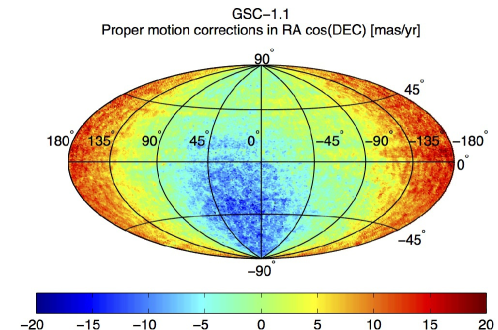
3.5 GSC catalogs
GSC-1 (Fig. 13 and Fig. 14) and GSC-ACT (Fig. 15) catalogs are significantly biased and have no proper motion information. There is no doubt that the astrometry reduced with these two catalogs should be corrected.
As shown in Table 1 there are almost 300,000 asteroid observations submitted with the flag code ‘z’. These observations were reduced with one of the GSC catalogs but we do not know which one. It may be either one of the GSC-1 catalogs or one of the GSC-2 catalogs (STScI, 2001; Spagna et al., 2006). As a consequence, we cannot correct those observations. It would be very useful if observers could provide the MPC with the information on which specific GSC catalog they used to reduce the astrometry.


3.6 Other catalogs
For NOMAD (Fig. 16) both position and proper motion corrections are very similar to those of USNO-B1.0. This is not a surprise as NOMAD is a merge of a few catalogs, and USNO-B1.0 is the one with the largest number of stars. Thus, we correct NOMAD for both positions and proper motions.
PPM (Fig. 17) shows significant errors in both positions and proper motions. There is no doubt that observations reduced with this catalog should be debiased.

Despite the missing proper motions, CMC-14 (Fig. 18) provides good star positions. However, position corrections show a regional dependence correlated to proper motion features. We therefore corrected all the CMC-14 based astrometry.


SDSS-DR7 (Fig. 19) does not seem to be an ideal catalog for astrometric reduction. As we can see from Fig. 19, this catalog does not have uniform coverage of the sky. Moreover, the position and proper motion errors are significant. We therefore correct all the SDSS-DR7 based astrometry. It is worth noticing that all but 10 of the observations reduced using SDSS-DR7 were obtained by the Palomar Transient Factory survey (Law et al., 2009).

4 Improvement of residual statistcs and ephemeris predictions
4.1 Tests with Apophis, Bennu, and Golevka
We tested the astrometric corrections described in this paper on three asteroids with the best constrained trajectories: (99942) Apophis, (101955) Bennu, and (6489) Golevka
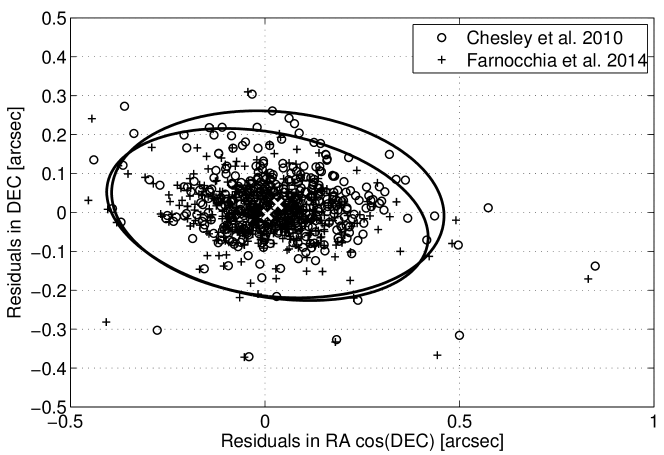
Tholen et al. (2013a) reported over 430 high quality ground-based optical observations for Apophis. We analyzed the behavior of the postfit residuals, i.e., against the best fitting orbital solution, for the Tholen et al. (2013a) observations by using the Chesley et al. (2010) debiasing scheme and the one presented in this paper. Figure 20 shows a scatter plot of the postfit residuals in RA and DEC with the two different schemes. In both cases, the orbital solution is computed by only using the Tholen et al. (2013a) astrometry, Magdalena Ridge and Pan-STARRS PS1 observations, and radar astrometry (for details see Farnocchia et al., 2013). With the Chesley et al. (2010) scheme, the Tholen et al. (2013a) observations show mean RA/DEC postfit residuals of . The adoption of the new scheme reduces the RA/DEC mean postfit residuals to . The clear improvement is mostly due to the proper motion corrections of 2MASS based astrometry, which dominates the Tholen et al. (2013a) dataset.
Near-Earth asteroids Golevka (Chesley et al., 2003), Bennu (Chesley et al., 2014), and Apophis (Farnocchia et al., 2013) have exceptionally well constrained orbits thanks to the availability of three radar apparitions. Table 4 shows the normalized , i.e., the weighted sum of the squared postfit residuals, of the orbital fit for the Chesley et al. (2010) debiasing scheme and the one presented here. For the computation of normalized we used the Chesley et al. (2010) data weights as well as some manual weights as described in Chesley et al. (2014) and Farnocchia et al. (2013). In both cases improves with the new debiasing scheme, especially for Golevka. Since the nominal trajectory is already well constrained by the radar measurements, measures how well the optical observations fit the trajectory. Therefore, the improvement in further suggest that the new debiasing scheme is more accurate.
| Object | Chesley et al. (2010) | this paper | |
|---|---|---|---|
| (99942) Apophis | 231 | 201 | 30 |
| (101955) Bennu | 227 | 224 | 3 |
| (6489) Golevka | 1024 | 1005 | 19 |
4.2 Test with Pan-STARRS PS1 data
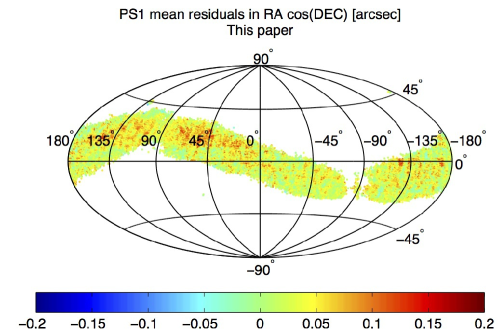
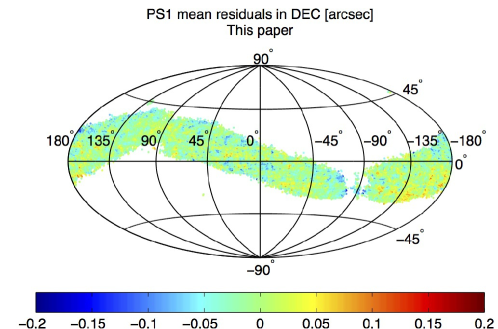
Milani et al. (2012) found unexpected biases in Pan-STARRS PS1 data and Tholen et al. (2013b) show clear correlations between the detected biases and the lack of proper motion in 2MASS, which is the reference catalog for Pan-STARRS PS1 astrometry. Since the debiasing scheme presented in this paper corrects for proper motions, the size of detected biases should decrease significantly.
Table 5 shows the mean and standard deviation of Pan-STARRS PS1 residuals in both RA and DEC. There is a modest improvement in RA and a more significant improvement in DEC.
| Residuals | ||
| DEC | ||
| Chesley et al. (2010) | 0.05” 0.13” | 0.06” 0.12” |
| This paper | 0.04” 0.11” | -0.01” 0.11” |
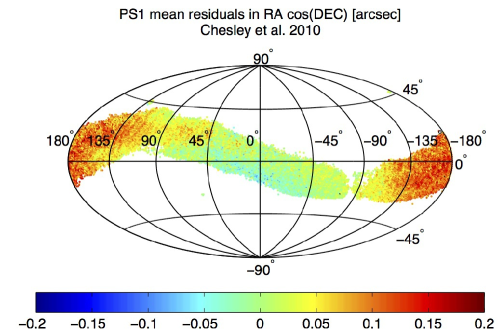
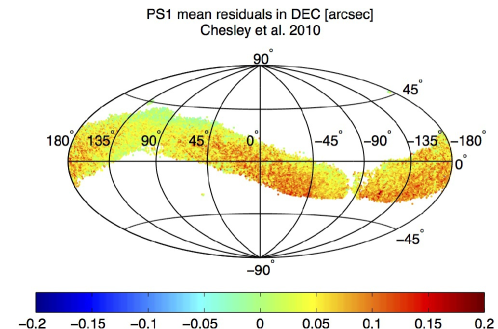
Figure 21 is a sky map of Pan-STARRS PS1 mean residuals in the sky and helps to better appreciate the improvement due to the new debiasing scheme. We only considered those tiles in the sky with at least 100 observations. Top panels correspond to the Chesley et al. (2010) debiasing scheme. We can clearly see the correlation between the found biases and star proper motions (e.g., see bottom panels of Fig. 1). The bottom panels show the mean residuals using the new debiasing scheme. A clear improvement is evident from the application of the new debiasing scheme. In particular, the clear regional structure of the systematic error distribution vanished.
4.3 Prediction test
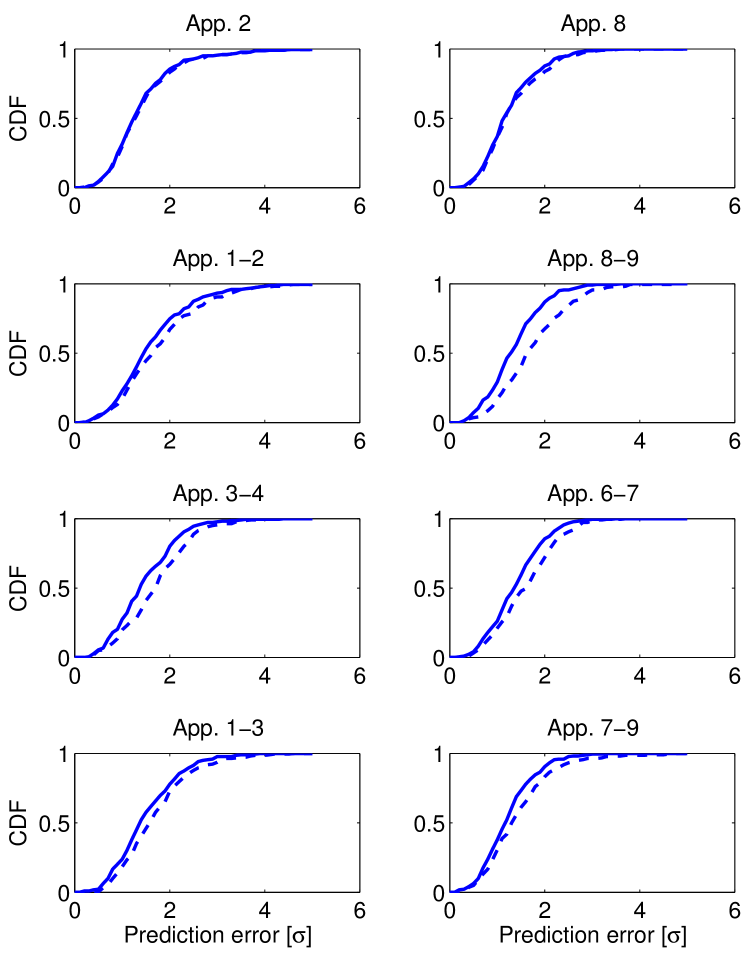
To validate the new debiasing scheme the most important test is prediction: the orbits computed with the new scheme have to provide better predictions. We performed a test similar to that described by Chesley et al. (2010, Sec. 6). We took the same 222 asteroids, but we considered the last 9 apparitions. For each object we selected different subsets of the observational arc, propagated to the central epoch of the 5th apparition, computed the 3-dimensional Cartesian position, and compared to the solution obtained by using the full observational dataset, which is considered as the truth. The comparison was done consistently, i.e., if the prediction was computed with the Chesley et al. (2010) scheme, then the truth was computed with Chesley et al. (2010) scheme, and similarly for the scheme presented in this paper.
For each subset of the 9 apparitions, the new debiasing scheme performed better than that from Chesley et al. (2010). As an example, Fig. 22 shows the cumulative distributions of the prediction error for predictions made by using different subsets of the 9 considered apparitions. We can see how the cumulative prediction error distributions obtained with the new scheme are better than those obtained with the Chesley et al. (2010) scheme.
5 Data weights and correlations
The computation of an orbit is the result of a least square procedure (Milani and Gronchi, 2010, Chap. 5). It is important that individual observations are assigned weights that reflect the expected accuracy , i.e., . Tables 6–9 list the weights we have been using in the last few years. The values for CCD observations of Tables 8 and 9 are largely from Chesley et al. (2010), with some ad hoc additions based on our experience. The precedence rule is the following: Table 9 has priority over Tables 6 and 7. Table 8, which in turn has priority over Note that Chesley et al. (2010) adjust the CCD weights by applying their so-called “safety factor” of 2 to the reported values to provide a more realistic ephemeris uncertainty, i.e., with a prediction error distribution closer to a theoretical normal distribution.
| Date | ||
|---|---|---|
| 3.0” | 3.0” | |
| 1890–1950 | 2.0” | 2.0” |
| 1.5” | 1.5” |
| Type | Type | ||||
|---|---|---|---|---|---|
| C, c, n, V, S | 1.0” | 1.0” | M | 3” | 3” |
| H | 0.4” | 0.4” | T | 0.5” | 0.5” |
| E | 0.2” | 0.2” | e | 0.75” | 0.75” |
| Catalog | Catalog | ||||
|---|---|---|---|---|---|
| c, d | 0.51” | 0.40” | m | 0.56” | 0.57” |
| e, q, r, u | 0.33” | 0.30” | w | 0.44” | 0.36” |
| o, s | 0.50” | 0.41” | f, g | 0.73” | 0.64” |
| a, b | 0.59” | 0.51” | L, t | 0.25” | 0.25” |
| h, i, j, z | 0.45” | 0.44” |
| Station | Catalog | Station | Catalog | ||||
|---|---|---|---|---|---|---|---|
| 704 | c, d | 0.62” | 0.60” | 608 | c, d | 0.63” | 0.77” |
| 644 | c, d | 0.24” | 0.28” | 644 | o, s | 0.18” | 0.17” |
| 703 | c, d | 0.62” | 0.57” | 703 | e, r | 0.49” | 0.46” |
| 699 | c, d | 0.47” | 0.39” | 699 | o, s | 0.42” | 0.41” |
| 691 | c, d | 0.32” | 0.34” | 691 | o, s | 0.25” | 0.28” |
| G96 | e, r | 0.25” | 0.21” | E12 | e, r | 0.41” | 0.43” |
| F51 | L | 0.15” | 0.15” | H01 | t, L | 0.15” | 0.15” |
| 568 | t | 0.13” | 0.13” | 568 | L | 0.15” | 0.15” |
| 568 | o, s | 0.25” | 0.25” | 673 | All | 0.30” | 0.30” |
| 683 | e, r | 0.61” | 0.78” | 645 | e | 0.15” | 0.15” |
| 689 | g | 0.26” | 0.32” | 250 | All | 1.30” | 1.30” |
| C51 | All | 1.00” | 1.00” |
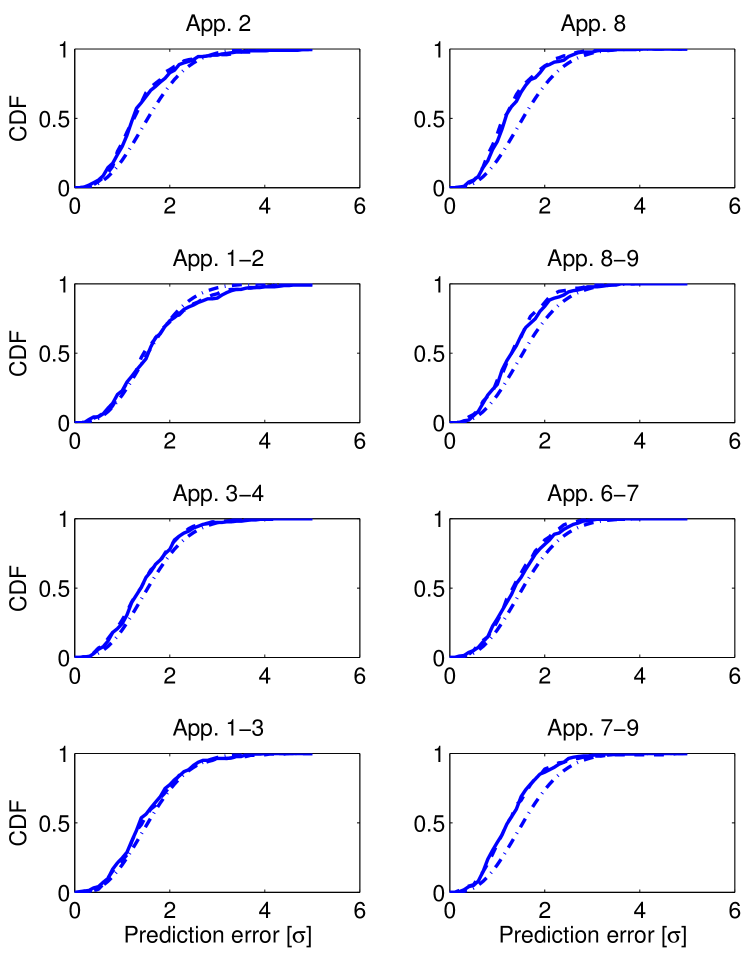
Carpino et al. (2003), Chesley et al. (2010), and Baer et al. (2011) show that asteroid astrometric errors can be correlated, especially for same-station observations closely spaced in time. The presence of correlations is not a surprise since still unresolved systematic errors, such as timing errors, result in correlations. To mitigate the effect of unresolved systematic errors and correlations we relax the weights, especially when there are many observations from the same station on the same night (which we call a batch of observations). Our strategy is to apply a scale factor to each weight, where is the number of observations contained in a single-station batch. We consider as a batch a sequence of observations from the same station with a time gap smaller than 8 hours between two consecutive observations. For CCD observations, which have a typical batch of 3–5 observations, this scale factor is close to the safety factor of 2 suggested by Chesley et al. (2010). The better handles the cases with a large number of observations in a batch and avoids down-weighting batches with a lower number of observations. Moreover, this scale factor is applied to all types of observations thus mitigating possible correlations for, e.g., old photographic observations.
To validate the new weighting scheme we performed a test similar to that of Sec. 4.3. In this case we used two different weighting schemes: the one with a safety factor of 2 and the one that scales by . Figure 23 shows the prediction error cumulative distributions for both schemes. The two weighting schemes give very similar results and they both appear to be coarse as they give uncertainties larger than theoretically expected. A deeper analysis of the data weights is beyond the scope of this paper, but we plan to address this issue in the future.
6 Discussion
Developing a reliable statistical error model for asteroid astrometric observations is a complicated task. In this paper we give a significant contribution by computing star position and proper motion corrections.
The selection of a reference star catalog was not obvious. We selected the subset of PPMXL corresponding to 2MASS based stars, therefore inheriting the good accuracy of 2MASS stars and adding proper motion information. We decided not to use the whole PPMXL catalog because more than 50% of its star positions are derived from USNO-B1.0 and are not as accurate as desirable. The USNO-B1.0 based stars in PPMXL can also affect asteroid observations reduced with PPMXL. These observations cannot be corrected unless we select a reference catalog independent from PPMXL. A possible solution would be that observers select 2MASS based stars from PPMXL. However, this approach would result in an inhomogeneous dataset of PPMXL based astrometry, unless the corresponding observations are flagged with a separate MPC catalog code.
Teixeira et al. (2013) question the reliability of proper motions in some of the main astrometric catalogs, including PPMXL. Although we acknowledge that this problem has to be fixed, our goal is to improve the current treatment of asteroid astrometry. The tests discussed in this paper show that including our position and proper motion corrections provide better predictions and better orbital fit statistics. As soon as the GAIA star catalog (Perryman et al., 2001) is available, we will have a much more reliable reference catalog to refine our debiasing scheme.
Finally, we presented a data weight scheme to update and somehow generalize that suggested by Chesley et al. (2010). In particular, to properly mitigate the possible effect of correlated observation errors, we now account for the number of observations present in a single batch and scale the data weights accordingly. Since this scheme still is quite coarse, future work will include a detailed statistical analysis of the observation errors to produce a more accurate data weighting scheme.
Acknowledgments
We are grateful to D. G. Monet and M. Micheli for several discussions that helped in improving the paper. We also thank B. J. Gray, Ž. Ivezić, G. Landais, O. Maliy, B. J. McLean, P. A. Ries, S. Roeser, S. Urban, P. R. Weissman, and G. V. Williams for providing us with some of the catalogs and other useful information.
This research made use of the VizieR catalogue access tool, CDS, Strasbourg, France (Ochsenbein et al., 2000).
Part of this research was conducted at the Jet Propulsion Laboratory, California Institute of Technology, under a contract with NASA.
Copyright 2014 California Institute of Technology.
References
- Abazajian et al. (2009) Abazajian, K. N., and 203 colleagues 2009. The Seventh Data Release of the Sloan Digital Sky Survey. The Astrophysical Journal Supplement Series 182, 543-558.
- Baer et al. (2011) Baer, J., Chesley, S. R., Milani, A. 2011. Development of an observational error model. Icarus 212, 438-447.
- Carpino et al. (2003) Carpino, M., Milani, A., Chesley, S. R. 2003. Error statistics of asteroid optical astrometric observations. Icarus 166, 248-270.
- Chesley et al. (2003) Chesley, S. R., Ostro, S. J., Vokrouhlický, D., Čapek, D., Giorgini, J. D., Nolan, M. C., Margot, J.-L., Hine, A. A., Benner, L. A. M., Chamberlin, A. B. 2003. Direct Detection of the Yarkovsky Effect by Radar Ranging to Asteroid 6489 Golevka. Science 302, 1739-1742.
- Chesley et al. (2010) Chesley, S. R., Baer, J., Monet, D. G. 2010. Treatment of star catalog biases in asteroid astrometric observations. Icarus 210, 158-181.
- Chesley et al. (2014) Chesley, S. R., and 15 colleagues 2014. Orbit and bulk density of the OSIRIS-REx target Asteroid (101955) Bennu. Icarus 235, 5-22.
- Copenhagen University et al. (2006) Copenhagen University, O., Institute, A. O., Cambridge, Uk, Real Instituto Y Observatorio de La Armada, F. E. S. 2006. Carlsberg Meridian Catalog 14 (CMC14) (CMC, 2006).. VizieR Online Data Catalog 1304, 0.
- Farnocchia et al. (2013) Farnocchia, D., Chesley, S. R., Chodas, P. W., Micheli, M., Tholen, D. J., Milani, A., Elliott, G. T., Bernardi, F. 2013. Yarkovsky-driven impact risk analysis for asteroid (99942) Apophis. Icarus 224, 192-200.
- Górski et al. (2005) Górski, K. M., Hivon, E., Banday, A. J., Wandelt, B. D., Hansen, F. K., Reinecke, M., Bartelmann, M. 2005. HEALPix: A Framework for High-Resolution Discretization and Fast Analysis of Data Distributed on the Sphere. The Astrophysical Journal 622, 759-771.
- Hodapp et al. (2004) Hodapp, K. W., and 30 colleagues 2004. Design of the Pan-STARRS telescopes. Astronomische Nachrichten 325, 636-642.
- Høg et al. (2000) Høg, E., Fabricius, C., Makarov, V. V., Urban, S., Corbin, T., Wycoff, G., Bastian, U., Schwekendiek, P., Wicenec, A. 2000. The Tycho-2 catalogue of the 2.5 million brightest stars. Astronomy and Astrophysics 355, L27-L30.
- Lasker et al. (1996) Lasker, B. M., Russell, J. L., Jenkner, H., Sturch, C. R., McLean, B. J., Shara, M. M. 1996. The HST Guide Star Catalog, Version 1.1 (Lasker+ 1992). VizieR Online Data Catalog 1220, 0.
- Lasker et al. (1999) Lasker, B. M., Russell, J. L., Jenkner, H. 1999. The HST Guide Star Catalog, Version GSC-ACT. VizieR Online Data Catalog 1255, 0.
- Law et al. (2009) Law, N. M., and 40 colleagues 2009. The Palomar Transient Factory: System Overview, Performance, and First Results. Publications of the Astronomical Society of the Pacific 121, 1395-1408.
- Milani and Gronchi (2010) Milani, A., Gronchi, G. 2010. Theory of Orbit Determination. Theory of Orbit Determination, by Andrea Milani , Giovanni Gronchi, Cambridge, UK: Cambridge University Press, 2010.
- Milani et al. (2012) Milani, A., and 11 colleagues 2012. Identification of known objects in Solar System surveys. Icarus 220, 114-123.
- Monet (1996) Monet, D. 1996. The 491,848,883 Sources in USNO-A1.0. Bulletin of the American Astronomical Society 28, 905.
- Monet (1998) Monet, D. G. 1998. The 526,280,881 Objects In The USNO-A2.0 Catalog. Bulletin of the American Astronomical Society 30, #120.03.
- Monet et al. (2003) Monet, D. G., and 28 colleagues 2003. The USNO-B Catalog. The Astronomical Journal 125, 984-993.
- Morrison et al. (2001) Morrison, J. E., Roeser, S., McLean, B., Bucciarelli, B., Lasker, B. 2001. The Guide Star Catalog, Version 1.2: An Astrometric Recalibration and Other Refinements. The Astronomical Journal 121, 1752-1763.
- Ochsenbein et al. (2000) Ochsenbein, F., Bauer, P., Marcout, J. 2000. The VizieR database of astronomical catalogues. Astronomy and Astrophysics Supplement Series 143, 23-32.
- Perryman et al. (1997) Perryman, M. A. C., and 19 colleagues 1997. The HIPPARCOS Catalogue. Astronomy and Astrophysics 323, L49-L52.
- Perryman et al. (2001) Perryman, M. A. C., de Boer, K. S., Gilmore, G., Høg, E., Lattanzi, M. G., Lindegren, L., Luri, X., Mignard, F., Pace, O., de Zeeuw, P. T. 2001. GAIA: Composition, formation and evolution of the Galaxy. Astronomy and Astrophysics 369, 339-363.
- Roeser and Bastian (1991) Roeser, S., Bastian, U. 1991. PPM Star Catalogue. Positions and proper motions of 181731 stars north of -2.5 degrees declination for equinox and epoch J2000.0. Vol. I: Zones +80 to +30. Vol. II: Zones +20 to -0., by Roeser, S.; Bastian, U.. Spektrum, Akademischer Verlag, Heidelberg (Germany, F.R.), 1991, 1850 p., ISBN 3-86025-000-0, A publication of the Astronomisches Rechen-Institut Heidelberg.
- Roeser et al. (2010) Roeser, S., Demleitner, M., Schilbach, E. 2010. The PPMXL Catalog of Positions and Proper Motions on the ICRS. Combining USNO-B1.0 and the Two Micron All Sky Survey (2MASS). The Astronomical Journal 139, 2440-2447.
- STScI (2001) Space Telescope Science Institute, Osservatorio Astronomico di Torino, 2001. The Guide Star Catalog, Version 2.2 (GSC2.2) (STScI, 2001). VizieR Online Data Catalog 1271, 0.
- Skrutskie et al. (2006) Skrutskie, M. F., and 30 colleagues 2006. The Two Micron All Sky Survey (2MASS). The Astronomical Journal 131, 1163-1183.
- Spagna et al. (2006) Spagna, A., and 11 colleagues 2006. The Guide Star Catalog II. Properties of the GSC 2.3 release. Memorie della Societa Astronomica Italiana 77, 1166.
- Teixeira et al. (2013) Teixeira, R., Galli, P. A. B., Le Campion, J. F., Fidencio, M., Benevides-Soares, P., Ferreira, A. C. S., Ducourant, C., Krone-Martins, A. G. O. 2013. Astrometric catalogs: be careful! RevMexAA (Serie de Conferencias) 43, 55-58.
- Tholen et al. (2013a) Tholen, D. J., Micheli, M., Elliott, G. T. 2013a. Improved astrometry of (99942) Apophis. Acta Astronautica 90, 56-71.
- Tholen et al. (2013b) Tholen, D. J., Micheli, M., Elliott, G. T. 2013b. The effect of proper motion on Pan-STARRS asteroid astrometry. Icarus 223, 625-627.
- Urban et al. (1998) Urban, S. E., Corbin, T. E., Wycoff, G. L. 1998. The ACT Reference Catalog. The Astronomical Journal 115, 2161-2166.
- Zacharias et al. (2000) Zacharias, N., and 11 colleagues 2000. The First US Naval Observatory CCD Astrograph Catalog. The Astronomical Journal 120, 2131-2147.
- Zacharias et al. (2004a) Zacharias, N., Monet, D. G., Levine, S. E., Urban, S. E., Gaume, R., Wycoff, G. L. 2004a. The Naval Observatory Merged Astrometric Dataset (NOMAD). Bulletin of the American Astronomical Society 36, 1418.
- Zacharias et al. (2004b) Zacharias, N., Urban, S. E., Zacharias, M. I., Wycoff, G. L., Hall, D. M., Monet, D. G., Rafferty, T. J. 2004b. The Second US Naval Observatory CCD Astrograph Catalog (UCAC2). The Astronomical Journal 127, 3043-3059.
- Zacharias et al. (2010) Zacharias, N., and 29 colleagues 2010. The Third US Naval Observatory CCD Astrograph Catalog (UCAC3). The Astronomical Journal 139, 2184-2199.
- Zacharias et al. (2013) Zacharias, N., Finch, C. T., Girard, T. M., Henden, A., Bartlett, J. L., Monet, D. G., Zacharias, M. I. 2013. The Fourth US Naval Observatory CCD Astrograph Catalog (UCAC4). The Astronomical Journal 145, 44.