Sternwartstraße 7, 96049 Bamberg, Germany 33institutetext: Crimean Astrophysical Observatory, 298409 Nauchny, Crimea, Russia 44institutetext: Department of Astronomy, Kyoto University, Kitashirakawa-Oiwake-cho, Sakyo-ku, Kyoto 606-8502, Japan 55institutetext: Fujii Kurosaki Observatory, 4500 Kurosaki, Tamashima, Kurashiki, Okayama 713-8126, Japan 66institutetext: 67 Rue Jacques Daviel, Rouen 76100, France 77institutetext: Observatoire de la Tourbière, 38690 Chabons, France 88institutetext: Balmes 2, 08784 PIERA, Barcelona, Spain 99institutetext: 1833 Bobwhite Dr. Ammon, Idaho, USA 83401 1010institutetext: Castanet Tolosan Observatory, 6 Place Clemence Isaure, 31320 Castanet Tolosan, France 1111institutetext: Lieu-dit Durfort, 81150 Fayssac, France 1212institutetext: 6 rue Virgile, 42100 Saint-Etienne, France 1313institutetext: Chelles Observatory, 23 avenue hénin, 77500 Chelles, France 1414institutetext: Durtal Observatory, 6 rue des Glycines, 49430 Durtal, France 1515institutetext: Mirranook Observatory, Boorolong Rd Armidale, NSW, Australia 2350 1616institutetext: Societe Astronomique de Bourgogne-Dijon, France 1717institutetext: 23746 Schoolhouse Road, Manhattan, Illinois, USA 60442
Early evolution of the extraordinary Nova Del 2013 (V339 Del) ††thanks: Based on data collected by amateur astronomers
Abstract
Aims. We determine the temporal evolution of the luminosity (), radius () and effective temperature () of the white dwarf (WD) pseudophotosphere of V339 Del from its discovery to around day 40. Another main objective was studying the ionization structure of the ejecta.
Methods. These aims were achieved by modelling the optical/near-IR spectral energy distribution (SED) using low-resolution spectroscopy (3500–9200 Å), and photometry. Important insights in the physical conditions of the ejecta were gained from an analysis of the evolution of the H and Raman-scattered 6825 Å O vi line using medium-resolution spectroscopy ().
Results. During the fireball stage (Aug. 14.8–19.9, 2013), was in the range of 6000–12000 K, was expanding non-uniformly in time from 66 to 300 , and was super-Eddington, but not constant. Its maximum of 9 occurred around Aug. 16.0, at the maximum of , half a day before the visual maximum. After the fireball stage, a large emission measure of cm-3 constrained the lower limit of to be well above the super-Eddington value. The mass of the ionized region was a few , and the mass-loss rate was decreasing from 5.7 (Aug. 22) to 0.71 (Sept. 20). The evolution of the H line and mainly the transient emergence of the Raman-scattered O vi 1032 Å line suggested a biconical ionization structure of the ejecta with a disk-like H i region persisting around the WD until its total ionization, around day 40. On Sept. 20 (day 35), the model SED indicated a dust emission component in the spectrum. The dust was located beyond the H i zone, where it was shielded from the hard, K, radiation of the burning WD at that time.
Conclusions. Our extensive spectroscopic observations of the classical nova V339 Del allowed us to map its evolution from the very early phase after its explosion. It is evident that the nova was not evolving according to the current theoretical prediction. The unusual non-spherically symmetric ejecta of nova V339 Del and its extreme physical conditions and evolution during and after the fireball stage represent interesting new challenges for the theoretical modelling of the nova phenomenon.
Key Words.:
Stars: novae, cataclysmic variables – Stars: fundamental parameters – Stars: individual: V339 Del1 Introduction
According to the first report on Nova Delphini 2013 (PNV J20233073+2046041, V339 Del), announced by the Central Bureau Electronic Telegram No. 3628, the nova was discovered by Koichi Itagaki on 2013 Aug. 14.584 UT at the unfiltered brightness of 6.8 mag, and its progenitor was identified by Denisenko et al. as the blue star USNO-B1.0 1107-0509795 (, ). First optical spectra were obtained on 2013 Aug. 14.844 by observers participating in the Astronomical Ring for Access to Spectroscopy (ARAS) project111 http://www.astrosurf.com/aras/ArasDataBase/Novae/Nova-Del-2013.htm (Shore et al. 2013a) and by Darnley et al. (2013) on 2013 Aug. 14.909.
A first description of the multicolour optical photometry was provided by Munari et al. (2013a). They estimated the peak brightness of V339 Del to , reached at Aug. 16.44 UT, that is, days after its discovery. An increase of the observed colour index from to between Aug. 15.0 and 19.2 (see Fig. 2 of Munari et al. 2013a) corresponded to a change of the spectral type of the expanding envelope from A2 to F8 (cf. Cox 2000). The following gradual decrease of the index after Aug. 20 suggested a dramatic change of the optical spectrum of the nova.
Spectroscopic observations during this early stage of the nova evolution were consistent with its photometric behaviour. Tarasova & Shakhovskoi (2013) reported that the spectral energy distribution (SED) of their pre-maximum spectrum, taken on Aug. 15.8, was similar to a late-A or early-F-type spectrum. The line spectrum, which was dominated by P Cyg-type hydrogen lines with a pronounced absorption component (see Darnley et al. 2013; Shore et al. 2013a; Tomov et al. 2013; Tarasova 2013; Munari et al. 2013b), also suggested that the effective temperature of the envelope probably is K. During Aug. 19, Darnley & Bode (2013) observed a significant weakening of the H i absorption components, while those of the Fe ii, He i, and O i profiles were still clearly present. This evolution indicated a distinctive cooling of the expanding envelope. In the continuum, the temperature decrease was manifested by a flattening of the optical SED almost without traces of the Balmer jump, as observed by Tarasova & Shakhovskoi (2013) on Aug. 19.9. This behaviour signalized the end of the early optically thick phase (also called the fireball or iron-curtain stage, see Shore 2008), when the expanding shell transfers the inner energetic photons to its optically thick/thin interface. When the nova shell reaches a maximum radius, the optical depth of its outer parts starts to decrease, and the WD pseudophotosphere progressively shrinks and becomes hotter. As a result, the spectrum significantly changes in both the continuum and lines, shifting the maximum of its SED to shorter wavelengths. For nova V339 Del this transition occurred during Aug. 20–22, as described by Shore et al. (2013b).
In this paper we describe the evolution of the fundamental parameters, , , and of nova V339 Del from its detection to the onset of a stage with a harder spectrum (around day 40, when the first significant X-ray flux occurred). We note that the Raman-scattered 6825 Å line was observed for the first time in the spectrum of a classical nova, while it is commonly identified only for symbiotic systems. The variation of the H and Raman 6825 Å line profiles allowed us to determine the ionization structure of the ejecta during this early period of the nova evolution. Section 3 presents the results, which are interpreted and summarized in Sects. 4 and 5.
2 Observations
Spectroscopic observations of V339 Del were secured at different observatories and/or private stations:
(i) At the the Crimean Astrophysical Observatory with the 2.6 m Shajn telescope, using a SPEM spectrograph in the Nasmith focus; the detector was a SPEC-10 CCD camera (1340100 pixel).
(ii) At the Fujii Kurosaki Observatory with a 0.4 m SCT F10 (Meade) telescope, using a FBSPEC-III spectrograph and a CCD camera ML6303E(FLI) (30722048 pixel) as the detector.
(iii) At the Observatory de la Tourbière with a 0.355 m Schmidt-Cassegrain telescope (Celestron C14) equipped with an eShel spectrograph (Shelyak; optical fiber of 50 m) mounted at the f/d7 focus. The detector was an ATIK 460EX CCD camera (pixel size of 4,54 m, binning 22 mode; pixel of 9.08 m).
(iv) At the Santa Maria de Montmagastrell Observatory, Tàrrega (Lleida) Spain, using a Control Remote Telescope SC16 equipped with a spectrograph B60050-VI; the detector was an ATIK 460EX CCD camera.
(v) At a private station in Idaho Falls with a 0.35 m Celestron C14 telescope, using a LISA spectrograph from Shelyak Instruments; the detector was an ATIK 460E CCD camera.
(vi) At the Castanet Tolosan Observatory with a 0.2 m F4 Newton telescope, using the eShel model of the echelle spectrograph (Shelyak) and a CCD camera ATIK 640EX. On Oct. 1.923 2013, a 0.28 m F6 SCT telescope was used.
(vii) At the private station Fayssac with a 0.25 m telescope, using the Alpy 600 spectrograph (Shelyak) in the Newton focus; the detector was an ATIK 314L CCD camera.
(viii) At the Observatoire du Pilat, with a 0.25 m LX200 (Meade) telescope, using the Alpy 600 spectrograph (Shelyak); the detector was SBIG ST-8300 CCD camera wit a Kodak KAF 8300 chip.
(ix) At the private station Chelles, with a 0.35 m SCT F11 (Celestron) telescope, using the eShell cross-dispersed echelle spectrograph (Shelyak) and a CCD camera ATIK 460EX with ICX694 (Sony) sensor.
(ix) At the Durtal Observatory with a 0.51 m F/5 telescope, using the eShel model of the echelle spectrograph (Shelyak); the detector was a KAF-3200ME CCD camera.
(x) At the Mirranook Observatory with a 0.25 m F6.4 SCT (Celestron) telesope, using a LISA spectrograph (Shelyak); the detector was an ATIK 314L CCD camera with a 23 m slit.
(xi) At the private station of the Societe Astronomique de Bourgogne-Dijon with a 0.2 m telescope (Celestron) using a LISA spectrograph (Shelyak); the detector was an ATIK 314L CCD camera.
(xii) At the private stations, Manhattan (Illinois) and Grand Lake (Colorado) by a 0.25 m LX200 SCT telescope using the Alpy 600 spectrograph (Shelyak). The detector was an ATIK 314L CCD camera.
For the purpose of modelling the SED we used low-resolution spectra (, Table 1), while the medium-resolution spectra ( 10000, Table 2) served to analyse variations in the line profiles. Relative flux units were converted into absolute fluxes with the aid of the (near-)simultaneous photometry of Munari et al. (2013a) and/or photometry from the AAVSO database. Magnitudes were converted to fluxes according to the calibration of Henden & Kaitchuck (1982). Observations were dereddened with = 0.18 (Munari et al. 2013b; Shore et al. 2013c; Chochol et al. 2014) by using the extinction curve of Cardelli et al. (1989). Then we scaled the dereddened spectra to the flux-point.
We selected only spectra with a good match at all available photometric flux-points, but especially in the band. The measured photometric magnitudes were corrected for emission lines to obtain fluxes of the true continuum (see Skopal 2007). Some spectra showed an excess or depression for Å. They were not used in our analysis, because the continuum profile sensitively depends on the effective temperature of the shell – the primary parameter of our SED-fitting analysis (Sect. 3.1).
We also used near-IR photometry of nova V339 Del as published by Burlak et al. (2013), Gehrz et al. (2013), Cass et al. (2013a, b) and Shenavrin et al. (2013). Resulting parameters were scaled to a distance of 3 kpc (Chochol et al. 2014).
| Day1 | Julian date | Region | R2 | Observer | |
|---|---|---|---|---|---|
| 2013 Aug. | JD 2 4565.. | [nm] | [s] | ||
| 14.905 | 19.405 | 373–742 | 623 | 754 | Guarro |
| 14.934 | 19.434 | 373–743 | 623 | 771 | Guarro |
| 14.972 | 19.472 | 372–743 | 528 | 755 | Guarro |
| 15.004 | 19.504 | 371–743 | 423 | 741 | Guarro |
| 15.483 | 19.983 | 355–950 | 300 | 500 | Fujii-san |
| 15.496 | 19.996 | 380–730 | 1778 | 1306 | Bohlsen |
| 15.634 | 20.134 | 355–950 | 300 | 500 | Fujii-san |
| 15.804 | 20.304 | 333–758 | 10 | 1000 | Tarasova |
| 15.869 | 20.369 | 371–729 | 791 | 675 | Terry |
| 15.996 | 20.496 | 371–743 | 370 | 784 | Guarro |
| 16.198 | 20.698 | 372–757 | 773 | 712 | Edlin |
| 16.470 | 20.970 | 355–960 | 300 | 500 | Fujii-san |
| 16.512 | 21.012 | 355–960 | 240 | 500 | Fujii-san |
| 16.553 | 21.053 | 355–960 | 240 | 500 | Fujii-san |
| 16.595 | 21.095 | 355–960 | 240 | 500 | Fujii-san |
| 16.637 | 21.137 | 355–960 | 220 | 500 | Fujii-san |
| 16.740 | 21.240 | 355–960 | 400 | 500 | Fujii-san |
| 16.885 | 21.385 | 371–729 | 3193 | 682 | Terry |
| 16.950 | 21.450 | 379–722 | 1914 | 912 | Favaro |
| 17.134 | 21.634 | 375–700 | 720 | 514 | Graham |
| 17.265 | 21.765 | 375–740 | 747 | 884 | Edlin |
| 17.473 | 21.973 | 355–960 | 400 | 500 | Fujii-san |
| 17.543 | 22.043 | 355–960 | 400 | 500 | Fujii-san |
| 17.710 | 22.210 | 355–960 | 400 | 500 | Fujii-san |
| 17.898 | 22.398 | 361–738 | 3854 | 513 | Antao |
| 18.189 | 22.689 | 367–740 | 2331 | 758 | Edlin |
| 18.456 | 22.956 | 355–960 | 280 | 500 | Fujii-san |
| 18.520 | 23.020 | 355–960 | 300 | 500 | Fujii-san |
| 18.585 | 23.085 | 355–960 | 220 | 500 | Fujii-san |
| 18.873 | 23.373 | 365–735 | 2061 | 513 | Antao |
| 18.943 | 23.443 | 365–735 | 2031 | 513 | Antao |
| 19.151 | 23.651 | 375–739 | 773 | 938 | Edlin |
| 19.480 | 23.980 | 355–960 | 260 | 500 | Fujii-san |
| 19.550 | 24.050 | 355–960 | 200 | 500 | Fujii-san |
| 19.849 | 24.349 | 368–743 | 327 | 760 | Guarro |
| 19.887 | 24.387 | 333–757 | 10 | 1000 | Tarasova |
| 21.691 | 26.191 | 365–929 | 91 | 500 | Fujii-san |
| 21.822 | 26.322 | 368–735 | 1367 | 591 | Thizy |
| 26.161 | 30.661 | 360–740 | 398 | 503 | Graham |
| 28.477 | 32.977 | 355–960 | 91 | 500 | Fujii-san |
| Sept. | |||||
| 13.536 | 49.036 | 355–960 | 96 | 500 | Fujii-san |
| 13.748 | 49.248 | 333–757 | 10 | 1000 | Tarasova |
| 20.542 | 56.042 | 355–960 | 400 | 500 | Fujii-san |
| 20.864 | 56.364 | 663–1020 | 4310 | 1085 | Guarro |
1 mid of observation in UT, 2 average resolution
| Day2) | JD | Region3) | Observer | ||
|---|---|---|---|---|---|
| Aug. | 2 4565.. | [nm] | [s] | ||
| 14.844 | 19.344 | 418–732 | 3636 | 9.75) | Garde |
| 14.885 | 19.385 | 418–732 | 3349 | 10.05) | Garde |
| 14.985 | 19.485 | H | 3683 | 11.9 | Garde |
| 15.027 | 19.527 | H | 3624 | 12.7 | Garde |
| 15.062 | 19.562 | H | 2422 | 13.4 | Garde |
| 15.850 | 20.350 | H | 3180 | 32.1 | Garde |
| 15.885 | 20.385 | H | 2840 | 32.9 | Garde |
| 15.885 | 20.385 | Raman | 2840 | 29.3 | Garde |
| 16.910 | 21.410 | H | 3830 | 55.5 | Garde |
| 16.910 | 21.410 | Raman | 3830 | 49.6 | Garde |
| 17.842 | 22.342 | H | 4263 | 49.0 | Garde |
| 17.967 | 22.467 | Raman | 4263 | 47.4 | WR13x6) |
| 18.044 | 22.544 | H | 3074 | 48.9 | Garde |
| 18.913 | 23.413 | H | 622 | 48.7 | Lemoult |
| 19.050 | 23.550 | Raman | 900 | 45.2 | WR13x |
| 19.050 | 23.550 | H | 900 | 48.7 | WR13x |
| 19.870 | 24.370 | H | 2877 | 49.0 | Lemoult |
| 19.870 | 24.370 | Raman | 2877 | 47.0 | Lemoult |
| 20.051 | 24.551 | H | 438 | 49.0 | WR13x |
| 20.840 | 25.340 | Raman | 3659 | 34.7 | Garde |
| 21.876 | 26.376 | Raman | 4027 | 25.5 | Buil |
| 22.854 | 27.354 | Raman | 4575 | 21.5 | Garde |
| 23.845 | 28.345 | Raman | 4921 | 19.0 | Garde |
| 24.979 | 29.479 | Raman | 3618 | 17.1 | Buil |
| 26.828 | 31.328 | Raman | 6040 | 13.1 | Garde |
| 28.849 | 33.349 | H | 4546 | 13.9 | Buil |
| Sept. | |||||
| 01.881 | 37.381 | Raman | 2565 | 7.81 | Charbonnel |
| 05.955 | 41.455 | Raman | 827 | 6.02 | WR13x |
| 10.840 | 46.340 | Raman | 2350 | 5.34 | Charbonnel |
| 21.825 | 57.325 | Raman | 6060 | 3.74 | Garde |
| 22.858 | 58.358 | Raman | 2458 | 3.45 | Buil |
| Oct. | |||||
| 01.923 | 67.423 | Raman | 4555 | 1.10 | Buil |
the average resolving power was 10000–11000, mid of observation in UT, the used wavelength range, the continuum flux at the H or the Raman 6825 Å line in , 5) at the H line, WR13x-collaboration team


3 Analysis and results
The primary aim of this section is to match the observed SED in our spectra by an appropriate model, and in this way determine the physical parameters of the emitting region at a given time of the nova evolution.
3.1 Model SEDs
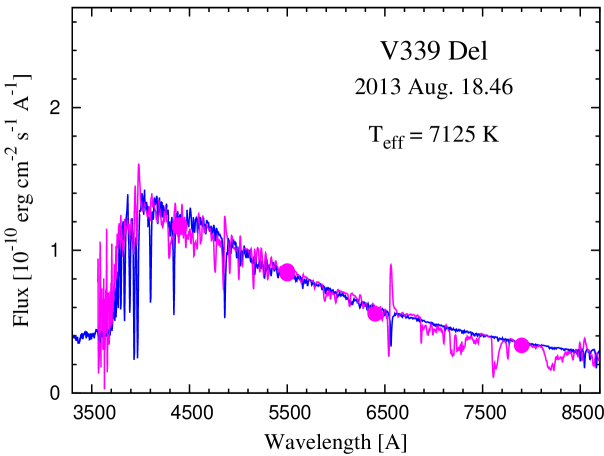
During the fireball stage of novae, the radiation of their pseudophotospheres resembles that produced by a star of spectral type A to F (e.g. Warner 2008, Sect. 1 here). Accordingly, we compared the observed spectrum, , with a synthetic one, , i.e.
| (1) |
where is the angular radius of the WD pseudophotosphere and its effective temperature. Fitting parameters are and , which define the effective radius of the shell as and its luminosity for the distance to the nova, . A warm photospheric radiation of the nova was indicated already by our first spectrum from Aug. 14.844. The last spectrum showing unambiguously a dominant contribution from the warm stellar pseudophotosphere in the optical was observed on Aug. 19.887. Therefore, we associate this date with the end of the fireball stage of the nova V339 Del (see also Sect. 4.2.3).
In the SED-fitting analysis we compared a grid of synthetic models with the observed spectrum (1) and selected the one corresponding to a minimum of the reduced function. The continuum fluxes were estimated by eye. In this way we obtained the model variables and . The grid of atmospheric models was prepared from that of Munari et al. (2005), for K with the step K and fixed other atmospheric parameters. The model resolution was accommodated to that of our spectra (see Skopal et al. 2011, for more details).
After the fireball stage, during the transition of the nova towards higher , its radiation ionizes the outer material, which reprocesses a fraction of it into the nebular emission. As a result, the nebular component of radiation starts to rival the stellar component from the WD pseudophotosphere in the optical/near-IR. Because of its higher , we observe only its long-wavelength tail in the optical, which can be approximated by a blackbody radiating at the temperature . In this case, the observed spectrum can be expressed as
| (2) |
where the factor scales the total volume emission coefficient of the nebular continuum to observations; is the so-called emission measure. The variables determining the model SED (2) are , , and . Equation (2) assumes that and thus are constant throughout the nebula. For the sake of simplicity, we considered only the contribution of the hydrogen plasma (see e.g. Skopal 2015a, for more details). The first spectrum that could be matched by a superposition of just these two components of radiation was observed on Aug. 26.16.
Our spectra taken during the first few days after the fireball stage indicated a persisting contribution from the warm stellar pseudophotosphere. This is evident from the spectra of Aug. 20.194 (J. Edlin, ARAS), 20.463, 21.691 (M. Fujii222 http://otobs.org/FBO/fko/nova/novadel2013.htm), and 21.822 (O. Thizy, ARAS). They showed a steeper short-wavelength part of the spectrum for Å and a flat continuum at a high level of a few times for Å. The former indicates the presence of a hotter stellar component of radiation, while the latter is given by superposition of a nebular component and that from the warm pseudophotosphere. Therefore, we matched the observed SED in this transition phase by radiation components according to Eq. (2) supplemented by a synthetic spectrum for K (see Sect. 3.2.2).
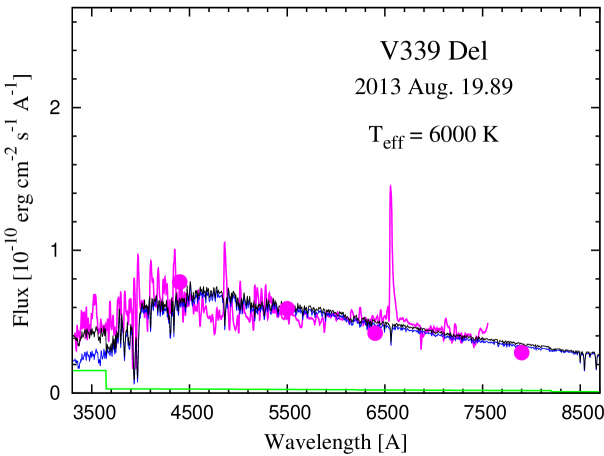
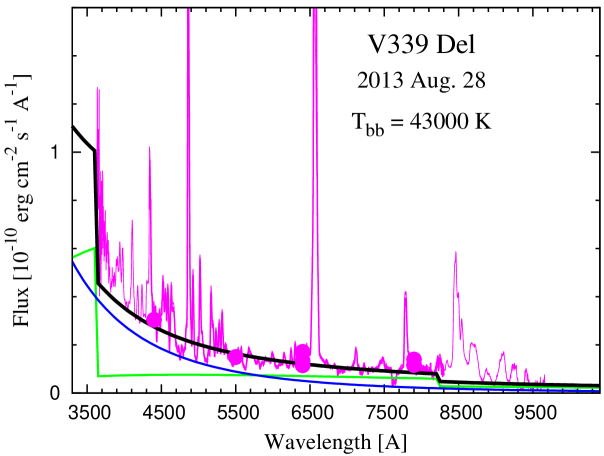
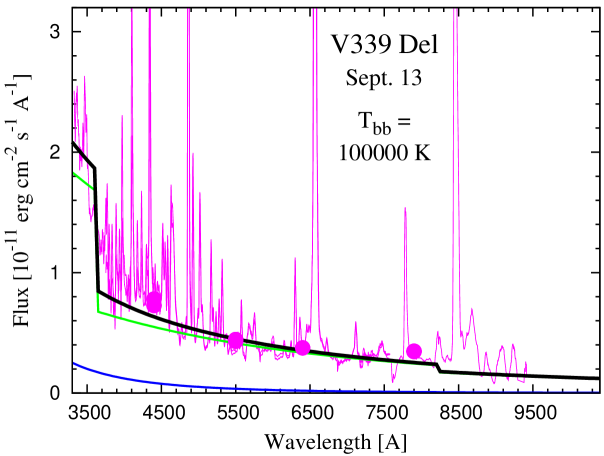
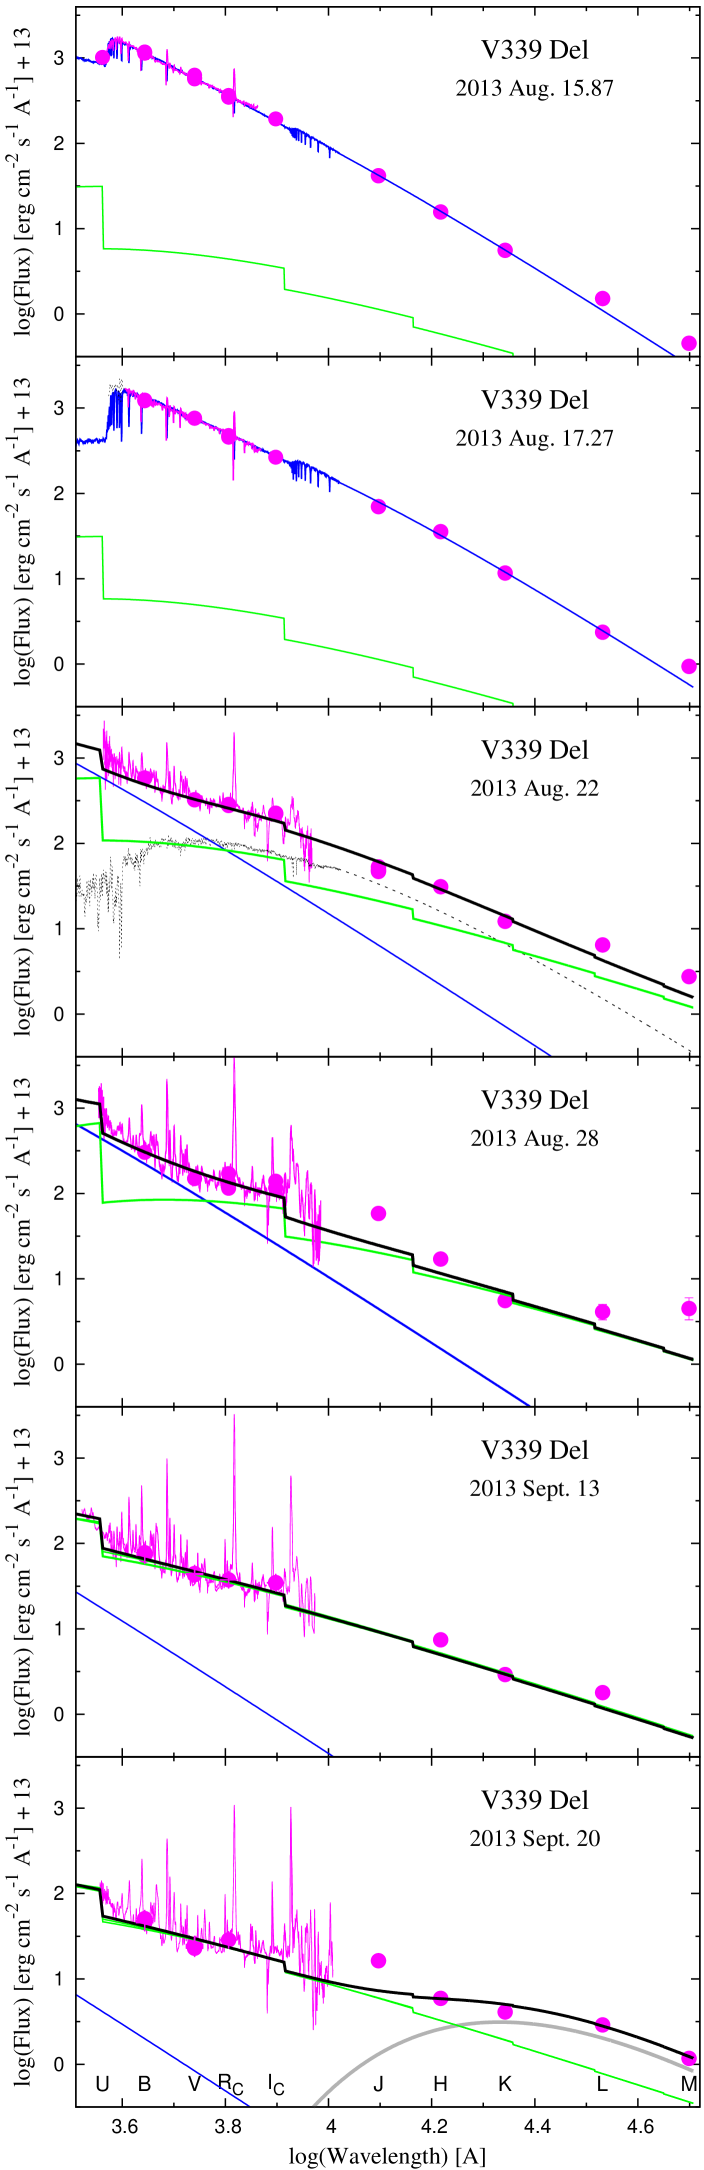
Modelling the SED after the fireball stage is only unambiguous if we use data covering a broad spectral region. We used the spectra of Aug. 22, 28, Sept. 13, and 20, which cover a more extended wavelength region and were obtained simultaneously with the photometric near-IR observations. The near-IR fluxes are especially important to recognize the dust contribution (see Fig. 2).
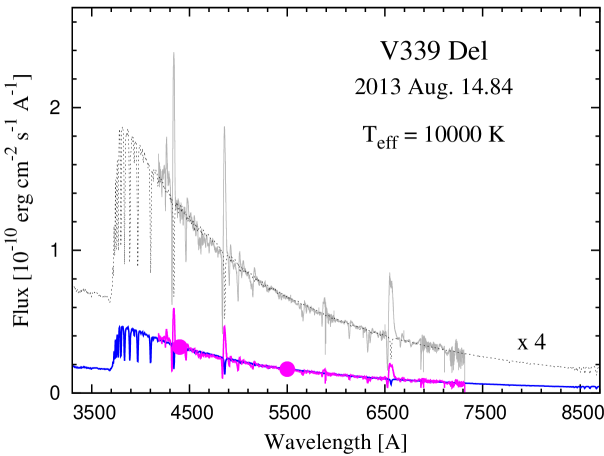
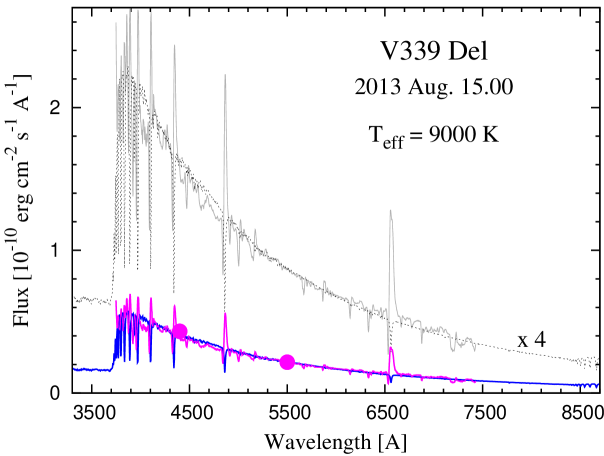
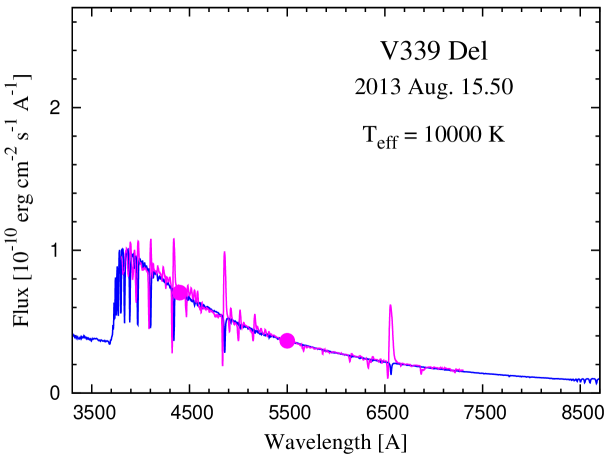
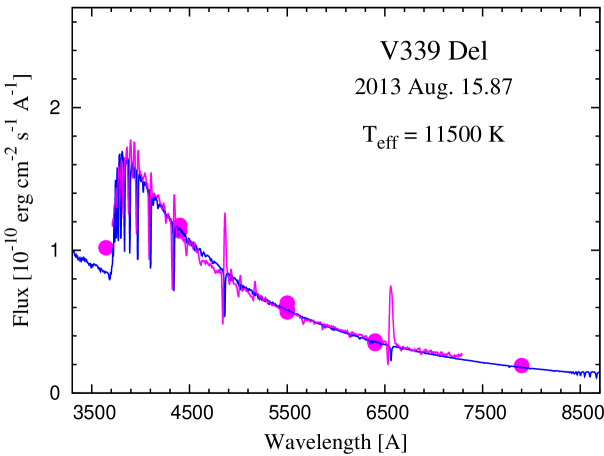
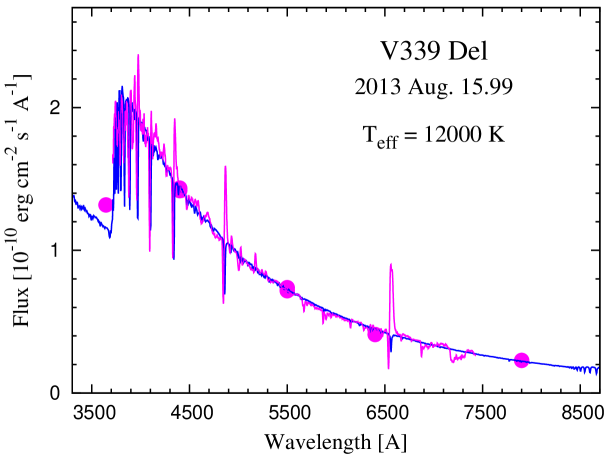
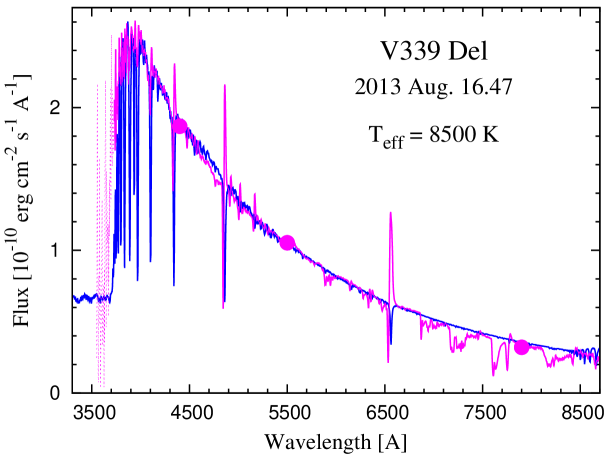
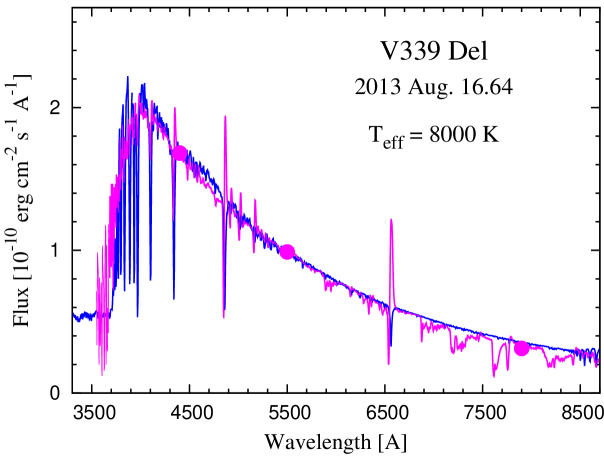
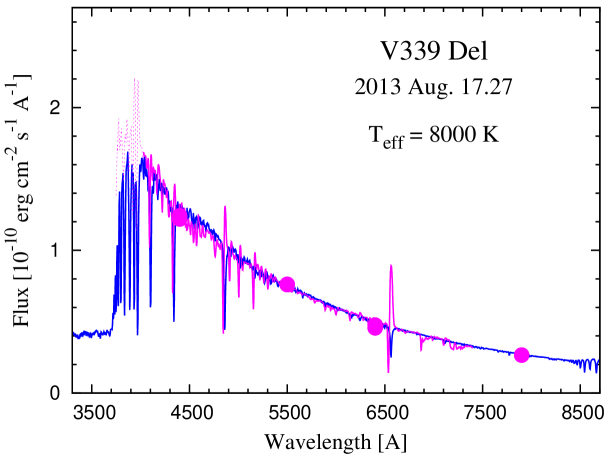
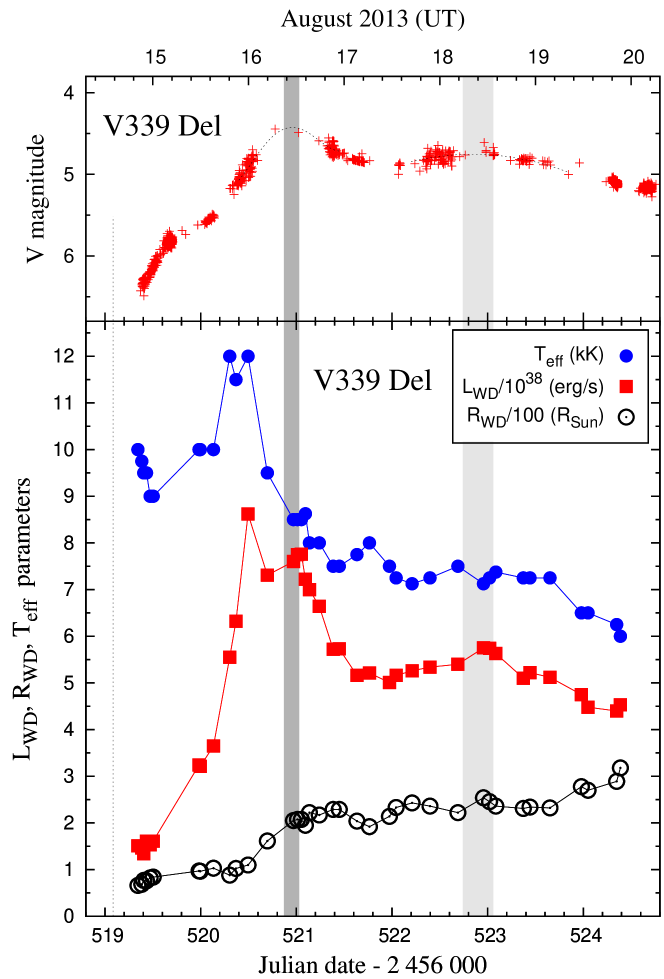
The resulting parameters are listed in Table 3, and examples of corresponding models fitting the selected spectra are depicted in Figs. 1 and 2, while Fig. 3 shows the evolution of the fundamental parameters, , and , during the fireball stage (Aug. 14.8–19.9, 2013). Although that only static atmospheric models were compared, the resulting models express the measured continuum well.
3.1.1 Estimate of uncertainties
In the range of between 5000 and 15000 K, its value is sensitive to the overall profile of the measured continuum in the optical. This allowed us to estimate with a relative uncertainty of %. For the selected spectra (Sect. 2), was well within the temperature step in the used grid of models, that is, between 250 and 500 K for and K. In some cases it was possible to estimate to 125 K by interpolating the neighbouring models around the measured spectrum (Table 3).
The uncertainty of the scaling factor, , is primarily given by the accuracy of the measured continuum, which was estimated to be % for the used spectra. Different requires different scaling. of 250 to 500 K corresponds to relative errors in of 2% to 4%. Thus, the largest relative errors in range between 5 and 7%.
The uncertainty in was determined as the root mean square error using the total differential of the function for given uncertainties in and . The relative error of was found to be around 10%, depending mainly on the uncertainty in (see Table 3).
| Date | ||||
| Aug. | [K] | [10-10] | [] | [1038] |
| The fireball stage | ||||
| 14.844 | 10000 | 5.0 | 66 | 1.5 |
| 14.885 | 9750 | 5.2 | 68 | 1.5 |
| 14.905 | 9500 | 5.8 | 77 | 1.3 |
| 14.934 | 9500 | 5.7 | 76 | 1.6 |
| 14.972 | 9000 | 6.2 | 82 | 1.5 |
| 15.004 | 9000 | 6.3 | 84 | 1.6 |
| 15.483 | 10000 | 7.3 | 97 | 3.2 |
| 15.496 | 10000 | 7.3 | 96 | 3.2 |
| 15.634 | 10000 | 7.7 | 103 | 3.7 |
| 15.804 | 12000 | 6.6 | 88 | 5.6 |
| 15.869 | 11500 | 7.7 | 102 | 6.3 |
| 15.996 | 12000 | 8.3 | 110 | 8.6 |
| 16.198 | 9500 | 12.1 | 161 | 7.3 |
| 16.470 | 8500 | 15.5 | 205 | 7.6 |
| 16.512 | 8500 | 15.6 | 207 | 7.8 |
| 16.553 | 8500 | 15.6 | 207 | 7.8 |
| 16.595 | 8625 | 14.6 | 195 | 7.2 |
| 16.637 | 8000 | 16.7 | 222 | 7.0 |
| 16.740 | 8000 | 16.3 | 217 | 6.6 |
| 16.885 | 7500 | 17.2 | 229 | 5.7 |
| 16.950 | 7500 | 17.2 | 229 | 5.7 |
| 17.134 | 7750 | 15.3 | 204 | 5.2 |
| 17.265 | 8000 | 14.4 | 192 | 5.2 |
| 17.473 | 7500 | 16.1 | 214 | 5.0 |
| 17.543 | 7250 | 17.5 | 233 | 5.2 |
| 17.710 | 7125 | 18.3 | 243 | 5.3 |
| 17.898 | 7250 | 17.8 | 236 | 5.3 |
| 18.189 | 7500 | 16.7 | 222 | 5.4 |
| 18.456 | 7125 | 19.1 | 254 | 5.8 |
| 18.520 | 7250 | 18.5 | 245 | 5.7 |
| 18.585 | 7375 | 17.7 | 236 | 5.6 |
| 18.873 | 7250 | 17.4 | 231 | 5.1 |
| 18.943 | 7250 | 17.6 | 234 | 5.2 |
| 19.151 | 7250 | 17.4 | 232 | 5.1 |
| 19.480 | 6500 | 20.9 | 278 | 4.8 |
| 19.550 | 6500 | 20.3 | 270 | 4.5 |
| 19.849 | 6250 | 21.7 | 289 | 4.4 |
| 19.887 | 6000 | 23.9 | 318 | 4.5 |
| Transition to a harder spectrum | ||||
| 21.691 | 37000 | 1.4 | 19 | 22 |
| 28.477 | 43000 | 1.0 | 13 | 21 |
| Sept. | ||||
| 13.642 | 100000 | 0.12 | 1.6 | 8.8 |
| 20.703 | 150000 | 0.046 | 0.6 | 6.5 |
Nebular component:
K,
EM = cm-3
K,
EM = cm-3
K,
cm-3
K,
cm-3,
dust component: K,
3.2 Evolution of fundamental parameters
3.2.1 Fireball stage
Following Fig. 3, we describe the temporal evolution of , , and of the WD pseudophotosphere (also called the envelope or shell) during its fireball stage as follows:
Already a few hours after the discovery, the radiative output of the nova dominated the optical. A comparison of synthetic models with the observed spectra (Eq. (1), Figs. 1 and 3) showed that the nova envelope was radiating at = 6000–12000 K during its fireball stage (Table 3). Our first spectra from Aug. 14.8–15.0, taken around 1.5 days prior to the photometric -band maximum, suggested a transient rapid decrease in from 10000 K to 9000 K (see the top row of Fig. 1) and a gradual increase of from 66 to 84 at a constant of 1.5.
About half a day later (Aug. 15.5), during the first short plateau phase in the light curve (), the continuum profile of our spectra reflected an unambiguous increase in the temperature to K, but at nearly unchanged radius, , implying an increase of by a factor of . The following heating of the envelope to its maximum of K on Aug. 15.8–16.0, with only a small increase of its radius to , implied a rapid increase of with a maximum of on Aug. 16.0 (see the second row from the top of Fig. 1).
A rapid cooling of the envelope to 7500 K on Aug. 16.9 (i.e. at a rate of 210 K/hour) was a result of the shell expansion by a factor of 2, to 200 (d/3 , which was followed by a general decrease of its luminosity to 5. At the -brightness maximum (Aug. 16.45, see narrower grey belt in Fig. 3), we indicate a local maximum of the luminosity.
From Aug. 16.9 to the end of the fireball stage of the nova, was gradually declining to 6000 K, followed by a gradual increase of its radius up to 300 , while the corresponding luminosity denoted only a small decrease to 4.6. Our observations caught an interesting behaviour around a shallow secondary -band maximum (Aug. 18.4, see broad grey belt in Fig. 3) corresponding to a small local maximum of .
3.2.2 Evolution beyond the fireball stage
Two days after the end of the fireball stage, on Aug. 22 (day 5.5), the high level of the optical continuum for Å (Sect. 3.1) and the bright magnitudes (Cass et al. 2013a) required the presence of a strong nebular radiation component with cm-3 supplemented by a contribution from a K warm residual pseudophotosphere scaled to (dotted line in Fig. 2). The very high value of EM constrained the minimum of K and to fit the short-wavelength part of the spectrum (for details see Appendix A of Skopal 2015b). The corresponding radius of the WD photosphere was .
On Aug. 28.5 (day 12), the warm stellar pseudophotosphere could no longer be identified. The spectrum for Å was dominated solely by the nebular continuum with cm-3. As in the previous case, the stellar component of radiation from the WD photosphere was determined such that its Lyman-continuum photons are just capable of giving rise to the measured EM and the component fits the short-wavelength part of the spectrum. In this way, we obtained K, and .
On Sept. 13 (day 28), the nebular component of radiation entirely dominated the optical to near-IR (330 nm – 3.4m). A contribution from the WD photosphere could not be recognized in the optical spectrum (see Figs. 1 and 2). The slope of the continuum and a relatively small Balmer jump in emission corresponded to a high . To match the observed continuum we scaled the coefficient with cm-5, i.e. cm-3 (Eq. (2)). Because no observations in the UV are available, we can only estimate the lower limit of the WD luminosity and temperature. There are two principal constraints:
(i) The WD contribution cannot considerably influence even the short-wavelength part of the optical spectrum because this would lower the nebular contribution, the amount of which in the near-IR is justified by the fluxes.
(ii) The high EM requires a high rate of hydrogen-ionizing photons, s-1 for the recombination coefficient cm3 s-1 (e.g. Péquignot et al. 1991). These conditions thus require the radiation at K scaled with (i.e. ), which correspond to .
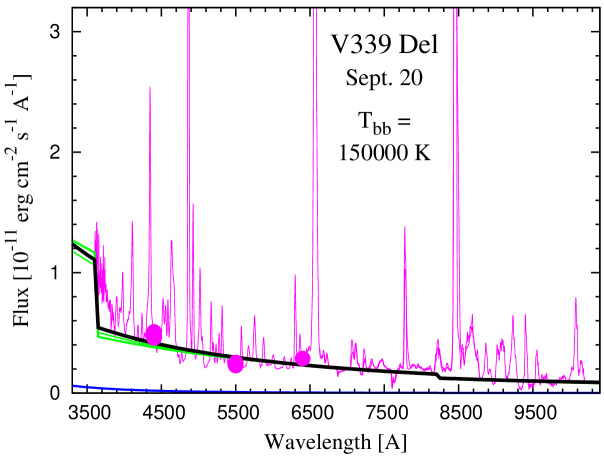
On Sept. 20 (day 35), the continuum profile remained nearly unchanged, but with a flux level by a factor of 1.7 lower than on Sept. 13 (see Fig. 1). Taking into account the same conditions as mentioned above, the model SED corresponded to , cm-3, which constrains K, and . However, the near-IR flux-points from Sept. 21.8 were located clearly above the nebular continuum (see Fig. 2), indicating the presence of a dust component in the spectrum. Our model SED thus confirms the dust formation reported by Shenavrin et al. (2013) and suggests that it occurred already around Sept. 21 (see also Cass et al. 2013c). We matched the dust component with a blackbody temperature K and a luminosity .
Model SEDs during the post-fireball stage are plotted in Fig. 2. One of the most interesting results of modelling the SED during this period is the persistent super-Eddington luminosity, which appeared to be even higher than during the fireball phase (see Table 3). The same effect was found for RS Oph by Skopal (2015b).
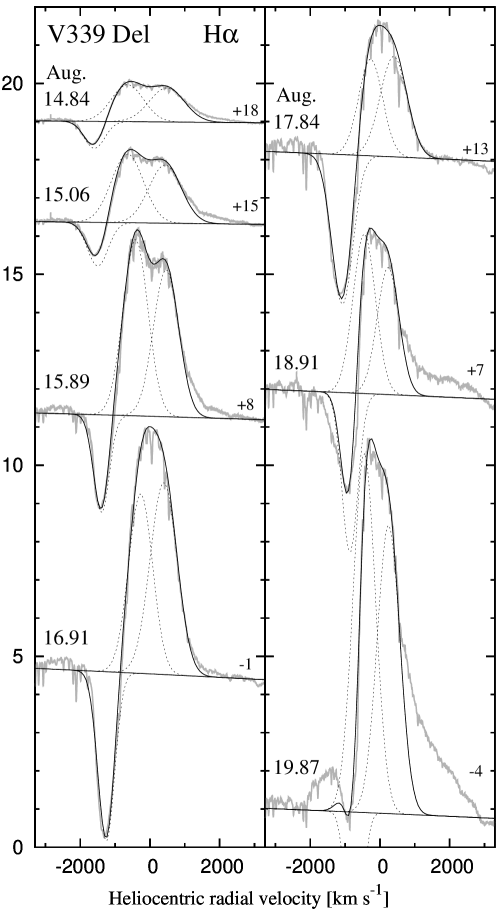
3.3 Evolution of the H line profile
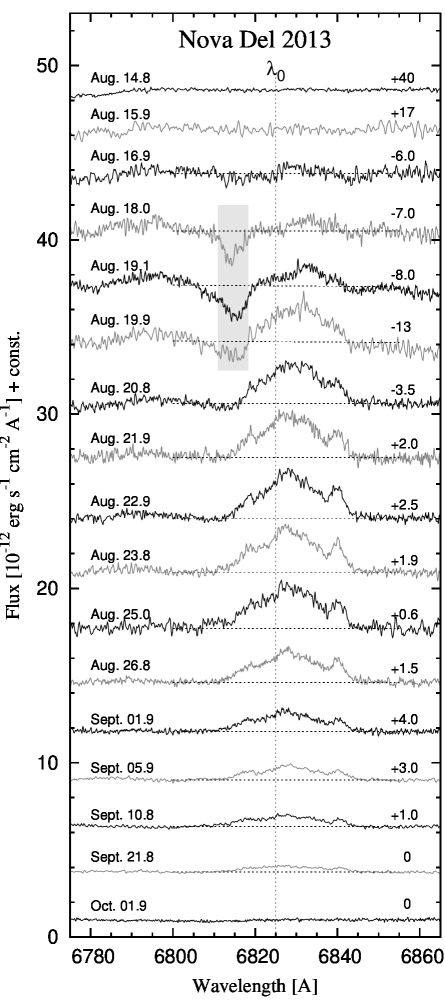
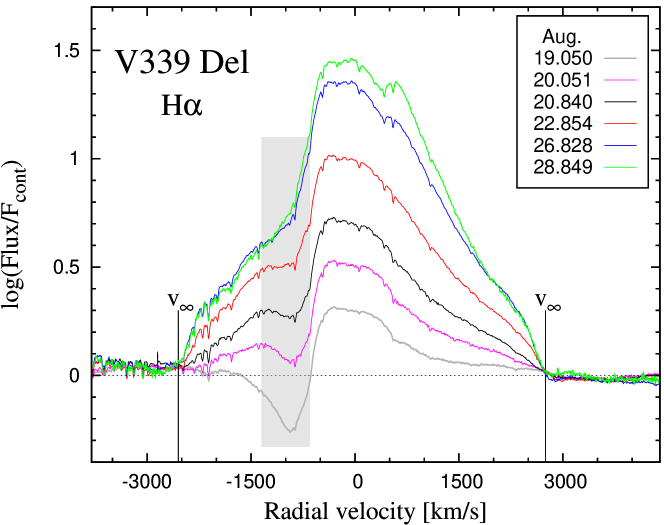
Figure 4 shows the evolution of the H line during the fireball stage. Its profile was of P Cygni-type. To separate its main components, we fitted the profile with three Gaussian functions, two for its emission component and one to match the absorption component (dotted lines in Fig. 4). The main characteristics of the temporal evolution of the H profile can be summarized as follows:
(i) A strong absorption component was always present. Its radial velocity (RV) was gradually decreasing from -1600 km s-1, as was measured on our first spectrum from Aug. 14.84, to -730 km s-1, at the maximum of the envelope inflation, around Aug. 19.87 (see panel (a) of Fig. 7). The absorbed flux was gradually increasing until Aug. 18, when its amount was by a factor of 8 higher than measured on our first spectra (see panel (b) of the figure). It is of interest to note that the absorption component was strong enough to cut parts of the emission component at its blue side even after the fireball stage (Aug. 20.0, see Fig. 8).
(ii) Prior to the optical maximum, the emission part of the profile was flat-topped, suggesting that it was composed of two strongly blended components. After the -maximum, the H emission narrowed, mainly at the blue side, and its core became single-peaked. Around Aug. 18, when the absorbed flux reached its maximum, a transient decrease in the H emission was observed (panel (c) of Fig. 7).
(iii) At the end of the fireball phase, Aug. 18.9, the red emission wing expanding to RV +2750 km s-1 increased. Its blue counterpart extended to RV -2550 km s-1 since Aug. 19.87. These values were almost unchanged during the investigated period of the nova evolution. Some examples are shown in Fig. 8. Accordingly, we adopted the terminal velocity of the broad wings as their average, i.e. km s-1.
3.4 Raman-scattered O vi 1032 Å line – first time seen in a classical nova
A transient emergence of the Raman-scattered O vi 1032 Å line in the spectrum of V339 Del was very startling, because its induced faint, broad emission feature around Å has never been observed in the spectrum of a classical nova (see Skopal et al. 2014, for the first note).
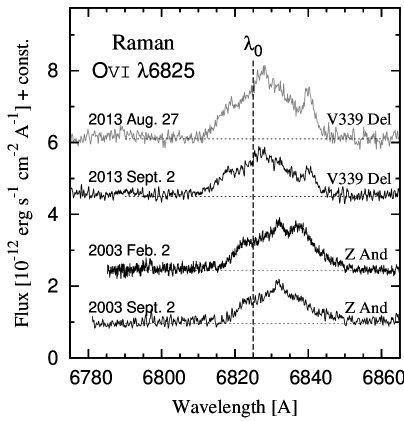
Figure 5 shows the temporal evolution of this feature. It was observed in the spectrum of V339 Del for more than one month, from Aug. 19 to the end of the first plateau phase in the light curve around Sept. 23, 2013 (day 37). During the fireball stage, no Raman emission was detected because of the low temperature of the ionizing source, at which no original O vi photons could be created. From Aug. 20 on, the flux of the Raman line was decreasing and vanished completely by the end of September. Its was 30 Å and the profile showed a redward-shifted component around Å and a faint blue-shifted shoulder. A similar structure of the Raman-scattered line profile has frequently been recognized in the spectra of symbiotic stars (see Fig. 6). Energy conservation of the Raman process implies the broadening of the scattered line with a factor of (Nussbaumer et al. 1989). Thus, the 30 Å corresponds to a maximum broadening of the original 1032 Å line of 0.7 Å, i.e. 200 km s-1, which corresponds to expected movements of emitting material in the vicinity of the hot WD. Since October 1, just after the first plateau phase of the light curve, when a significant X-ray flux was first reported (Page et al. 2013), the Raman line could no longer been discerned in our spectra.
The appearance of the Raman-scattered line during a classical nova outburst is an unexpected important event that places strong constraints on the ionization structure of the nova ejecta (Sect. 4.2.4).
4 Interpretation of observations
4.1 Evolution of the parameters , , and
The comprehensive spectroscopic and photometric observations of nova V339 Del, performed immediately after its discovery, allowed us to map in detail the evolution of its fundamental parameters even during the initial phase of its explosion. This showed, however, that the nova was not evolving strictly according to the canonical view, which assumes a gradual cooling and expanding of the nova envelope at a constant luminosity during the fireball stage (e.g. Shore et al. 1994; Schwarz et al. 2001).
The parameters , , and behaved as commonly expected only after the visual maximum, since Aug. 17 (Fig. 3, Sect. 3.2.1). The evolution of the nova prior to the -maximum was unconventional. The transient increase in from (Aug. 14.97) to K (Aug. 15.9) at a nearly constant was caused by a rapid increase in the luminosity from 1.5 to 8.6 (Fig. 3). At the maximum of and , the effective radius started to expand rapidly. During about one day, from Aug. 16 to 17, its value increased by a factor of 2, while and decreased and followed the standard evolution at approximately constant, but super-Eddington luminosity , to the end of the fireball stage333 A small decrease of at the end of the fireball stage was probably only apparent because of the disk-like shape of the pseudophotosphere (see Sect. 4.2.3), which does not allow estimating the total luminosity of the central source (see Sect. 5.3.6 of Skopal 2005). . An intermediate minimum of around Aug. 17.2 was probably caused by a transient decrease of the optical depth along the line of sight, resulting in a deeper view into the ejecta, down into a hotter optically thick shell, which radiates at unchanged . On the other hand, a small transient increase of around Aug. 18.4 was accompanied by an increase in and a small decrease of (see Fig. 3). This suggests that the outflowing material was inhomogeneous. Another striking result we obtained from our modelling of the SED is the very high luminosity of V339 Del, which is well above its Eddington limit for (Chochol et al. 2014), during the fireball stage and beyond (Table 3). This result also contradicts the theoretical expectation that a super-Eddington phase only persists for a few hours at the very beginning of the nova eruption (e.g. Prialnik & Kovetz 1995; Starrfield et al. 2008).
Nevertheless, the super-Eddington luminosity was previously observationally documented for some novae in the past. For example, Friedjung (1987) showed that the energy output of nova FH Ser was well above the Eddington limit for about two months after its optical maximum. Schwarz et al. (2001) demonstrated that the luminosity of the nova LMC 1991 was super-Eddington before its visual maximum and reached . Recently, Skopal (2015b) revealed this also for the recurrent nova RS Oph.
The super-Eddington state was theoretically investigated by Shaviv (1998), who considered a reduction of the effective opacity in the inhomogeneous atmosphere of novae, which increases the Eddington luminosity well above its classical value, calculated for the Thomson-scattering opacity. Lowering the effective opacity can result from the rise of a ‘porous layer’ above the convective zone of the burning WD (see Fig. 1 of Shaviv & Dotan 2010). Under these conditions novae evolve at a super-Eddington steady state, which can explain their very long decay times (Shaviv & Dotan 2012). The long-term super-Eddington luminosity and the inhomogeneous mass ejecta, as we derived from our observations, seem to reflect Shaviv’s theoretical predictions. However, further detailed multiwavelength analyses of other objects are required to allow for a more accurate theoretical modelling of the nova phenomenon.
Finally, a very large effective radius of the optically thick pseudophotosphere at the end of the fireball stage ( ) suggests a high mass of the ejected material (Sect. 4.3).
4.2 Biconical ionization structure of the fireball
4.2.1 Origin of the H line
To understand the origin of the H line during the fireball stage of nova V339 Del, we need to identify (i) the ionizing source that is capable of giving rise to the observed H luminosity, and (ii) the material that is subject to ionization, the kinematics of which corresponds to the observed RVs.
(i) Already the first spectra of V339 Del indicated the presence of rather strong emission lines of hydrogen. For example, the luminosity, , produced by the H line corrected for the absorption component was between 5.3 and 4.1, as measured on our first (Aug. 14.84) and last (Aug. 19.87) spectra during the fireball stage (Fig. 7). This luminosity was generated in a volume with the emission measure cm-3 for the volume emission coefficient in H, erg cm3 s-1. This requires ionizations/recombinations per second for the total hydrogen recombination coefficient (Péquignot et al. 1991). However, the rate of hydrogen-ionizing photons, produced by the 6000–12000 warm pseudophotosphere of the nova, photons s-1, is far below the rate of recombinations required to generate the (i.e. ). Thus the warm envelope cannot be ascribed to the ionizing source. This implies that the ionizing source is not seen directly by the observer, because the EMα derived from the observed is a few orders of magnitude higher than what can be produced by the warm pseudophotosphere. Such radiative components in the spectrum, which correspond to very different and mutually inconsistent temperature regimes, are often observed during outbursts of symbiotic stars. The corresponding spectrum is called a two-temperature-type spectrum (see Sect. 5.3.4 of Skopal 2005).
(ii) An additional constraint for determining the ionizing source is provided by the broad H profile, the red wing of which extends to 2000 km s-1 during the fireball stage. Approaching the end of this phase (after Aug. 18), the broad wing has strengthened and extended to a terminal velocity of 2700 km s-1 (Figs. 4 and 8). This implies that the mass outflow of the ionized hydrogen must have been collimated. Otherwise, the large optically thick envelope ( ) would eclipse a significant fraction of the material flowing away from the observer, and would therefore preclude identifying it in the form of the extended red wing of the line.
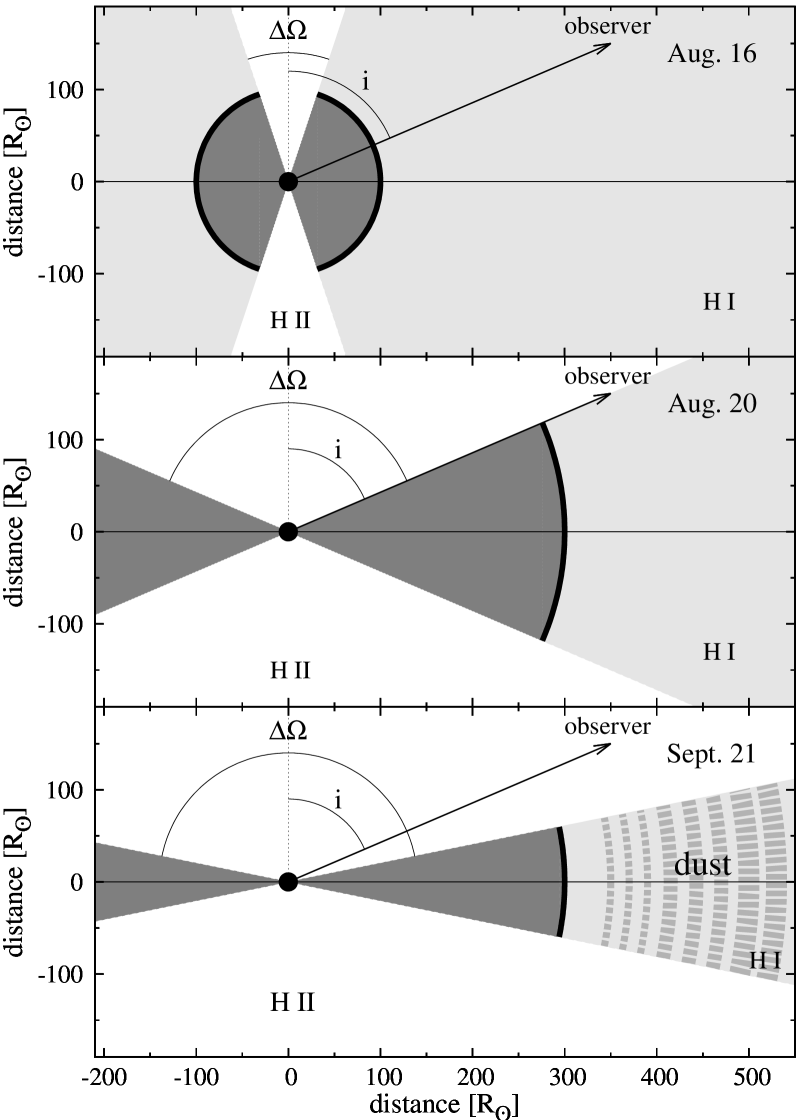
Observational constraints included in points (i) and (ii) above imply that the mass outflow of nova V339 Del was not spherically symmetric during the fireball stage, meaning that the density was not homogeneously distributed in the envelope. Both the flux and the profile of the H line suggest that there is a low-density optically thin part, located in bipolar direction relative to the burning WD, probably along its rotation axis (i.e. perpendicular to its orbital plane). Its particles are ionized by the hot WD surface and driven out in the form of a fast wind. The remainder of the surrounding envelope is neutral. Its optically thick/thin interface represents the warm expanding pseudophotosphere (see top panel of Fig. 9). A similar ionization structure of the expanding envelope during the fireball phase was also indicated for RS Oph (see Fig. 4 of Skopal 2015b). In the case of V339 Del, the opening angle of the H ii zone has to be narrower because the nebular continuum is significantly weaker than in the case of RS Oph.

4.2.2 Variations of the H profile
According to the biconical ionization structure of the envelope during the fireball stage, the flat to double-peaked emission component of the H line can be produced by the ionized material driven in bipolar directions from the burning WD surface. Each pole emission can be approximated by one component.
From Aug. 16 on, a strengthening of the absorption component, which reached its maximum around Aug. 18 (Sect. 3.3, Fig. 7), was probably caused by the inflation of the WD pseudophotosphere by a factor of 2. This was approximately consistent with the enlargement of the effective surface of the optically thick envelope (Table 3). A deceleration of the envelope expansion caused a gradual shift of the absorption component to longer wavelengths (see Figs. 4 and 7), which narrowed the H emission to a single peak. In addition, the significantly expanded pseudophotosphere eclipsed a larger part of the H ii zone, which probably caused the transient decrease of its emission as observed around Aug. 18 (Fig. 7).
The increase of the H flux and the expansion of the emission wings of the line during the last day of the fireball stage (Figs. 4 and 8) was apparently caused by the biconical “opening” of the H ii region (see below, Sect. 4.2.3).
4.2.3 Disk-like shape of the envelope and its dilution
During the last day of the fireball stage (Aug. 19), the emission produced by hydrogen lines was clearly increasing (see Fig. 7 for H). For example, the total flux (i.e. corrected for the absorption component) in the H line increased from 1.8 to from Aug. 18.91 to Aug. 19.87. In addition, the nebular continuum also became noticeable in our last spectrum taken during the fireball stage, on Aug. 19.89 (Fig. 1). In contrast, and of the warm shell were decreasing and were much lower than what would be needed to produce the measured nebular emission, as described in Sect. 4.2.1. This implies that the unseen ionizing source was increasing. According to the biconical ionization structure of the expanding envelope (see Sect. 4.2.1), the gradual increase of the nebular contribution could be caused by a gradual opening of the H ii zone, which would mean a narrowing of the H i zone. The optically thick envelope was therefore developing to a disk-like structure. Its outer flared rim represented the pseudophotosphere. From this point of view, the warm stellar component that dominates the spectrum implies that the ionizing source was hidden by the outer rim of the disk, that is, it was below the observer’s horizon represented by the H i/H ii boundary. As soon as the opening angle of the H ii zone becomes , the burning WD rises above the boundary and thus terminates the fireball stage (see Fig. 9). As a result, we can observe a hotter WD photosphere throughout an optically thinner H ii zone, but a contribution from a remnant H i pseudophotosphere can also be expected (see the bottom panel of Fig. 9). This transition was demonstrated by the model SED of Aug. 21.7, which indicates a strong nebular component of radiation supplemented by a component from the warm residual pseudophotosphere and a hotter WD photosphere (Sect. 3.2.2, Fig. 2). In the -light curve this was reflected by the first rapid fading from a flat maximum on Aug. 19 (see Fig. 2 of Munari et al. 2013a).
A significant decrease of from to in two days is consistent with a rapid decrease of the optical depth along the line of sight caused mainly by the geometrical effect of the rise of the hot WD above the H i/H ii horizon (see Fig. 9). A similar effect of a sudden shift of the SED maximum to the ultraviolet was also indicated in the spectrum of nova RS Oph, which occurred during a much shorter time than the corresponding dynamical time-scale (see Sect. 4.2 of Skopal 2015b).
A gradual opening of the H ii zone can be a result of a decreasing mass-loss rate from the WD (see Sect. 4.4). Recently, Cariková & Skopal (2012) showed that the biconical ionization structure can be formed as a consequence of the enhanced mass-loss rate from the rotating WD during outbursts of symbiotic binaries. In their model, the opening of the H ii zone is related to the mass loss rate from the WD as (see their Figs. 1 and 6).
Finally, there are two consequences of this type of the nova envelope dilution.
(i) The duration of the fireball stage can be a function of . In general, a higher inclination implies a longer-lasting fireball stage, and vice versa. The transition of the maximum of the SED from the optical to the UV can occur during a short time of a few days.
(ii) The neutral material within the H i zone, which has the form of a disk encompassing the hot WD, can persist within the ejecta for a much longer time than the duration of the fireball phase until it becomes totally ionized. It is evident as an extra component in the model SEDs during a few days after the fireball stage (Fig. 2, Sect. 3.2.2). Further evident proof of the H i zone beyond the fireball stage is the Raman-scattered O vi 1032 Å line in the optical spectrum for more than one month (Sect. 3.4).
4.2.4 Probing the neutral disk by the Raman-scattering
In the process of Raman-scattering, a photon excites an atom from its ground state to an intermediate state, which is immediately stabilized by a transition to a different true bound state. This process produces the Raman-scattered photon at a (very) different frequency and the corresponding rest line photon (see Fig. 1 of Nussbaumer et al. 1989).
The Raman-scattering of the O vi 1032 Å line photons by neutral hydrogen atoms produces a broad emission band at 6825 Å. This Raman conversion was clearly indicated in the spectra of many symbiotic stars. Its efficiency depends on the scattering geometry; more accurately, on the fraction of the sky as seen from the O vi zone, which is covered by the neutral gas where Raman scattering can take place. A small cross-section of the Raman conversion, cm2 (Schmid 1989) requires a large amount of neutral material in the circumstellar environment where it originates. The column density of the H i atoms along the line of sight of the incident O vi photons must exceed a value of cm-2to produce an observable effect (i.e., the optical depth .
From the properties of the Raman-scattering process and its induced feature observed around 6830 Å (see Fig. 5, Sect. 3.4) we can infer some characteristics of both the neutral H i and the ionized O vi zone.
(i) The Raman-scattered O vi 1032 Å line in the spectrum of V339 Del confirms that there is a massive H i zone in a classical nova as well. This seems surprising, since there is no other source of neutral hydrogen, as there is in symbiotic binaries. However, according to the ionization structure of the envelope and its evolution during and after the fireball stage (Sects. 4.2.1 and 4.2.3), the Raman-scattering takes place in the neutral disk-like formation that encompasses the burning WD (see also Fig. 9).
(ii) The profile of the Raman line did not change markedly throughout its visibility. This implies that the geometry of the scattering H i region (i.e. the disk around the hot ionizing source) also persisted more or less unchanged.
(iii) A gradual decrease of the Raman flux since the end of August reflected a gradual decrease of the Raman-scattering efficiency due to a narrowing of the disk-like H i zone; as a consequence, the solid angle of sky area filled with neutral gas as seen from the O vi photon-emitting zone becomes smaller. This is probably a result of a decreasing mass-loss rate (see Sect. 4.4), which leads to a gradual ionization and hence flattening of the neutral disk (Cariková & Skopal 2012), which in turn leads to an enlargement of the H ii zone (see Sect. 4.3).
(iv) The structure of the Raman profile itself results from the relative motions between the main emitting and scattering regions. A redward shift of the Raman-scattered emission is consistent with its origin predominantly in the neutral disk that expands from the hot WD. A similar interpretation was suggested for the symbiotic prototype Z And during its 2006 post-outburst stage (see Fig. 5 of Skopal et al. 2009).
(v) Finally, the Raman-scattered O vi 1032 Å line in the spectrum requires the existence of an ionizing source that is capable of producing the O+5 ions. According to Mürset & Nussbaumer (1994), the ionization potential (O eV requires K. At this temperature, other permitted lines with lower ionization potential (e.g. He ii lines) are also expected in the spectrum. However, no He ii lines were identified at the same time as the Raman 6830 Å emission. This is a puzzle. We can only speculate that the emission regions with highly ionized elements are very small (an example is given in Appendix B of Skopal et al. 2006), so that the surrounding dense layers can absorb photons of corresponding transitions. However, especially the O vi 1032 Å photons can be effectively absorbed by Rayleigh and Raman scattering. The former is a multiple-scattering resonance process (it generates a photon of the same frequency), which can be terminated by the latter one – the last transition in the Rayleigh-scattering chain, which produces the Raman 6825 Å photon. As there is no other strong transition of any other element at/around this wavelength (e.g. Allen 1980), the Raman photon can easily escape from the region where it was created.
4.3 Mass of the emitting material
According to our modelling results for the SED, the nebular emission in the continuum arose at the end of the fireball stage, when the broad wings of the H line also expanded to km s-1 (Sect. 3.3, Fig. 8). Assuming that the hydrogen recombination lines are produced within the same emission region as the nebular continuum, its volume can be estimated as
| (3) |
where the filling factor reduces the spherical volume by taking into account the biconical structure of the H ii zone due to the neutral disk that encompasses the WD (see Fig. 9). In addition, the disk blocks a fraction of the ionized region from its opposite side in the direction of the observer. The largest radius of the emitting volume is , where is the time elapsed since the end of the fireball stage (Aug. 19.9, 2013). Then, according to the definition of the emission measure, the average particle density of the nebular-emitting region can be approximated as . With the aid of these simple relations, we can write the emitting mass of the nebula, , in the form
| (4) |
where the factor = for the mean molecular weight and the mass of the hydrogen atom g.
On Aug. 22 ( days), the model cm-3 corresponded to a maximum () mass of the emitting material, . The subsequent quantities of derived for Aug. 28 ( days), Sept. 13 ( 25 days), and Sept. 20 ( 31.5 days) were increasing to , , and , respectively (for EM in Table 3). Such a large increase of could not only be caused by a high mass-loss rate from the burning WD (see below), but mainly by a gradual dilution (i.e. ionization) of the neutral disk-like material, as indicated by the evolution of the Raman 6825 Å O vi line (Fig. 5).
Considering only the biconical shape of the emitting region, the filling factor , where is the opening angle of the H ii region in sr. For example, gives , which lowers by a factor of 0.7. The very high EM suggests a large with close to 1, and thus no significant reduction of due to the filling factor in Eq. (4) can be expected.
4.4 Mass-loss rate of the ionized material
After the fireball stage, the nebular component of radiation dominated the optical to near-IR spectrum of V339 Del (Fig. 2). It represents a fraction of the WD’s radiation re-processed by ionization processes followed by recombinations and free–free transitions. Thus, knowing the physical process and its result, the EM from the model SED allows us to determine the mass-loss rate of the ionized material, .
In our simplified approach the material flows out at a constant velocity , and its density distribution at a radial distance from its source satisfies the mass continuity equation as
| (5) |
where is the opening angle of the H ii region. It is further assumed that all particles become ionized on their path from the place of origin, , to the end of the nebula, . Then, in the case of a pure hydrogen gas, we can approximate the equilibrium condition between the flux of ionizing photons, , and the rate of recombinations in the nebula as
| (6) |
where (cm3 s-1) is the recombination coefficient to all but the ground state of hydrogen (see also Eq. (4) of Nussbaumer & Vogel 1987). This equation is valid for a hydrogen plasma heated by photoionizations and characterized by a constant . According to the geometry of the H ii region, . For a complete ionization (, the equilibrium equation (6) can be integrated from to , and using given by Eq. (5), can be expressed as
| (7) |
where the ratio = EM.
On Aug. 22, the parameters of the model SED, , cm and cm-3 yield . On Aug. 28, Sept. 13, and 20, was decreasing to 4.5, 1.4, and , respectively (parameters in Table 3). In all cases we adopted and km s-1 (Sect. 3.3), which correspond to maximum values of .
5 Summary
We modelled the optical/near-IR SED of the classical nova V339 Del from its discovery on Aug. 14, 2013 until the end of the first plateau phase in the light curve (around day 40). We determined the fundamental parameters , , and of the burning WD pseudopotosphere (Fig. 3). Monitoring the evolution of the H line profile and the transient emergence of the Raman-scattered 1032 Å line in the optical spectrum allowed us to determine the ionization structure of the nova during this early period of its evolution (Fig. 9). The main results of our analysis may be summarized as follows.
-
1.
During the fireball stage (Aug. 14.84–19.89, 2013; see Sect. 3.1), was in the range of 6000–12000 K, was expanding in a non-uniform way from 66 to and was super-Eddington, but not constant. Its maximum occurred around 1.5 day after the nova discovery, at the maximum of (Aug. 16.0), when rapidly increased by a factor of 6 with respect to its initial value of (Sect. 3.2.1, Fig. 3). Thus, V339 Del did not obey the theoretical prediction that a nova evolves at a constant bolometric luminosity in the early stages of outburst (Sect. 4.1).
-
2.
After the fireball stage (Aug. 20), the optical/near-IR SED changed significantly (Figs. 1 and 2). The continuum was dominated by the nebular radiation component with a large cm-3. As a result, only limiting values of the parameters could be determined from the measured EM and the profile of the SED (Sect. 3.2.2). The lower limit of was still super-Eddington, being around , which is higher than the value we derived during the fireball stage.
-
3.
The profile of the H line and its relative high flux even during the fireball phase imply that there is a low-density optically thin part of the envelope, with a bipolar shape relative to the burning WD. This part of the envelope is ionized, while the remainder is neutral. The optically thick/thin interface represents the warm expanding pseudophotosphere. A gradual increase of the nebular contribution during the last day of the fireball stage (Aug. 18.9 – 19.9) could be caused by a gradual opening and enlargement of the H ii zone, causing a narrowing of the H i zone. The optically thick pseudophotosphere was therefore transformed into a disk-like shape (Sect. 4.2, Fig. 9).
-
4.
According to the biconical ionization structure of the nova ejecta, the rapid decrease of from 300 to 19 and the dramatic change in the SED during a few days after the fireball stage was caused by the rising of the hot WD above the H i/H ii horizon with respect to the line of sight (Fig. 2, Sect. 4.2.3).
-
5.
A disk-like H i region was indicated within the ejecta for a period of 1 month after the fireball stage, until its total ionization, around day 40. The most conclusive proof of the presence of the H i zone around the burning WD is the presence of the Raman-scattered O vi 6830 Å emission, which requires a column density of the H i atoms of cm-2 (Sect. 4.2.4, Fig. 5).
-
6.
On Sept. 20, our model SED indicated a dust emission in the near-IR. The simultaneous presence of the hard radiation from the burning WD constrains the dust to be located in a ring beyond the H i zone, where it is shielded from the high-temperature radiation (bottom panel of Fig. 9).
-
7.
The emitting mass of the H ii zone was gradually growing from (Aug. 22) to (Sept. 20) mainly due to a gradual ionization of the H i zone (Sect. 4.3).
-
8.
The mass-loss rate from the nova was decreasing from 5.7 on Aug. 22 to 7.1 on Sept. 20 (Sect. 4.4).
As in the case of the extraordinary classical nova LMC 1991 (Schwarz et al. 2001) and/or the symbiotic recurrent nova RS Oph (Skopal 2015b), the special physical conditions derived from observations of the classical nova V339 Del represent new challenges for the theoretical modelling of the nova phenomenon.
Acknowledgements.
We thank the anonymous referee for constructive comments. The spectra presented in this paper were in part obtained within the Astronomical Ring for Access to Spectroscopy (ARAS), an initiative promoting cooperation between professional and amateur astronomers in the field of spectroscopy. The authors thank ARAS observers for their contributions made within the ARAS programme coordinated by Francois Teyssier. We also acknowledge the variable-star observations from the AAVSO International Database contributed by observers worldwide and used in this research. This research has been in part supported by the project No. SLA/103115 of the Alexander von Humboldt foundation and by a grant of the Slovak Academy of Sciences VEGA No. 2/0002/13.References
- Allen (1980) Allen, D. A. 1980, MNRAS, 190, 75
- Burlak et al. (2013) Burlak, M. A., Shenavrin, V. I., Tatarnikov, A. M., & Tatarnikova, A. A. 2013, ATel. No. 5294
- Cardelli et al. (1989) Cardelli, J. A., Clayton, G. C., & Mathis, J. S. 1989, ApJ, 345, 245
- Cariková & Skopal (2012) Cariková, Z., & Skopal, A.: 2012, A&A, 548, A21
- Cass et al. (2013a) Cass, A. C., Carlon, R. L., Corgan, D. T., et al. 2013a, ATel. No. 5317
- Cass et al. (2013b) Cass, A. C., Carlon, R. L., Corgan, D. T., et al. 2013b, ATel. No. 5340
- Cass et al. (2013c) Cass, A. C., Carlon, R. L., Corgan, D. T., et al. 2013c, ATel. No. 5434
- Chochol et al. (2014) Chochol, D., Shugarov, S., Pribulla, T., & Volkov, I. 2014, Contrib. Astron. Obs. Skalnaté Pleso, 43, 1
- Cox (2000) Cox, A. N. 2000, Allen’s Astrophysical Quantities, 4-th edition, (New York: AIP Press, Springer)
- Henden & Kaitchuck (1982) Henden, A. A., & Kaitchuck, R. H. 1982, Astronomical Photometry, (New York: Van Nostrand Reinhold Company), 50
- Darnley et al. (2013) Darnley, M. J., Bode, M. F., Smith, R. J., & Evans, A. 2013, ATel. No. 5279
- Darnley & Bode (2013) Darnley, M. J. & Bode, M. F. 2013, ATel. No. 5300
- Friedjung (1987) Friedjung, M.: 1987, A&A, 179, 164
- Gehrz et al. (2013) Gehrz, R. D., Dykhoff, D. A., & Shenoy, D. P. 2013, ATel. No. 5299
- Munari et al. (2005) Munari, U., Sordo, R., Castelli, F., & Zwitter, T. 2005, A&A, 442, 1127
- Munari et al. (2013a) Munari, U., Henden, A., Dallaporta, S., & Cherini, G. 2013a, IBVS No. 6080
- Munari et al. (2013b) Munari, U., Valisa, P., Milani, A., & Cetrulo, G. 2013b, ATel. No. 5297
- Mürset & Nussbaumer (1994) Mürset, U., & Nussbaumer, H. 1994, A&A, 282, 586
- Nussbaumer et al. (1989) Nussbaumer, H., Schmid, H. M., Vogel, M. 1989, A&A, 211, L27
- Nussbaumer & Vogel (1987) Nussbaumer, H., Vogel., M. 1987, A&A, 182, 51
- Page et al. (2013) Page, K. L., Osborne, J. P., Kuin, N. P. M., et al. 2013, ATel. No. 5470
- Péquignot et al. (1991) Péquignot, D., Petitjean, P., & Boisson, C. 1991, A&A, 251, 680
- Prialnik & Kovetz (1995) Prialnik, D., & Kovetz, A. 1995, ApJ, 445, 789
- Schmid (1989) Schmid, H.M. 1989, A&A, 211, L31
- Schwarz et al. (2001) Schwarz, G. J., Shore, S. N., Starrfield, S., et al. 2001, MNRAS, 320, 103
- Shaviv (1998) Shaviv, N. J. 1998, ApJ, 494, L193
- Shaviv & Dotan (2010) Shaviv, N. J., Dotan, C. 2010, Mem. S.A.It., 81, 350
- Shaviv & Dotan (2012) Shaviv, N. J., Dotan, C. 2012, Mem. S.A.It., 83, 792
- Shenavrin et al. (2013) Shenavrin V. I., Taranova O. G., Tatarnikov A. M. 2013, ATel. No. 5431
- Shore et al. (1994) Shore, S. N., Sonneborn, G., Starrfield, S., Gonzalez-Riestra, R., & Polidan, R. S. 1994, ApJ, 421, 344
- Shore (2008) Shore, S. 2008, in Classical novae, M. F. Bode, & A. Evans (eds.), (Cambridge: CUP), p. 194
- Shore et al. (2013a) Shore, S., Škoda, P., & Rutsch, P. 2013a, ATel. No. 5282
- Shore et al. (2013b) Shore, S., Škoda, P., Korčáková, D., et al. 2013b, ATel. No. 5312
- Shore et al. (2013c) Shore, S., Alton, K., Antao, D., et al. 2013c, ATel. No. 5378
- Skopal (2005) Skopal, A. 2005, A&A, 440, 995
- Skopal (2007) Skopal, A. 2007, New Astron., 12, 597
- Skopal (2015a) Skopal, A. 2015 a, New Astron. (in press; arXiv:1401.1848)
- Skopal (2015b) Skopal, A. 2015 b, New Astron. (in press; arXiv:14026126)
- Skopal et al. (2006) Skopal, A., Vittone, A. A., Errico, L., et al. 2006, A&A, 453, 279
- Skopal et al. (2009) Skopal, A., Pribulla, T., Budaj J., et al. 2009, ApJ, 690, 1222
- Skopal et al. (2011) Skopal, A., Tarasova, T. N., Cariková, Z., et al. 2011, A&A, 536, id. A27, 13 pp.
- Skopal et al. (2014) Skopal, A., Wolf, M., Šlechta. M., et al. 2014, ATel No. 6132
- Starrfield et al. (2008) Starrfield, S., Iliadis, Ch., Hix, W. R.: 2008, in M. F. Bode, & A. Evans, eds., Classical Novae. CUP, Cambridge, p. 77
- Tarasova (2013) Tarasova, T. N. 2013, ATel. No. 5291
- Tarasova & Shakhovskoi (2013) Tarasova, T. N., & Shakhovskoi, D. N. 2013, ATel. No. 5370
- Tomov et al. (2013) Tomov, T., Ilkiewicz, K., Swierczynski, E., Belcheva, M., & Dimitrov, D. 2013, ATel. No. 5288
- Warner (2008) Warner, B. 2008, in Classical novae, M. F. Bode, & A. Evans (eds.), (Cambridge: CUP), p. 16