The role of major mergers in the size growth of intermediate-mass spheroids
Abstract
We study of the role of ‘major’ mergers (mass ratios ) in driving size growth in high-redshift () spheroidal galaxies (SGs) with stellar masses between M⊙ and M⊙. This is a largely unexplored mass range at this epoch, containing the progenitors of more massive SGs on which the bulk of the size-evolution literature is based. We visually split our SGs into systems that are relaxed and those that exhibit tidal features indicative of a recent merger. Numerical simulations indicate that, given the depth of our images, only tidal features due to major mergers will be detectable at these epochs (features from minor mergers being too faint), making the disturbed SGs a useful route for estimating major-merger-driven size growth. The disturbed SGs are offset in size from their relaxed counterparts, lying close to the upper envelope of the local size – mass relation. The mean size ratio of the disturbed SGs to their relaxed counterparts is 2. Combining this observed size growth with empirical major-merger histories from the literature suggests that the size evolution of a significant fraction (around two-thirds) of SGs in this mass range could be driven by major mergers. If, as is likely, our galaxies are progenitors of more massive ( M⊙) SGs at , then major mergers are also likely to play an important role in the size growth of at least some massive SGs in this mass range.
keywords:
galaxies: formation – galaxies: evolution – galaxies: high-redshift – galaxies: interactions – galaxies: elliptical and lenticular, cD1 Introduction
Massive spheroidal galaxies (SGs) dominate the local stellar mass density (e.g. Kaviraj, 2014), making them unique probes of galaxy evolution over cosmic time. Consensus has recently moved away from the classical notion that SGs are old and passively-evolving systems. While spectro-photometric studies have revealed widespread recent star formation and a surprising diversity of formation epochs (e.g. Kaviraj et al., 2007; Kaviraj et al., 2008; Trager et al., 2008), structural studies have indicated strong size evolution, with SGs at being 3–5 times smaller than their counterparts today (e.g. Daddi et al., 2005; Trujillo et al., 2006; Buitrago et al., 2008; Cimatti et al., 2012; Ryan et al., 2012; Huertas-Company et al., 2013).
While SG sizes do increase over cosmic time, the processes that drive this evolution remain debated. Various theoretical scenarios have been proposed to explain the size growth, including dry major and minor merging (e.g. Bournaud et al., 2007; Oser et al., 2012) and secular mechanisms, such as adiabatic expansion driven by stellar mass loss or strong AGN feedback (e.g. Fan et al., 2008; Damjanov et al., 2009, but see e.g. Trujillo et al. 2011), with the bulk of the literature focussing on the evolution of massive (M M⊙) spheroids. Recent work indicates that, in this mass range (and particularly in the redshift range ), the combination of major and minor mergers may account for much of the size growth (e.g. Bluck et al., 2012; Newman et al., 2012; López-Sanjuan et al., 2012), although some of the observed size evolution is driven by the appearance of large newly-quenched galaxies - the so-called ‘progenitor bias’ (e.g. van der Wel et al., 2009; Carollo et al., 2013).
While theoretical explanations based on merging have been proposed to explain SG size evolution, it is clearly desirable to have an empirical estimate of size growth that can be induced by merging, at the epoch where much of the growth is expected to take place (). This is particularly useful for the mass range M M⊙ which is not typically the focus of the bulk of the literature. Such an empirical estimate is both a useful observational result and a quantitative constraint on merger-driven scenarios that aim to explain the size evolution of the SG population in this mass range.
The identification of SGs and measurement of their sizes at greatly benefits from Hubble Space Telescope (HST) imaging in the near-infrared (NIR). At these epochs, the NIR corresponds to the rest-frame optical, which traces the underlying stellar population of the galaxy and not just the UV-emitting star-forming regions. New NIR surveys using HST’s Wide Field Camera 3 (WFC3), such as the WFC3 Early-Release Science (ERS) programme (Windhorst et al., 2011), are providing unprecedented large-scale access to NIR data at , making them ideal datasets for such a study. In this Letter, we use 80 SGs at , drawn from the ERS, to calculate an empirical estimate of size growth due to mergers with mass ratios 1:4 (‘major’ mergers) and explore the proportion of SG size evolution that may be attributable to the major-merger process in the stellar mass range M⊙ M⊙. This is an unexplored mass range at this epoch, containing the progenitors of more massive galaxies, on which the SG size-evolution literature is largely based.
Kaviraj et al. (2013, see their §4) have recently used hydrodynamical simulations to show that the presence of tidal features around ERS galaxies in the redshift range indicates a recent major merger (mass ratios 1:4). The ERS images are too shallow to reveal the fainter tidal features produced by minor mergers. Thus, separating the ERS SGs into those that are relaxed and those that are tidally disturbed provides a route to estimating the structural impact of major mergers on these systems. While we cannot track the evolution of individual galaxies, we can use the relaxed and disturbed SG populations as a whole to derive a mean statistical estimate of the size growth induced by the major-merger process. Combining this with the typical major-merger histories of massive galaxies then enables us to explore the potential contribution of this process to SG size evolution over cosmic time.
This Letter is organised as follows. In §2, we describe the ERS galaxy sample used in this study, the selection of relaxed and disturbed SGs via visual inspection and the derivation of galaxy stellar masses, rest-frame photometry and sizes that underpin our analysis. In §3, we explore the effective radii of galaxies in these two SG subpopulations and discuss the role of major mergers in driving size growth. We summarise our results in §4. Throughout, we employ the WMAP7 cosmological parameters (Komatsu et al., 2011) and photometry in the AB system (Oke & Gunn, 1983).
2 Data
2.1 The WFC3 Early-Release Science programme
The WFC3 ERS programme has imaged around one-third of the GOODS-South field (Giavalisco et al., 2004) using the UVIS and IR channels of the WFC3, with a total exposure time of 104 orbits. The observations, data reduction, and instrument performance are described in detail in Windhorst et al. (2011) and summarised here. The UVIS data (40 orbits) covers 55 arcmin2, in each of the F225W, F275W and F336W filters, with relative exposure times of 2:2:1. The NIR data (60 orbits) covers 45 arcmin2 using the F098M (), F125W (), and F160W () filters, with equal exposure times of 2 orbits per filter. Together, the data provide 10-band HST panchromatic coverage over 0.2 - 1.7 m, with 5 point-source depths of mag and mag in the UV and NIR respectively.
In this paper we study 80 SGs in the ERS that are brighter than and have either spectroscopic or photometric redshifts in the range . Photometric redshifts are calculated by applying the EAZY code (Brammer et al., 2008) on the 10-band WFC3/ACS photometric catalogue. Spectroscopic redshifts are drawn from the literature, from spectra taken using the Very Large Telescope (Le Fèvre et al., 2004; Szokoly et al., 2004; Popesso et al., 2009), the Keck telescopes (Strolger et al., 2004) and the HST ACS grism (Daddi et al., 2005; Pasquali et al., 2006). For the analysis that follows, spectroscopic redshifts (available for 14% of our galaxies) are always used where available.
2.2 Selection of spheroids via visual inspection
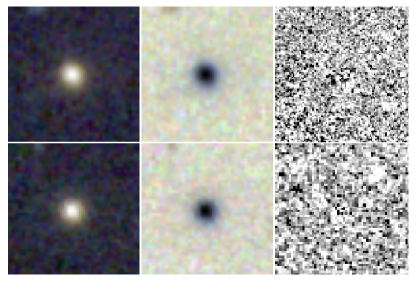
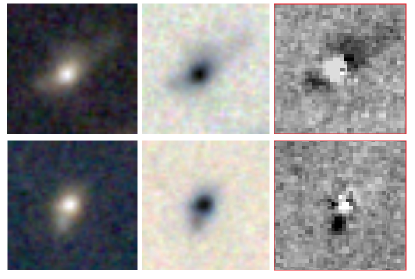
Following Kaviraj et al. (2013), SGs are selected via visual inspection of composite images, scaled using the asinh method of Lupton et al. (2004). Using multi-filter composites – instead of monochrome images – maximises the rest-frame optical information in the image, facilitating the identification of tidal features. We restrict our study to galaxies brighter than . Past work that has used visual inspection of HST images for morphological classification has typically employed rest-frame optical imaging with similar or fainter surface-brightness limits compared to the images employed here (e.g. Robaina et al., 2009; Kaviraj et al., 2011). Where appropriate, we flag the presence of tidal features, thus splitting our sample into ‘relaxed’ SGs (R-SGs) and ‘disturbed’ SGs (D-SGs). As mentioned in the introduction, the D-SGs are likely to have experienced recent major mergers, since the ERS images are not deep enough to reveal the fainter tidal features produced by minor mergers in the redshift range . Figures 1 and 2 show images of typical R-SGs and D-SGs respectively. Note that our D-SGs do not include ‘close pair’ systems, where there are two well-separated galaxies that have not yet coalesced.
2.3 Stellar masses and rest-frame photometry
Stellar masses and rest-frame photometry are calculated via spectral energy distribution (SED) fitting. The WFC3/ACS photometry of each individual galaxy is compared to a large library of synthetic photometry, constructed using exponentially-decaying star formation histories (SFHs), each described by a stellar mass (), age (), e-folding timescale (), metallicity () and internal extinction (). We vary between 0.05 Gyrs and the look-back time to in the rest-frame of the galaxy, between 0.01 Gyrs (approximately an instantaneous burst) and 9 Gyrs (approximately constant star formation), between 0.1 Z⊙ and 2.5 Z⊙ and between 0 and 1 mag. Synthetic magnitudes are generated by folding the model SFHs with the stellar models of Bruzual & Charlot (2003) through the correct WFC3 and ACS filter throughputs(assuming a Chabrier initial mass function), with dust attenuation applied following Calzetti et al. (2000). The likelihood of each model, , is calculated using the value of , computed in the standard way. Estimates for the free parameters such as stellar mass are derived by marginalising each parameter from the joint probability distribution, to extract its one-dimensional probability density function (PDF). We use the median of this PDF as the best estimate of the parameter in question, with the 25 and 75 percentile values (which enclose 50% of the probability) yielding an associated uncertainty. The derived stellar masses are uncertain by 0.2 dex. The K-corrections required to construct rest-frame photometry for each galaxy are calculated using the best-fit model SED (i.e. where the value of is a minimum).
2.4 Sizes
Galaxy effective radii () are calculated via the WFC3 F160W images, using GALAPAGOS (Barden et al., 2012), an IDL-based pipeline for running SEXTRACTOR (Bertin & Arnouts, 1996) and GALFIT (Peng et al., 2002) together. Individual galaxies are fitted with a 2D Sersic profile, using the default GALAPAGOS parameters (see Häussler et al., 2007). We use circularised radii as our size estimator.
It is important to ensure that the faint tidal features around our D-SGs are not affecting their fitted sizes. While the features are brighter than the background (especially in the co-added images) and thus detectable by eye, they host a negligible fraction (a few percent) of the total luminosity of the system. As the residuals in Figure 2 show, the tidal features do not get included in the model fits and thus do not affect the derived effective radii. This is reflected in the lack of a trend between and the physical extent of the features, again indicating that they do not affect the measured sizes. In Figure 3, we demonstrate these points more explicitly, by presenting the flux profiles of a D-SG that has strong tidal features extending to several effective radii. If the effective radius was being overestimated due to the tidal features, then the fitted model profiles would be broader than that of the original galaxy. However, regardless of whether profiles are plotted perpendicular to (top right & bottom left) or along (bottom right) the tidal features, it is clear that the model profiles are not preferentially broader, consistent with the fact that the faint features are not included in the model fits. This behaviour is the same for all D-SGs in our sample and is essentially due to the fact that the total luminosity in the features is a negligible fraction of that in the whole system. Note that the fluxes in Figure 3 are shown on a log scale.
It is worth noting here that past size-evolution studies typically do not consider the effect of tidal features, which become increasingly common at higher redshift, especially at (e.g. Kaviraj et al., 2013). Nevertheless, our analysis indicates that the derived values in such studies are also likely to be reliable.
3 The role of major mergers in driving size growth in spheroids
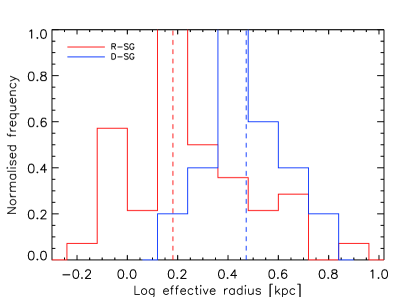
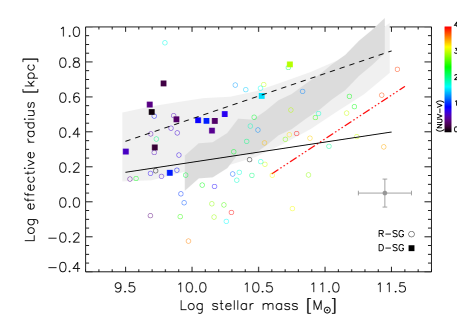
In Figure 4 we present the size distribution of the D-SG and R-SG populations. The R-SGs are restricted to the D-SG mass range (M⊙). Not unexpectedly, D-SGs are larger than their relaxed counterparts. The difference in the median values of the two distributions is a factor of 2. Since our SGs span a range in stellar mass, we plot, in Figure 5, the effective radius as a function of stellar mass. Circles represent R-SGs and squares represent D-SGs. The colour coding indicates the star-formation-sensitive rest-frame colour. The filter, taken from the GALEX filterset, is centred at 2300 Å. The light and dark grey shaded areas indicate the region occupied by local SGs, taken from Shen et al. (2003) and Bernardi et al. (2012) respectively. The measured sizes of our SGs are similar to those in previous studies that have probed similar masses and epochs (see e.g. Damjanov et al., 2011; Cimatti et al., 2012; Newman et al., 2012; Cassata et al., 2013). We indicate the best-fit line from Newman et al. (2012) using a red dashed dotted line and note that the low-mass end of the size-mass relation (which is the focus of our study) appears to be consistent with the high-mass end that has been studied in the recent literature.
Notwithstanding the scatter in the - relation, the D-SGs cluster towards the upper envelope of the relation, largely independent of stellar mass. To estimate major-merger-driven size growth, we first calculate linear best fits to the D-SGs and R-SGs (dashed and solid lines respectively), restricted to the D-SG mass range (M⊙). The difference between these linear fits then offers a mean statistical estimate of the size growth plausibly induced by the major-merger process. We find a size growth of around a factor of 2, with a weak trend with stellar mass.
The D-SG population is consistent with the upper envelope of the local size-mass relation, indicating that in the mass range considered here, major mergers may play a significant role in bringing at least some SGs onto the local size-mass relation. Combining the observed (factor x2) size growth with the expected major-merger history of SGs enables us to further explore the size evolution induced by this process on the SG population as a whole. Empirical estimates of the major-merger history indicate, on average, 0.3 major mergers after (e.g. López-Sanjuan et al., 2009; Lotz et al., 2011). Given the redshift of the systems studied here, one expects around a third of the SGs to experience around one more major merger as they evolve to the present day. Of the 60 SGs in this mass range, 13 D-SGs and 20 R-SGs are already consistent with the local relation. 22 R-SGs are below the local relation - if 30% of these undergo a major merger at and experience a factor 2 size increase, then a further 7 SGs will end up being consistent with the local relation. This implies that, for a reasonably high fraction (40/60 = 66%) of SGs in this mass range, major mergers could have played a significant role in their cosmic size evolution.
This process will also move the descendants of some our D-SGs into the mass selection typically employed in size-evolution studies ( M⊙). As noted in the introduction, recent work on the evolution of the SG mass-size relation indicates that, to produce the observed size growth in the M⊙ regime, one requires new, systematically larger systems to directly enter this mass selection at (‘progenitor bias’, see e.g. Newman et al., 2012; Carollo et al., 2013; Patel et al., 2013). Some of our D-SGs are natural candidates for being the progenitors of these new systems, implying that the size evolution of at least some local SGs with M⊙ could also be heavily influenced by major mergers alone.
It is worth noting here that the D-SGs are bluer than their relaxed counterparts in , indicating that the major mergers that produced their tidal features were not completely dry. From an empirical standpoint this is expected, since all galaxies at these redshifts host some star formation. For example, Kaviraj et al. (2013) have used rest-frame UV-optical colours to show that none of the massive galaxies at these epochs, not even SGs, are consistent with passively-evolving populations. Thus, while theoretical work often invokes ‘dry’ (gas-free) merging, typically based on spheroid-spheroid interactions, to explain size growth, observational studies indicate that merger events (major or minor) at these epochs are not dry. Nevertheless, the colours of our D-SGs indicate that major mergers that are not completely gas-free are also capable of increasing SG sizes by factors of 2.
In this context it is also worth noting that major mergers involving high gas fractions (e.g. 30%) may create remnants that have substantial disk components (e.g. Hopkins et al., 2009). It is, therefore, instructive to explore whether our D-SGs will indeed eventually join the R-SG population, or whether some of these systems may end up as disky remnants. While a robust answer requires a direct measurement of the cold gas mass, from e.g. ALMA, some qualitative insight can be gained by assuming that the D-SGs follow the global Schmidt-Kennicutt law:
| (1) |
where is the star formation rate, is the star formation efficiency, is the dynamical timescale of the system and is the mass of the cold gas reservoir.
Using the SED-fitted SFRs and stellar masses for our D-SGs, we ‘invert’ the Schmidt-Kennicutt law, assuming = 0.1 Gyrs (which seems reasonable for systems at this redshift, see e.g. Hopkins et al. 2009), which yields a value for . Dividing by the stellar mass then yields an estimate of the gas fraction for each D-SG. The values we derive are all less than 10%. In this regime disk regrowth is unlikely, implying that the D-SGs studied here are likely to join the R-SG population when the tidal features due to the recent merger fade. It is worth noting that the factor of 2 size increase is then consistent with the expectation of theoretical work that also assumes gas-poor progenitors (e.g. Ciotti et al., 2007; Naab et al., 2009; Hilz et al., 2012).
Finally, although our D-SGs are, by construction, ‘post-merger’ systems, it is useful to study the morphological properties of their progenitor systems, which could either be a major merger between two spirals or one between a spiral and an SG. Late-type galaxies are typically several factors larger than their early-type counterparts (see e.g. van der Wel et al., 2014). While mergers between late-type galaxies are expected to produce remnants that are somewhat smaller than their progenitors, the reduction in size (10-20%, e.g. Cox et al. 2006) does not appear sufficient to produce remnants that are close to the early-type population. The estimated gas fractions of less than 10% in our D-SGs also indicate that they are inconsistent with gas-rich major mergers between late-type galaxies, that are likely to leave remnants that are more gas-rich (e.g. Hopkins et al., 2009). It is likely, therefore, that the progenitor systems of our D-SGs were typically major mergers between an SG and a spiral (late-type) system of similar mass.
4 Summary
We have studied the structural properties of intermediate-mass ( M⊙ M⊙), high redshift () spheroidal galaxies (SGs) in the WFC3 Early-Release Science programme, to derive an empirical estimate for the size growth induced by the major-merger process in this mass range. We have visually split our SG sample into galaxies that are relaxed and those that exhibit tidal features indicative of a recent merger. Numerical simulations indicate that, given the depth of the ERS images, only tidal features due to major mergers (mass ratios ) are likely to be visible in the redshift range (features due to more minor mergers being too faint for detection). In other words, the tidally ‘disturbed’ SGs (D-SGs) that exhibit such features have experienced a recent major merger, making them a valuable set of objects with which to empirically estimate the structural impact of the major-merger process.
We find that the D-SGs are offset in size from their relaxed counterparts, lying towards the upper envelope of the radius () – stellar mass () relation at these epochs, indicating that in the mass range considered here, major mergers may play a significant role in bringing at least some SGs onto the local size-mass relation. The median ratio of the effective radii of the D-SGs to that of their relaxed counterparts is 2, with a weak trend with galaxy stellar mass. It is worth noting that, while models typically invoke dry mergers to explain size growth, empirical work, such as the one presented here, indicates that major-merger remnants at these epochs are not completely dry. While our estimates of the gas fraction in these systems indicates values less than around 10%, our results indicates that such wet mergers at these redshifts are capable of inducing size growth of around a factor of 2, at least in the mass range studied here. The low gas fractions, combined with the comparative position of late-type galaxies on the size-mass relation, suggests that our D-SGs are remnants of major mergers between SGs and spirals, and will transform into relaxed SGs when their tidal features fade.
We have combined the observed (factor x2) size growth with the expected major-merger history of SGs to study how the major merger process may affect SG size evolution in our mass range of interest. Estimates of the major-merger history indicate, on average, 0.3 major mergers after . Given the redshift of the systems studied here, we have estimated that at , around two-thirds of SGs within our mass range could have had their size evolution driven primarily by major mergers alone.
Acknowledgements
We are grateful to the anonymous referee for a useful report which improved the original manuscript. We thank Ignacio Trujillo, Emanuele Daddi, Chris Conselice and Richard Ellis for interesting discussions. S.K. acknowledges a Senior Research Fellowship from Worcester College Oxford. This paper is based on Early Release Science observations made by the WFC3 Scientific Oversight Committee. We are grateful to the Director of the STScI for awarding Director’s Discretionary time and deeply indebted to the brave astronauts of STS-125 for rejuvenating HST. Support for HST program 11359 was provided by NASA, through grant GO-11359 from the STScI, which is operated by the Association of Universities for Research in Astronomy, Inc., under NASA contract NAS 5-26555. R.A.W. acknowledges support from NASA JWST Interdisciplinary Scientist grant NAG5-12460 from GSFC.
References
- Barden et al. (2012) Barden M., Häußler B., Peng C. Y., McIntosh D. H., Guo Y., 2012, MNRAS, 422, 449
- Bernardi et al. (2012) Bernardi M., Meert A., Vikram V., Huertas-Company M., Mei S., Shankar F., Sheth R. K., 2012, ArXiv e-prints
- Bertin & Arnouts (1996) Bertin E., Arnouts S., 1996, A&A Suppl., 117, 393
- Bluck et al. (2012) Bluck A. F. L., Conselice C. J., Buitrago F., Grützbauch R., Hoyos C., Mortlock A., Bauer A. E., 2012, ApJ, 747, 34
- Bournaud et al. (2007) Bournaud F., Jog C. J., Combes F., 2007, A&A, 476, 1179
- Brammer et al. (2008) Brammer G. B., van Dokkum P. G., Coppi P., 2008, ApJ, 686, 1503
- Bruzual & Charlot (2003) Bruzual G., Charlot S., 2003, MNRAS, 344, 1000
- Buitrago et al. (2008) Buitrago F., Trujillo I., Conselice C. J., Bouwens R. J., Dickinson M., Yan H., 2008, ApJL, 687, L61
- Calzetti et al. (2000) Calzetti D., Armus L., Bohlin R. C., Kinney A. L., Koornneef J., Storchi-Bergmann T., 2000, ApJ, 533, 682
- Carollo et al. (2013) Carollo C. M., et al. 2013, ApJ, 773, 112
- Cassata et al. (2013) Cassata P., et al. 2013, ApJ, 775, 106
- Cimatti et al. (2012) Cimatti A., Nipoti C., Cassata P., 2012, MNRAS, 422, L62
- Ciotti et al. (2007) Ciotti L., Lanzoni B., Volonteri M., 2007, ApJ, 658, 65
- Cox et al. (2006) Cox T. J., Dutta S. N., Di Matteo T., Hernquist L., Hopkins P. F., Robertson B., Springel V., 2006, ApJ, 650, 791
- Daddi et al. (2005) Daddi E., et al. 2005, ApJ, 626, 680
- Damjanov et al. (2009) Damjanov I., et al. 2009, ApJ, 695, 101
- Damjanov et al. (2011) Damjanov I., et al. 2011, ApJL, 739, L44
- Fan et al. (2008) Fan L., Lapi A., De Zotti G., Danese L., 2008, ApJL, 689, L101
- Giavalisco et al. (2004) Giavalisco M., et al. 2004, ApJ, 600, L93
- Häussler et al. (2007) Häussler B., et al. 2007, ApJS, 172, 615
- Hilz et al. (2012) Hilz M., Naab T., Ostriker J. P., Thomas J., Burkert A., Jesseit R., 2012, MNRAS, 425, 3119
- Hopkins et al. (2009) Hopkins P. F., Bundy K., Murray N., Quataert E., Lauer T. R., Ma C.-P., 2009, MNRAS, 398, 898
- Huertas-Company et al. (2013) Huertas-Company M., et al. 2013, MNRAS, 428, 1715
- Kaviraj et al. (2007) Kaviraj S., et al. 2007, ApJS, 173, 619
- Kaviraj et al. (2013) Kaviraj S., et al. 2013, MNRAS, 428, 925
- Kaviraj (2014) Kaviraj S., 2014, MNRAS, 437, L41
- Kaviraj et al. (2008) Kaviraj S., Khochfar S., Schawinski K., et al. 2008, MNRAS, 388, 67
- Kaviraj et al. (2011) Kaviraj S., Tan K.-M., Ellis R. S., Silk J., 2011, MNRAS, 411, 2148
- Komatsu et al. (2011) Komatsu E., et al. 2011, ApJS, 192, 18
- Le Fèvre et al. (2004) Le Fèvre O., et al. 2004, A&A, 417, 839
- López-Sanjuan et al. (2012) López-Sanjuan C., et al. 2012, A&A, 548, A7
- López-Sanjuan et al. (2009) López-Sanjuan C., Balcells M., Pérez-González P. G., Barro G., García-Dabó C. E., Gallego J., Zamorano J., 2009, A&A, 501, 505
- Lotz et al. (2011) Lotz J. M., Jonsson P., Cox T. J., Croton D., Primack J. R., Somerville R. S., Stewart K., 2011, ApJ, 742, 103
- Lupton et al. (2004) Lupton R., Blanton M. R., Fekete G., Hogg D. W., O’Mullane W., Szalay A., Wherry N., 2004, PASP, 116, 133
- Naab et al. (2009) Naab T., Johansson P. H., Ostriker J. P., 2009, ApJ, 699, L178
- Newman et al. (2012) Newman A. B., Ellis R. S., Bundy K., Treu T., 2012, ApJ, 746, 162
- Oke & Gunn (1983) Oke J. B., Gunn J. E., 1983, ApJ, 266, 713
- Oser et al. (2012) Oser L., Naab T., Ostriker J. P., Johansson P. H., 2012, ApJ, 744, 63
- Pasquali et al. (2006) Pasquali A., et al. 2006, ApJ, 636, 115
- Patel et al. (2013) Patel S. G., et al. 2013, ApJ, 766, 15
- Peng et al. (2002) Peng C. Y., Ho L. C., Impey C. D., Rix H.-W., 2002, AJ, 124, 266
- Popesso et al. (2009) Popesso P., et al. 2009, A&A, 494, 443
- Robaina et al. (2009) Robaina A. R., Bell E. F., Skelton R. E., et al. 2009, ApJ, 704, 324
- Ryan et al. (2012) Ryan Jr. R. E., et al. 2012, ApJ, 749, 53
- Shen et al. (2003) Shen S., et al. 2003, MNRAS, 343, 978
- Strolger et al. (2004) Strolger L.-G., et al. 2004, ApJ, 613, 200
- Szokoly et al. (2004) Szokoly G. P., et al. 2004, ApJS, 155, 271
- Trager et al. (2008) Trager S. C., Faber S. M., Dressler A., 2008, MNRAS, 386, 715
- Trujillo et al. (2006) Trujillo I., et al. 2006, ApJ, 650, 18
- Trujillo et al. (2011) Trujillo I., Ferreras I., de La Rosa I. G., 2011, MNRAS, 415, 3903
- van der Wel et al. (2014) van der Wel A., et al. 2014, ArXiv e-prints
- van der Wel et al. (2009) van der Wel A., Bell E. F., van den Bosch F. C., Gallazzi A., Rix H.-W., 2009, ApJ, 698, 1232
- Windhorst et al. (2011) Windhorst R. A., et al. 2011, ApJS, 193, 27