Radio Observations of GRB Host Galaxies
Abstract
We present 5.5 and 9.0 GHz observations of a sample of seventeen GRB host galaxies at , using the radio continuum to explore their star formation properties in the context of the small but growing sample of galaxies with similar observations. Four sources are detected, one of those (GRB 100418A) likely due to lingering afterglow emission. We suggest that the previously-reported radio afterglow of GRB 100621A may instead be due to host galaxy flux. We see no strong evidence for redshift evolution in the typical star formation rate of GRB hosts, but note that the fraction of ‘dark’ bursts with detections is higher than would be expected given constraints on the more typical long GRB population. We also determine the average radio-derived star formation rates of core collapse supernovae at comparable redshift, and show that these are still well below the limits obtained for GRB hosts, and show evidence for a rise in typical star formation rate with redshift in supernova hosts.
keywords:
galaxies: star formation – radio continuum: galaxies1 Introduction
Long Gamma Ray Bursts (GRBs) are potentially a valuable probe of star forming galaxies. Arising from the core collapse of a massive star (e.g. Woosley & Heger, 2006), they indicate the presence of recent star formation and are typically associated with the most intensely star forming region of their host galaxies (Fruchter et al., 2006; Svensson et al., 2010). Optical and ultraviolet observations of those hosts galaxies have suggested that these tend to be relatively low in metallicity (e.g. Graham & Fruchter, 2013) and mass (e.g. Castro Cerón et al., 2010), with modest star formation rates (e.g. Christensen, Hjorth, & Gorosabel, 2004; Savaglio, Glazebrook, & LeBorgne, 2009). Thus they allow the selection and study of a galaxy population that may represent the low mass tail of the ultraviolet-selected, high redshift Lyman break galaxy luminosity function, and could plausibly dominate the ionising photon density of the Universe at early times (Chen et al., 2009; Tanvir et al., 2012).
If GRBs are an unbiased tracer of star formation, then they would be expected to occur in the galaxies dominating the star forming population at a given redshift. The phenomenon of ‘downsizing’ (Cowie et al., 1996) describes the tendency of star forming galaxies at low redshifts to be lower in mass, and also in metallicity, than the bulk of the galaxy population. Local radio surveys suggest that the majority of star formation at occurs in a narrow range of radio luminosities, corresponding to star formation rates of 1.5-15 M⊙ yr-1 (Condon, Cotton, & Broderick, 2002). More massive galaxies formed their stars at earlier times, typically at , and often at a higher specific star formation rate than is seen in the local Universe (see, for example, Cowie et al., 2004; Hopkins et al., 2010, and references therein). Thus the peak in the volume-averaged cosmic star formation rate, in AGN activity (indicative of co-evolution of spheroids) and in the number density of obscured starbursts such as submillimeter galaxies (Chapman et al., 2005) all occur at , and the mass and luminosity of a typical starburst decrease sharply towards .
However, there are indications that the host galaxies of GRBs do not necessarily trace this evolving, typical star forming population, but rather that the occurence of a GRB may be likely in galaxies with certain physical properties regardless of redshift (see Levesque, 2014, for a recent review). Extensive work in the optical and near-infrared has now produced a reasonably clear picture of the stellar populations in GRB hosts, in those examples sufficiently close to carry out a detailed analysis (e.g. Savaglio, Glazebrook, & LeBorgne, 2009; Svensson et al., 2010) and in samples designed to have well understood completeness and selection effects (e.g. the ‘TOUGH’ sample, Hjorth et al., 2012; Michałowski et al., 2012).
By fitting the spectral energy distribution of a sample of host galaxies, Savaglio, Glazebrook, & LeBorgne (2009) found no evidence for evolution in host galaxy specific star formation rate or metallicity in the redshift interval , although available metallicity information was limited to damped Lyman- system measurements at . Salvaterra et al. (2012) did find evidence for a strong evolution in either the luminosity or density distribution of GRB hosts and attributed this to a metallicity dependence in the GRB progenitor population.
While Svensson et al. (2010) did not consider redshift evolution, they compared GRB host locations to those of the core-collapse supernova population (which should also trace star formation) and found that the former occupy galaxies with higher optical surface brightness but less mass and smaller radii, as also suggested by Fruchter et al. (2006) and others. Work on supernovae themselves also support this. GRBs have been observationally associated with type Ic supernovae (Galama et al., 1998) but not with other types, and may well trace only a part of the Ic population, with additional constraints (e.g. on the progenitor rotation) necessary to generate a GRB. In local supernova samples, SNe Ic occur in more metal rich, exceptionally star forming galaxies, compared to the hosts of other core collapse supernovae (Kelly & Kirshner, 2012), strengthening the case for GRBs picking out some subset of the full star forming galaxy population.
However this conclusion is by no means undisputed. As Coward et al. (2013) point out, a large number of observational selection effects as well as astrophysical biases must be taken into account. Initial suggestions that the GRB host population may show a sharp metallicity cut-off (e.g. Salvaterra et al., 2012; Kocevski, West, & Modjaz, 2009) have been moderated by the detection of higher metallicity systems (e.g. Levesque et al., 2010a; Krühler et al., 2012) with a more gradual metallicity-dependent fall off in GRB rate now suggested (e.g. Kocevski & West, 2011; Robertson & Ellis, 2012, and references therein). While some recent studies conclude that GRBs show a pronounced aversion to high metallicity (e.g. Graham & Fruchter, 2013), there are also those who believe no such dependence exists. Studies of the GRB host galaxy mass function and long GRB burst rate, based on a large sample observed by the GROND team, have suggested that no obvious biases in the host galaxy properties with metallicity, mass or redshift (Elliott et al., 2012) can be inferred, leaving this still very much an open question.
So, if the degree to which the properties of GRB hosts track those of the typical star forming galaxy at a given redshift is uncertain, converting a gamma ray burst rate to a volume averaged star formation density (and hence to the ionizing photon density vital for, amongst other things, hydrogen and helium reionisation) is fraught with difficulties and assumptions. Not only is the detection of bursts, their follow-up and redshift confirmation, rather an erratic process, with a difficult to establish completion function (see Fynbo et al., 2009; Hjorth et al., 2012; Krühler et al., 2012), but the derived star formation rates rely on prescriptions relating the observed death of a single massive star in each host galaxy to the stellar birth rate (e.g. Robertson & Ellis, 2012).
Even studies to characterise GRB host samples in the optical are subject to their own selection biases, such as the possibility that some GRB host galaxies may be characterised by a significant quantity of dust and obscured star formation and hence omitted. Early sub-millimeter and radio observations suggested that as many as a third of GRBs could arise in these dusty and relatively massive systems (Berger et al., 2003; Priddey et al., 2006; Tanvir et al., 2004). The definition of a population of ‘Dark GRBs’ with low optical emission relative to their X-ray flux (Jakobsson et al., 2004) again strengthened earlier suggestions that dust extinction may play a role that must be understood in the interpretation of these sources (e.g. see discussion in Groot et al., 1998; Djorgovski et al., 2001; Rol et al., 2005; Cenko et al., 2009; Greiner et al., 2011, and references therein). Including this ‘dark’ population leads to determining a much higher average dust content in the GRB host population than previously believed, but is still insufficient to explain the early submillimeter results (Perley et al., 2013). Studies of the lowest redshift bursts (Stanway, Davies, & Levan, 2010) and other more recent work (e.g. Hunt et al., 2014; Perley & Perley, 2013; Michałowski et al., 2012; Wang, Chen, & Huang, 2012) has suggested that the typical GRB host galaxy does not in fact host large quantities of extinguished star formation.
As a result, samples of GRBs with measured radio fluxes remain small, with early work focused on detailed studies of individual targets (e.g. Kohno et al., 2005; Michałowski et al., 2009; Stanway et al., 2011). Recent work by Michałowski et al. (2012) represented a substantial improvement in the sample of GRB hosts observed in the radio, presenting observations for 22 sources, including those derived from the ‘TOUGH’ sample (Hjorth et al., 2012) and sources compiled from the literature. Of these, three were detected. While the constraints placed on individual sources varied significantly from object to object, a stacking analysis based on the median redshift of the sample suggested that the typical undetected source may be relatively low in star formation rate (SFR15 M⊙ yr-1) and have dust extinction ( mag).
Recent improvements in correlator bandwidth, and hence sensitivity, at the major radio observatories has opened up the potential to change this, with observations reaching star formation rates within a factor of a few of the optical and ultraviolet derived values for GRB hosts now achievable with a reasonable investment of time. In this paper we extend the radio analysis of long GRB hosts to higher redshifts, and increase the number of observed sources, aiming to characterise their star formation without assumptions regarding their redshift evolution. We use the radio continuum to explore the star formation rates of the GRB host galaxies in our sample, in the context of the small but growing number of galaxies with similar observations. We present 5.5 and 9.0 GHz observations of seventeen GRB host galaxies at . Of these, radio observations of twelve sources are reported here for the first time. Of the remaining sources, four have previously been observed at 1.4 GHz (Michałowski et al., 2012). We report 5.5 GHz flux constraints and significantly improve the observed star formation rate limits in two cases, and present a tentative (2.3 ) detection at 5.5 GHz of a third source. For the final source we report a flux limit consistent with the detection reported by Perley & Perley (2013).
In section 2 we introduce observations, taken at both the Australia Telescope Compact Array (ATCA) and the Jansky Very Large Array (VLA). In section 3 we examine the two most recent bursts in detail and establish interpretation as afterglow or star formation. In section 4 we discuss the conversion from radio flux to star formation rate. In section 5 we discuss our results in the context of previous work in this field, before presenting our conclusions in section 6.
Throughout, optical magnitudes are presented in the AB system. Host galaxies are typically referred to by the name of the associated GRB, but measurements are those of the host galaxy unless otherwise specified. Where necessary, we use a standard CDM cosmology with 70 km s-1 Mpc-1, and .
2 Observations
2.1 Sample Selection
Gamma ray bursts were selected from the data compilation table111http://swift.gsfc.nasa.gov/archive/grb_table/ recording burst triggers from the Swift telescope (Gehrels et al., 2004). The primary criterion for sample selection was the existence of a known redshift for the GRB or its host galaxy, with sufficient precision to accurately derive rest-frame properties, and sufficiently low to allow useful radio constraints.
As mentioned below and discussed in section 5.3, one initial goal of our ATCA programme (see section 2.2) was to evaluate whether ‘dark bursts’ differed in their radio properties from the wider population. As a result four of the sources in this study were identified as dark bursts (lying at ), and other long GRBs at similar redshifts were preferentially selected for our ATCA observations so as to allow more direct comparison of their properties. The targets for our VLA observations (section 2.3) were chosen to lie at slightly higher redshifts, ideally at , to extend this work to earlier times and take best advantage of the higher sensitivity of the VLA.
Southern sources were prioritized so as to maximize coverage of the -plane in interferometric radio telescopes. If multiple targets satisfied these selection criteria and were accessible to the telescope during the observing programme, then the sources observed were selected at random. As a result, and given the patchy spectroscopic follow-up of bursts (particularly in the early years of the Swift mission), the sample is unlikely to be complete, but nonetheless samples the known population. All sources all satisfy the T s criterion for a ‘long’ duration gamma-ray burst (where T90 is the interval within which 90% of the integrated counts from the burst are detected Kouveliotou et al., 1993).
Our primary source for redshift information was the compilation provided in the Swift burst lookup table222http://swift.gsfc.nasa.gov/archive/grb_table/. This table is hosted by Swift and seeks to compile data on these triggers and their follow up from GCN announcement and other sources, although its data is occassionally superceded by more detailed analyses. For two sources in our sample, GRB 060814 and GRB 071003, two highly discrepant redshifts appear in the literature.
GRB 071003 was initially reported as lying at due to the presence of an absorption line system in the afterglow at this redshift (Perley et al., 2007). However reexamination of the afterglow spectrum revealed the presence of a weaker but convincingly detected line system at (Perley et al., 2008). This latter redshift is now the accepted value for this burst. While we initially selected this source for observation based on the lower redshift, we adopt the better supported value of for the analysis in this paper.
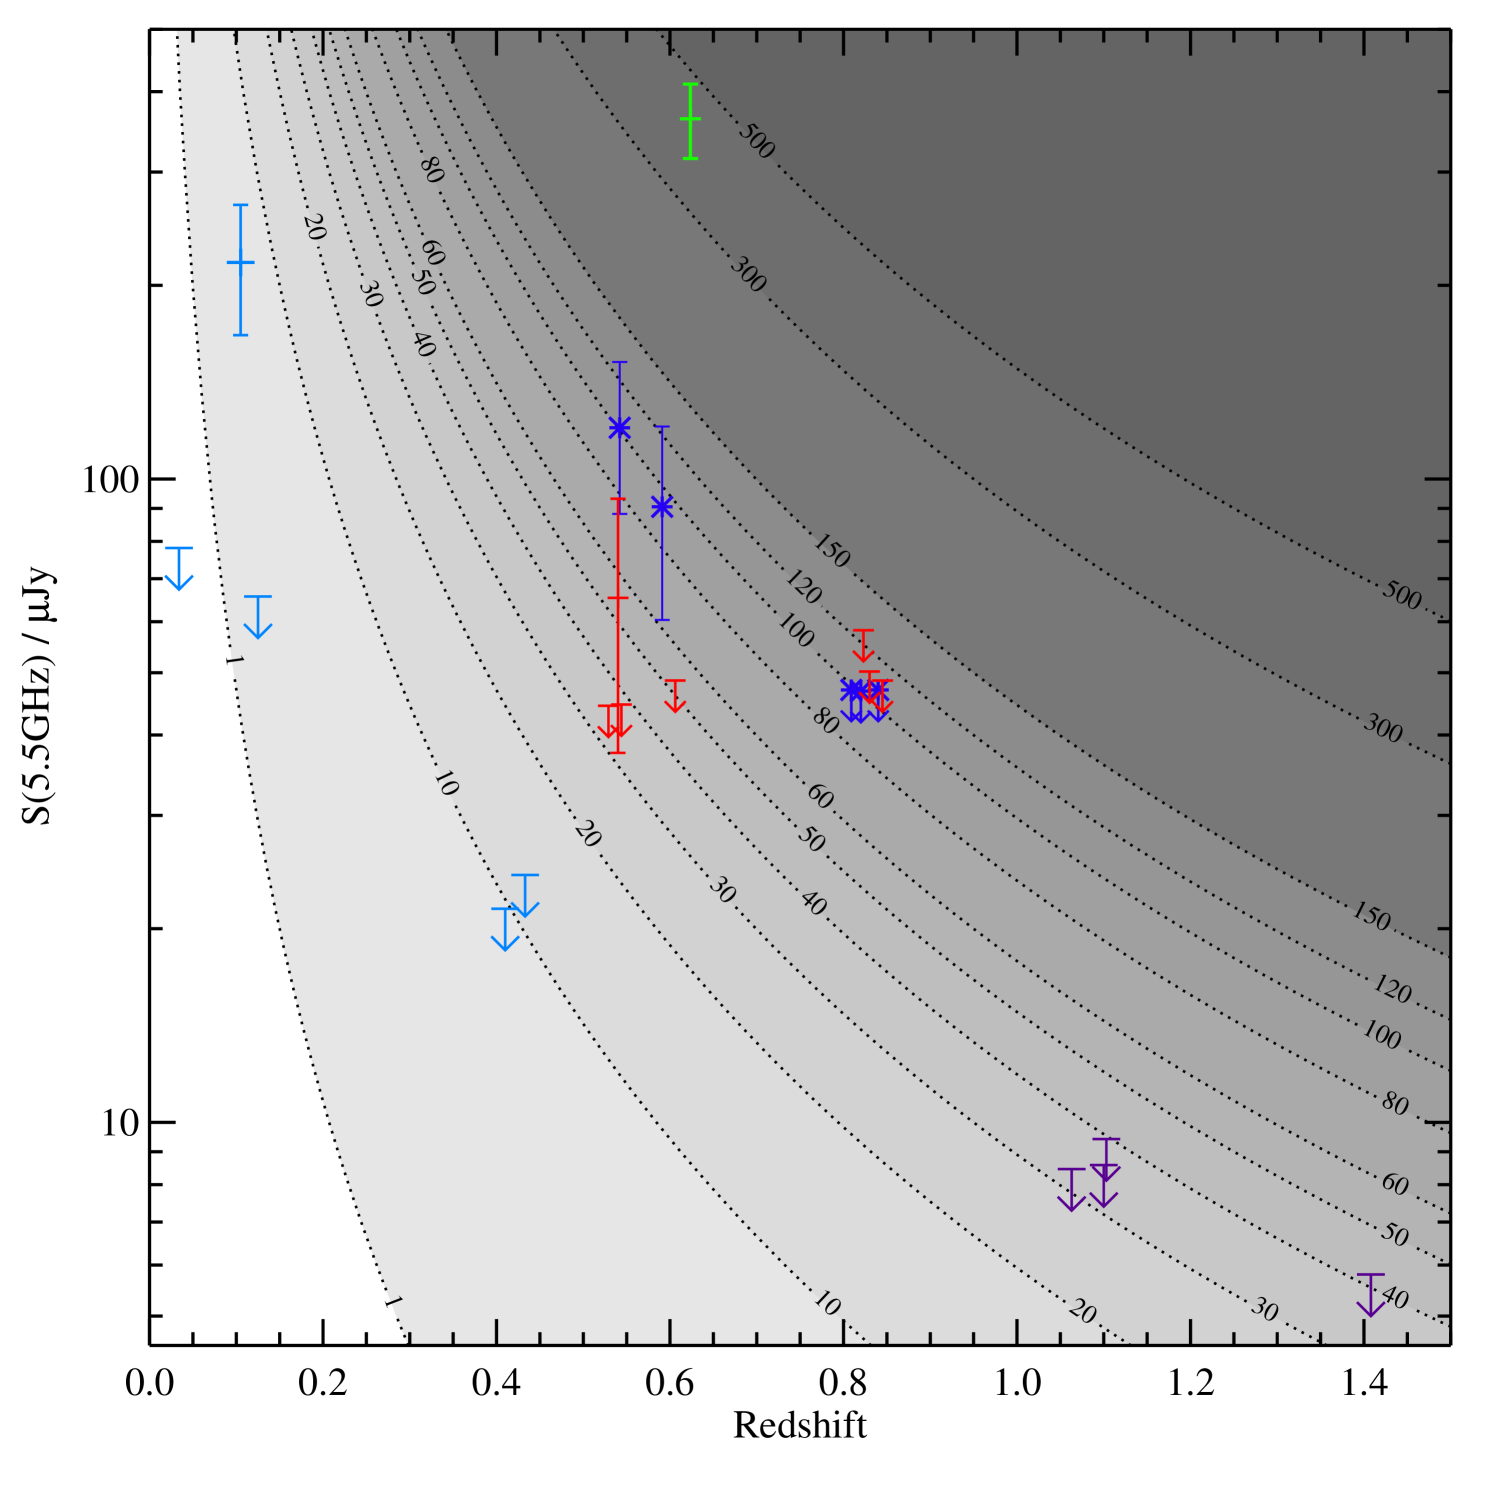
GRB 060814 was selected for follow-up based on the interpretation given in the Swift burst table, derived from Keck spectroscopy (Thoene, Perley, & Bloom, 2007) at early times and appearing in several catalog papers (e.g. Kann et al., 2010). However later observations have suggested that the faint host galaxy was misidentified and a second redshift was reported, from line detections in a star forming galaxy determined to be closer to the burst location (Salvaterra et al., 2012; Krühler et al., 2012). Throughout, we give results for the hypothesis based on the higher probability that this is the host galaxy redshift. We note that the measured flux limit would correspond to a substantially lower star formation rate if is used instead (as figure 2 illustrates). If this target were detected, it would also be subject to some uncertainty as to whether the flux arose from the GRB host, or the intervening galaxy. Due to the likely high redshift (which renders comparison with the rest of our sample problematic) and degree of ambiguity, this source is omited from statistical analyses in section 5.
2.2 ATCA Observations
Radio continuum observations of 13 GRB host galaxies were undertaken in 2011 April 15-19 using the Australia Telescope Compact Array (ATCA)333Observations associated with programme C2544. The targets for this programme were selected as Swift-detected long gamma-ray bursts lying at , based on published observations. Four targets were included which satisfy the conditions for being defined as ‘Dark GRBs’ (i.e. optically faint, see section 5.3).
Data were taken simultaneously at 5.5 and 9.0 GHz, with a correlator bandwidth of 2 GHz centered on each frequency. The telescope was in its most elongated 6A configuration, with maximum and minimum baselines of 5.938 and 0.337 km respectively, aligned East-West, and earth rotation synthesis was used to improve coverage of the -plane. Data were taken across the full range of possible hour angles, with a total on-source integration time per target of 140 minutes. A bright, compact source close on the sky to each target was used for phase calibration, and absolute flux and bandpass calibration were determined through observations of PKS 1934-638 (the standard calibrator for ATCA).
Data were reduced using the standard software package miriad (Sault et al., 1995), applying appropriate bandpass, phase and flux calibrations, and after flagging the dataset for radio frequency interference. Each band comprised 2048 channels, each of 1 MHz bandwidth. Multi-frequency synthesis images were constructed using natural weighting and the full bandwidth between the flagged edges of each band. The resulting synthesised beam depends on -plane coverage. This tends to be relatively poor for northern sources, so the beam is elongated in declination as given in table 1. The targets were placed close to the centre of the 8.5 arcmin primary beam. Given their redshifts and the typical identification of GRB hosts as relatively low mass galaxies (e.g. Svensson et al., 2010; Savaglio, Glazebrook, & LeBorgne, 2009) our GRB host targets were expected to be compact or point sources in these observations. In each image, multiple faint sources were detected, and the images were ‘cleaned’ using standard prescriptions.
The resulting 5.5 GHz synthesis images were inspected for any flux excess in close proximity to the burst or its host galaxy (where known). The typical uncertainty in the enhanced Swift XRT position for the burst (Evans et al., 2009) is 1.4 arcseconds, with a few cases where the constraints are poorer (3 arcsec). In four fields, a flux excess exceeding the typical image noise by a factor of two were observed within the XRT error circle, or coincident with a known host galaxy. Either incomplete sampling of the -plane or the presence of a bright object close to the telescope beam can leads to flux being scattered across a synthesised image in a correlated noise pattern. We inspected each target to ensure that there was no sign of large scale pattern noise that might explain a flux excess at the target location.
In order to rigourously determine the 5.5 GHz flux (or limit) for each target and its associated uncertainty, we made use of the miriad task ‘imfit’, specifying that the software attempt to fit a point source, matching the dimensions of the synthesised beam. In order to allow the most conservative limit on the host galaxy flux (i.e. the maximum value permitted by the data), we permitted the algorithm to search around the XRT position by up to twice the width of the elongated synthesised beam in Right Ascension and a beam width in declination, sufficient to encompass both the XRT error circle and any plausible uncertainty associated with bandwidth smearing or the telescope pointing algorithm. This typically resulted in a search box of , and a measured offset of peak flux from the provided coordinates of arcseconds.
For non-detections, we report the maximum permitted point source flux and its associated error (scaled by the software to account for correlated noise), based on this procedure in table 1. These represent conservative limits. The scaled errors, which account for the difficulty in determining a flux excess above the structured background noise exceed the image root-mean-square noise (often quoted as a flux uncertainty) by a factor .
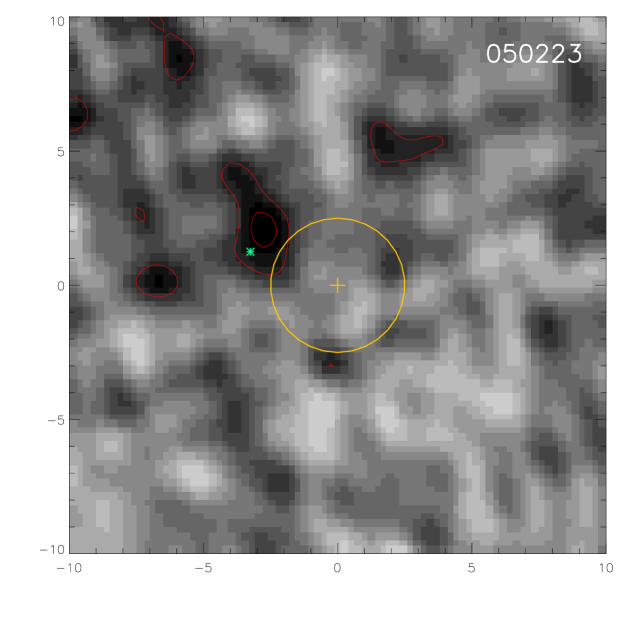
For the four sources with an identified flux excess within the search region, we explored the possibility of fitting an extended source, resulting in a poorer fit to the data in all four cases. In each case, ‘imfit’ returned a position consistent with the peak flux identified by visual inspection of the images. For consistency, and based on the large synthesised beam of the telescope at these frequencies, we report the point source flux for these objects together with the reported estimate of uncertainty in table 1, and present 5.5 GHz radio maps of these objects in figure 1.
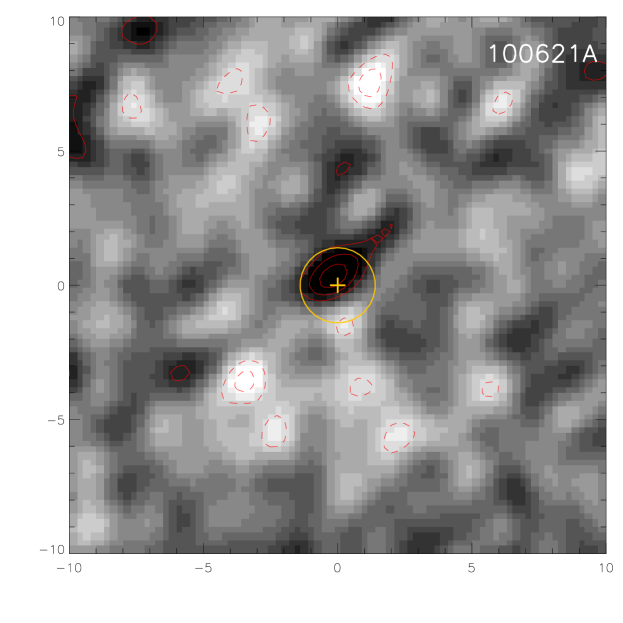
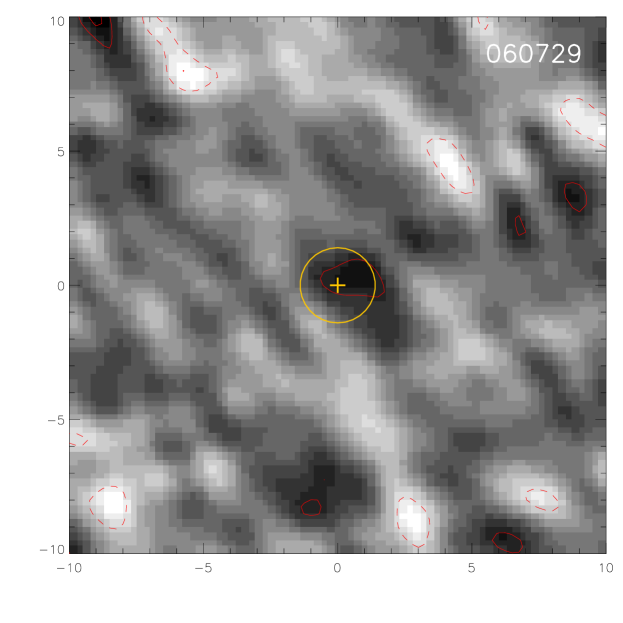
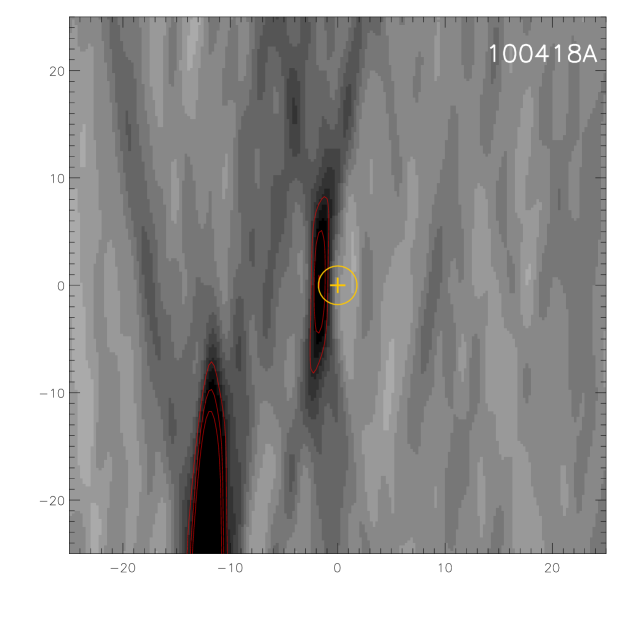
Of these objects, two (GRBs 100621A and 100418A) are well defined, clear radio detections coincident with the GRB X-ray location. A third (GRB 050223) shows a significant (3 ) point source coincident with the host galaxy identified by (Pellizza et al., 2006). The fourth source (GRB 060729) presents an excess of 2.3 over the background noise, coincident with the burst location.
While marginal as a claimed detection, this flux excess remains when the data is sub-divided, or a different weighting is used for image reconstruction. In addition to being coincident with the X-ray location, the flux excess is stronger than any of the likely noise features in its vicinity on the image, and is not straightforwardly attributable to the beam pattern extending from any other object. The probability of a noise fluctuation of this strength occuring in our search region by chance is 3%. In our sample of 17 sources (combining ATCA targets with the VLA observations discussed in section 2.3) we might expect 0.5 such fluctuations (assuming gaussian statistics). We note that no targets in our sample show a negative flux of comparable significance. Thus, while it remains possible that this radio flux is not attributable to the target, in the analysis that follows, we treat the measured 5.5 GHz flux as a radio detection, with the caveat that it might also be treated as a robust upper limit.
| Object ID | location | z | 5.5 GHz Flux | S/N | Beam size | SFR | 9.0 GHz Flux |
|---|---|---|---|---|---|---|---|
| (J2000) | Jy/beam | M⊙ yr-1 | Jy/beam | ||||
| GRB 081007 | 22:39:50.49 -40:08:49.1 | 0.529 | 38.1 26.7 | 3.92.2′′ | 35 | ||
| GRB 060729 | 06:21:31.79 -62:22:12.4 | 0.54 | 65.4 27.8 | 2.3 | 4.11.8′′ | 55 24 | 60 41 |
| GRB 100621A | 21:01:13.10 -51:06:22.8 | 0.542 | 120.1 31.9 | 3.8 | 3.52.2′′ | 101 27 | 106 42 |
| GRB 090424 | 12:38:05.12 +16:50:15.4 | 0.544 | 36.6 28.0 | 101.7′′ | 38 | ||
| GRB 050223 | 18:05:32.35 -62:28:19.7 | 0.591 | 90.5 30.1 | 3.0 | 3.32.0′′ | 93 31 | 93 48 |
| GRB 050525A | 18:32:32.64 +26:20:21.6 | 0.606 | 15.6 33.8 | 8.41.6′′ | 53 | ||
| GRB 100418A | 17:05:27.19 +11:27:39.8 | 0.623 | 363.0 48.0 | 7.6 | 181.6′′ | — | 199 57 |
| GRB 051022 | 23:56:04.11 +19:36:23.7 | 0.809 | 23.0 35.5 | 141.5′′ | 98 | ||
| GRB 070508 | 20:51:11.80 -78:23:05.1 | 0.82 | 35.0 28.2 | 4.31.6′′ | 101 | ||
| GRB 071112C | 02:36:50.95 +28:22:16.7 | 0.823 | 50.1 25.2 | 7.31.6′′ | 126 | ||
| GRB 050824 | 00:48:56.20 +22:36:32.9 | 0.83 | 42.3 33.2 | 101.5′′ | 111 | ||
| GRB 080710 | 00:33:05.63 +19:30:05.5 | 0.845 | 42.6 28.8 | 111.6′′ | 112 | ||
| GRB 060814 | 14:45:21.32 +20:35:09.2 | 1.92 | 43.6 23.5 | 9.11.6′′ | 670 | ||
| GRB 091208B | 01:57:34.10 +16:53:22.9 | 1.063 | 0.0 4.2 | 1.31.1′′ | 33 | ||
| GRB 080413B | 21:44:34.60 -19:58:51.8 | 1.101 | 7.6 4.7 | 1.91.0′′ | 39 | ||
| GRB 100901A | 01:49:03.41 +22:45:30.1 | 1.408 | 0.2 2.9 | 1.21.1′′ | 42 | ||
| GRB 071003 | 20:07:24.11 +10:56:51.1 | 1.604 | 2.1 4.3 | 1.40.9′′ | 83 |
Observations at 9.0 GHz are more sensitive to atmospheric conditions and yield less sensitive constraints on star formation rate for all but the most peculiar of radio spectral slopes. We nonetheless inspect our 9.0 GHz for targets coincident with the GRB locations, using the same procedure described above. Two of the 5.5 GHz-detected sources were also detected at 9.0 GHz. The remaining sources showed no evidence for a 9.0 GHz detection.
We note that the constraints obtained above may be weakened if the sources are extended relative to the synthesised beam. The median effective radius of GRB host galaxies is kpc (Wainwright, Berger, & Penprase, 2007). This corresponds to a projected size of just 0.3′′ at and 0.2′′ at . Of 47 GRB hosts in the Wainwright, Berger, & Penprase (2007) sample, only one (GRB 011121 at ) would be comparable to a 1.5′′ beam size in our imaging. While it is possible that a more extended host may exist within our relatively small sample, such studies of archival space-based imaging suggest that this is unlikely.
2.3 VLA Observations
The survey was extended to higher redshifts () through the observation of four additional sources at the Karl G. Jansky Very Large Array (VLA). Observations were obtained in service mode in June-July 2012 and were associated with programme 12A-279 (PI: Stanway). A total bandwidth of 2 GHz was centred at 5.5 GHz, with data collected in 1024 channels, each 2 MHz in width. Observations were performed in B configuration.
Three targets - GRBs 071003, 080413B and 091208B - were each observed for 80 minutes on source, and a fourth target - GRB 100901A - for 160 minutes. As in the case of the ATCA observations above, a nearby point source was used for phase calibration on each target and absolute flux calibration was provided by the standard calibrator 3C48. Data were flagged and reduced using standard CASA tasks, producing a multi-frequency synthesis image for each target, using natural weighting. Both the improved instantaneous -plane coverage and the northern location of the VLA relative to the ATCA led to a more compact synthesised beam in these observations, as shown in table 1.
Each image revealed a number of faint radio sources, as well as known catalogue sources. In the field of GRB 071003, we recover the known NVSS galaxy J200658+110024 at a separation of 7.3 arcmin from our target. As before, we permit a small search region, allowing for the X-ray position uncertainty, any pointing uncertainty or offsets between the GRB or its host. None of the four targeted sources were individually detected. Given the non-detection, we measure the flux within the GRB error circle, allowing for small () shifts in the centroid if these maximise the flux, thus achieving the most conservative constraints. Our resulting sensitive flux limits as shown in table 1 and figure 2.
3 Afterglow or Host Galaxy?
The majority of the targets in this survey were observed a substantial time (2 years) after the initial burst. However, in two cases - GRBs 100418A and 100621A - radio fluxes were obtained less than a year post-burst in the galaxy rest-frame. Given that these sources are two of only four detections in our sample, the question arises: are we observing host galaxy flux, or are our observations contaminated by the late time radio afterglow of the burst itself?
We explore this possibility through archival imaging and the literature. It has been established that GRB 100621A was unusually bright. Greiner et al. (2013) analysed the multi-wavelength afterglow properties, including observations taken with ATCA in Jun-Jul 2010 (4-27 days after burst) at the same frequencies as those observed here. In table 2 we report the fluxes measured by Greiner et al. (2013) and compare with those measured in our observations. Greiner et al. suggested that their 2010 Jul 17 observations (measured at 17 days post-burst in the rest frame) might suggest a rapid fall off of the afterglow, or that the early time data might be explained by scintillation.
The radio afterglow of long GRBs can be observed across an extended period of time. Unlike the optical afterglow, which typically fades on a time scale of hours, radio afterglows extend across days or months. The timescales for this afterglow depend on the observed frequency, since high frequency flux peaks earlier than low frequency flux. Chandra & Frail (2012) compiled data on 95 GRBs for which there were radio detections spanning from minutes to 500 days following the Swift gamma-ray trigger. In 63 cases there was sufficient data to determine a peak flux epoch for at least one radio frequency. Only two sources have radio afterglows peaking at 50 days at 5 GHz or higher, with the vast majority peaking at 10 days. Typical sources show a fall in flux of more than an order of magnitude between the first few days and a rest frame epoch of 200 days post-burst, with the flux evolution at 8.5 GHz being consistent with for times after peak flux.
Our late time observations of GRB 100621A are entirely consistent with those measured almost 200 days earlier in the galaxy rest frame. The 2010 July observation remains discrepant but we note that this was also the noisiest observation, and given the large errors, the results are still consistent within 2 of our measured value. Since the initial claim of a fading radio afterglow hinged entirely on this relatively noisy datapoint, our late time observation suggests that such an interpretation should be reconsidered.
We cannot rule out an afterglow hypothesis, and further observations would be required to do so. However, given the lack of evidence for fading or other significant time variation in this source at either 5.5 or 9.0 GHz, we suggest that the constant flux is at least as likely to arise from underlying star formation in the host galaxy, rather than the burst afterglow. We make this assumption in the analysis that follows, while noting that it is inevitably subject to debate. Combining all available ATCA data in a single image (and thereby improving -plane coverage and sensitivity), we determine a best 5.5 GHz flux for the host of GRB 100621A of 14219 Jy, corresponding to a star formation rate of 11916 M⊙ yr-1 (well within the range of star formation rates seen for the GRB population, see next section) - consistent with each of the reported individual measurements to within their errors. The source appears to be a point source at the resolution of the synthesised beam.
| Date | Time post burst | 5.5 GHz flux | 9.0 GHz flux |
|---|---|---|---|
| 2010 Jun 24-25 | 1.6 | 137 17 | 150 28 |
| 2010 Jun 25-26 | 2.3 | 129 24 | 127 45 |
| 2010 Jul 17 | 17 | -43 85 | 49 100 |
| 2011 Apr 18 | 195 | 120 32 | 106 42 |
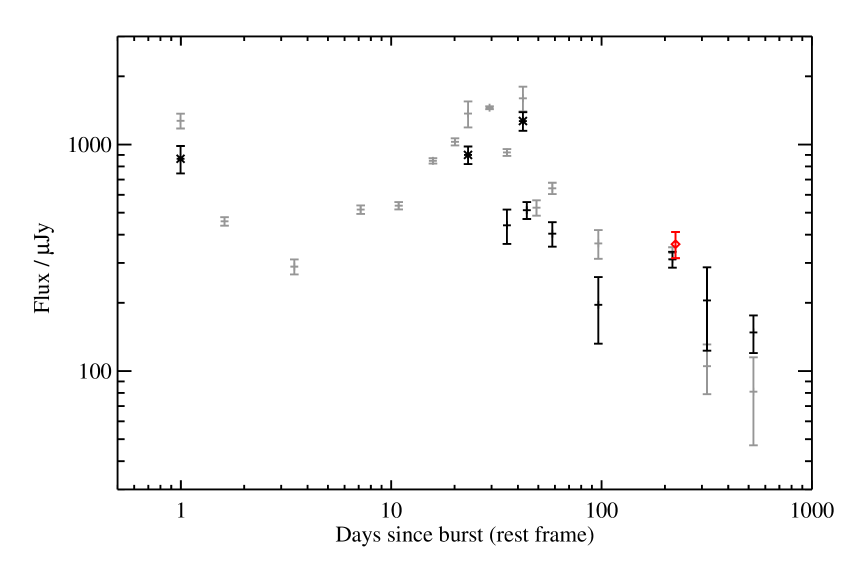
The radio afterglow behaviour of GRB 100418A has also been subject to previous investigation, with a campaign of long term follow-up conducted by (Moin et al., 2013). In figure 3, we place our observation in the context of that study. Interestingly, our independent observation, taken with ATCA, confirms the relatively high flux measured at the VLA twelve days before (in the observer frame). This might suggest a puzzling late time rebrightening of this source at 200 days post burst trigger in the rest frame. Whatever the implication of this high flux measurement, it seems clear that the flux in this system is unlikely to be dominated by emission from the GRB host galaxy and so cannot be interpreted as arising from star formation.
4 Star Formation Rates
The radio continuum flux from a galaxy can be converted to a star formation rate, assuming that the emission is dominated by the synchrotron component, which is emitted by electrons accelerated in supernovae and their remnants. Given that these events occur at the end of the life of massive stars, the establishment of radio continuum emission shows a delay relative to the ultraviolet emission from young starbursts, but is directly related to star formation in older populations with ongoing star formation.
Star formation rates determined for GRB host galaxies based on optical-near-infrared emission are typically relatively low, of order 1-10 M⊙ yr-1 and are derived either from fitting to the spectral energy distribution or to some assumed conversion factor from ultraviolet continuum or H line emission (e.g. Savaglio, Glazebrook, & LeBorgne, 2009; Levesque et al., 2010a; Krühler et al., 2011). However the inferred star formation rate from fitting to the UV-optical provides information primarily about the often blue, relatively young star forming population dominating the emission at these wavelengths, and does not provide any useful constraint on the fraction of star formation taking place in obscured regions. A relevant example is that of GRB 100621A, which has a measured obscuration from the burst itself of A, while a fit to the SED of the host yields just A (Krühler et al., 2011). The star formation associated with the burst clearly occured in, or behind, a heavily obscured region, and the optical data are not representative of this extinguished population.
Since radio wavelengths are less affected by dust extinction than the ultraviolet and optical, we might expect this flux to be a more complete measurement of the galaxy star formation rate, and to exceed the optically-derived values if substantial quantities of dust are present in the host galaxy.
We convert our measured 5.5 GHz fluxes to star formation rates, using the known redshift of the sources, and the conversion prescription of Berger et al. (2003) and Yun & Carilli (2002) which depends on observed frequency, source redshift, and radio spectral slope, .
Following Berger et al., we set , appropriate for faint radio sources. Using a steeper spectral slope, , results in star formation rate estimates 25% higher but does not significantly affect our conclusions. We fix the dust temperature and emissivity index at K and respectively (again for comparison with previous studies). The derived star formation rates (in M⊙ yr-1), are relatively insensitive to these dust parameters for observations at 1-10 GHz.
We over-plot contours on figure 2 to show the star formation rates equivalent to the given 5.5 GHz flux as a function of redshift. The last column in table 1 gives the inferred star formation rate (or limit thereon) in solar masses per year for each object, based on our 5.5 GHz observations, assuming that the observed radio flux is attributable to star formation. The measurement of GRB 100418A is not interpreted as star formation, as discussed in section 3.
Given the very different beam shapes and sensitivities of the ATCA data, we do not attempt to stack undetected sources. However we do stack our three undetected sources with VLA data at . No source is detected in our stack, which has an rms flux of 1.9 Jy, limiting the mean star formation rate of these three galaxies to M⊙ yr-1 (2 ).
We note that, while the host of GRB 050223 is detected at 3.4 and 4.6 m, none of the objects in our sample are detected in 22m -band infrared data from the ALLWISE data release (Wright et al., 2010; Mainzer et al., 2011). Flux in the long wavelength WISE bands is also excited by star formation and can be used as a star formation rate indicator, although this relies on calibrations that have been determined locally, and will vary as a function of redshift. At the redshift of our four detected sources, the m is probing the rest frame region around 14 m - and so is sensitive to hot dust and PAH emission. While strong flux in this region is indicative of a strong photon source - often star formation - the conversion is dependent on the physical properties of the star formation region and is thus poorly calibrated. WISE is also a relatively shallow survey, sufficient to identify very luminous sources, but not typical star forming galaxies at . In table 3, we give flux limits and equivalent star formation rate estimates for the four sources with proposed radio detections in this work. We apply the star formation rate conversion factor calculated from galaxies (Lee, Hwang, & Ko, 2013) for luminosities measured in the broad filter, which spans 11-16m (observed) and thus provides a better calibration for our distant sources than the low redshift band. As can be seen, the limits obtained by WISE are consistent with our inferred radio star formation rates for these sources, and also consistent with none of the larger sample being heavily obscured, submillimeter galaxy-like intense starbursts.
| Target | Flux | SFR | |
|---|---|---|---|
| m | mJy | M⊙ yr-1 | |
| GRB 050223 | 13.8 | 1.9 | 320 |
| GRB 060729 | 14.3 | 2.2 | 290 |
| GRB 100418A | 13.6 | 1.2 | 220 |
| GRB 100621A | 14.3 | 2.4 | 320 |
An additional constraint exists for one of our detected sources - the host of GRB 050223 - in the form of mid-infrared Herschel Space Telescope data. Hunt et al. (2014) observed a small sample of ‘dark’ GRBs with the PACS and SPIRE instruments, obtaining constraints on their mid-infrared spectral energy distribution (SED). In the case of GRB 050223, the host galaxy remained undetected, and the SED fit is driven by the optical to near-infrared data observed through to the WISE and bands. As figure 2 of Hunt et al. (2014) makes clear, the Herschel data do not tightly constrain the SED of this target, and derived parameters such as dust temperature and emission spectrum, star burst fraction, star formation rate and obscuration are highly degenerate. In the case of GRB 050223 the fit to the stellar spectrum dominated optical does little to break these degeneracies or constrain the longer wavelength emission. Indeed the infrared star formation rate determined by these authors is somewhat puzzling, actually falling below that estimated from the (uncorrected) ultraviolet emission. Given that this host galaxy had already been identified as a dusty starburst, with an A (i.e. extinguished by a factor in the ultraviolet, Pellizza et al., 2006), one might expect an estimate of the infrared emission to exceed the ultraviolet estimate by this factor, even without accounting for any more obscured emission. Thus while noting that our estimate of star formation significantly exceeds that of Hunt et al., we suggest that this indicates that further investigation of this source, or a revision to the existing spectral energy distribution fits, might be appropriate.
5 Discussion
5.1 Redshift Evolution
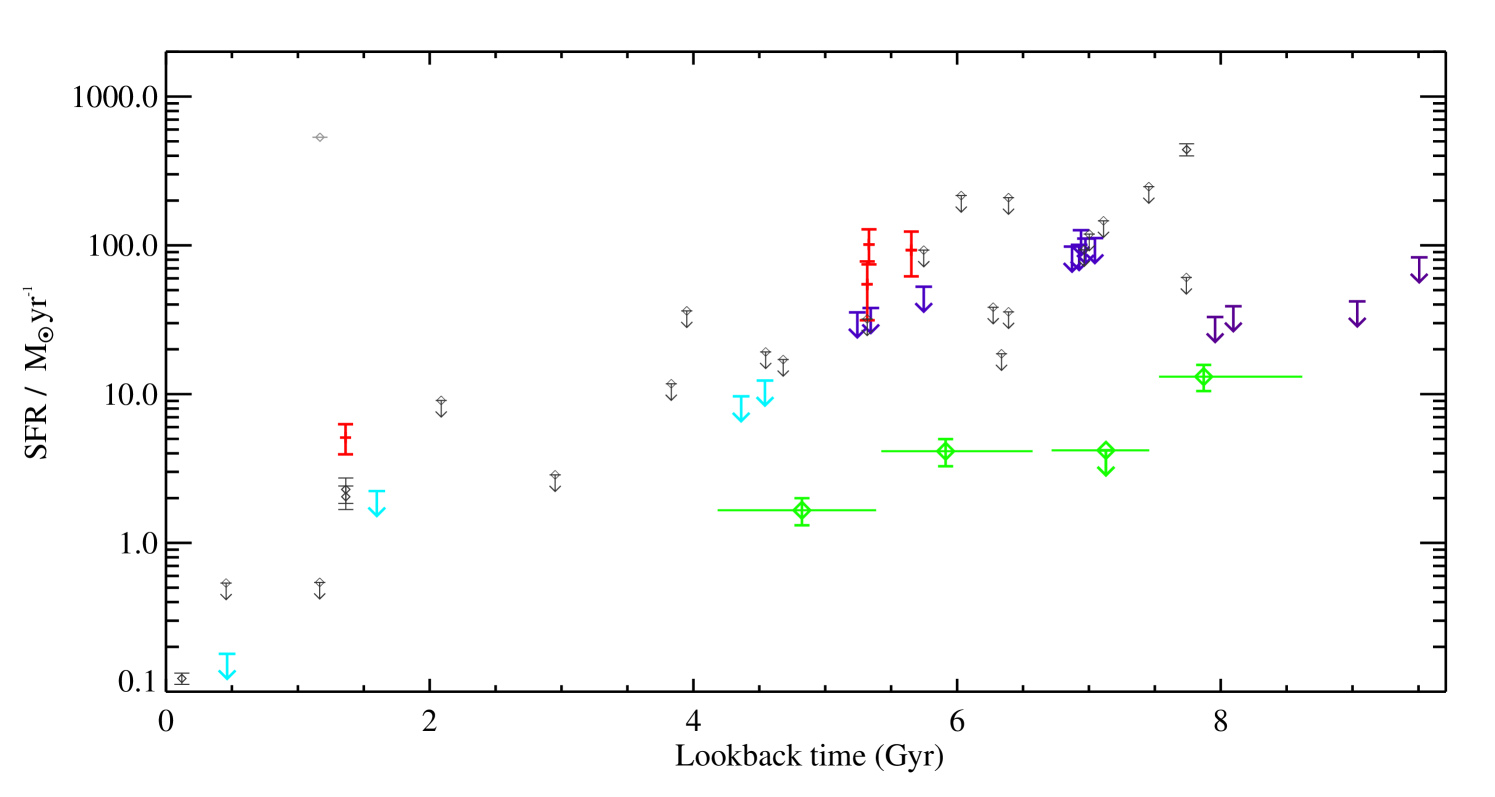
In figure 4 we consider the GRB host star formation rate measurements and limits derived from radio emission, as a function of lookback time. In addition to the data reported in this paper and our previous work (Stanway, Davies, & Levan, 2010), we also plot the radio-derived star formation rates reported and compiled by Michałowski et al. (2012). To enable direct comparison, we adjust the star formation rates of Michałowski et al. (2012) to account for the steeper radio spectral slope assumed in that paper, and to report 2 limits where a source is undetected.
In total, figure 4 includes data on 40 long gamma ray burst host galaxies. Of these, a mere six have secure detections (excluding the afterglow of GRB 100418A), and two of those lie at (i.e. 2 Gyr lookback time), making clear the difficulty of observing these low mass, moderately star forming galaxies over substantial intervals of cosmic time.
Five sources have only modest constraints (a 2 limit on star formation rate 200 M⊙ yr-1) and a sixth source is detected with a very high star formation rate (400 M⊙ yr-1). This source, GRB 021211 is a pre-Swift burst, arguably with different selection criteria and characteristics to the bulk of the sample. We note that the high flux density for this source (S Jy) reported by Michałowski et al. (2012) is inconsistent with that reported by (Hatsukade et al., 2012), who constrain the star formation rate to M⊙ yr-1 (2 , with our assumptions). Further investigation of this source is clearly needed.
In summary, no more than 5 of the 40 (%) GRB hosts with radio constraints, have star formation rates exceeding 200 M⊙ yr-1. This confirms, and indeed strengthens, the findings of Michałowski et al. (2012) who analysed data on about half of this composite sample, and is somewhat lower than suggested by early, pre-Swift and higher redshift work by Berger et al. (2003, who suggested a fraction of 20%) and Tanvir et al. (2004, who detected 3 of 21 sources). The reasons for this remain unclear, although small number statistics and the selection criteria for follow-up targets no doubt contribute to the discrepency.
The detection fraction in our (lookback time 5.5 Gyr) ATCA observations is perhaps slightly higher than might be expected based on the the statistics of the sample as a whole. Of nine GRB hosts at with star formation rate limits better than 200 M⊙ yr-1 we detect three sources (3319%). While these statistics are still based on small numbers of objects, if they were typical of the sample as a whole we might have expected several more detections outside this redshift range, including more examples at and perhaps one of our targets.
At present, the number counts in this subsample are insufficient to extrapolate further, and we note that one of these is our least significant detection. However, it suggests that further investigation may be warranted to determine whether this anomaly resolves with added data, or remains statistically significant. If there is, in fact, a redshift dependence in the typical star formation rate of GRB host galaxies, then it is possible that may represent a sweet spot in current telescope sensitivity relative to the typical star formation rate in GRB host galaxies. At lower redshifts, GRBs may be occuring in galaxies with lower typical star formation rates, while at higher redshift, the current radio limits are too weak to reliably probe this regime.
We note that other than this anomaly, there is at best very modest evidence for redshift evolution in the radio derived star formation rates in individual GRB host galaxies. The measurement sample is dominated by upper limits at all redshifts, but these are less constraining with increasing redshift. Nonetheless the upper limits on typical sources at lookback times of 6-10 Gyrs (roughly corresponding to ) constrain the typical GRB host radio-derived star formation rate to be no more than an order of magnitude higher than that observed at . This is comparable to the expected change in the typical star formation rate for galaxies of a given mass over the same interval due to the effects of downsizing (see, for example, Speagle et al., 2014, and references therein), and so while we limit the redshift evolution of GRB hosts, the current sample is insufficient to conclude that their evolution is significantly different to that of typical star forming galaxies over cosmic time.
5.2 Core Collapse SN Hosts
Long GRBs are believed to be generated by the breakout of relativistic jets during the collapse of of a massive star at the end of its life (Woosley & Heger, 2006). They have been observed to be coincident with Type Ic supernovae, and may be associated with core collapse supernovae (CCSN) more generally (see Fruchter et al., 2006, and references therein).
However, as discussed in section 1, Fruchter et al. (2006) found that GRB hosts are typically less optically luminous than those of CCSNe, and also that the transient is more closely associated with the peak of the light distribution in the host, based on optical photometry with the Hubble Space Telescope. They suggested that this might well represent a difference in the metallicity of the progenitor population, with GRBs biased towards the most massive and lowest metallicity stellar populations. This conclusion was broadly supported by Svensson et al. (2010), who employed template fitting of the spectral energy distribution of the host galaxies to make the same comparison. However Svensson et al. (2010) concluded that the difference between the two host populations was less pronounced in the blue optical bands which are dominated by star formation. This suggests the intriguing possibility that in the star formation-dominated radio continuum, the two populations may again appear similar.
We consider the published catalogue of core-collapse SNe in the GOODS field (Strolger et al., 2004; Dahlen, Strolger, & Riess, 2008; Dahlen et al., 2012), matching that also analysed by Svensson et al. (2010) and omitting only sources without radio coverage. These sources were initially selected, based on detection of the optical supernova, to lie in the two GOODS survey fields due to their extensive multi-wavelength coverage with HST (Giavalisco et al., 2004). Both GOODS fields have also been surveyed with deep radio imaging at 1.4 GHz from the VLA. We make use of the publically released maps of GOODS-S from Miller et al. (2008) and GOODS-N from Morrison et al. (2010). Both images have a comparable sensitivity, and are on the same pixel scale. While several core collapse SN hosts show a marginal detection, no individual source is strongly detected. We combine the radio flux at the location of those CCSN in the sample that lie within the appropriate image to produce stacked images, taking the mean pixel value at each point.
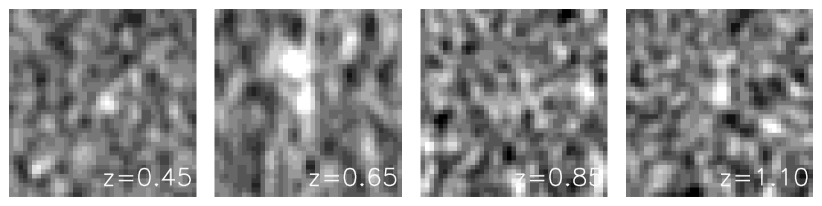
We divide the sample of CCSN in Svensson et al. (2010) into four redshift bins, each with , and combine the objects in each separately. The resulting stacked images are shown in figure 5 and their measured properties given in table 4. Radio properties of individual GOODS supernova hosts are given in the appendix and not discussed further here. In three redshift bins the average CCSN host galaxy is well detected. The sample has no clear detection, and the measured flux is treated as an upper limit.
The GOODS-S field was observed by the VLA in Jun-Sep 2007, 2 years after the last supernova was detected and host galaxy measurements are unlikely to be contaminated by residual flux from the supernovae. The GOODS-N observations represent a combination of data from 1996 and Feb 2005-Apr 2006. We cannot rule out the contribution of supernova flux to these observations, but note that % of the GOODS-N data were collected either before the SNe were detected, or year post-SN. The radio lightcurves of core-collapse supernovae decay on comparable timescales to those of GRBs but are typically at least two orders of magnitude less luminous than GRBs at comparable redshift (Kamble et al., 2014). Given the typical peak radio luminosity of ergs s-1 Hz-1 and a time decay of index (Weiler et al., 2002), we would expect radio supernovae to have dropped well below our stacked detection limit within a year in the observed frame, at all redshifts considered here. Assuming then that the host galaxy flux dominates over any supernova contribution, we convert the fluxes to star formation rates, using the same prescription given earlier to account for the different observed-frame frequency of the observations (1.4 GHz rather than 5.5 GHz).
| (Range) | Number | Flux / Jy | SFR / M⊙ yr-1 |
|---|---|---|---|
| 0.47 (0.35-0.55) | 17 | 6.0 1.2 | 1.7 0.3 |
| 0.63 (0.55-0.75) | 17 | 7.6 1.6 | 4.1 0.9 |
| 0.86 (0.75-0.95) | 8 | 3.8 1.9 | 4.2 |
| 1.04 (0.95-1.15) | 9 | 7.9 1.6 | 13.1 2.6 |
The derived star formation rates are compared to those of the GRB host sample and shown as large green diamonds in figure 4. The CCSNe typically occur in galaxies with lower star formation rates than are reached by current samples, confirming that the scarcity of detections in our sample is unsurprising. Interestingly, however, the results of the core collapse supernovae host sample are consistent with an increase in the typical radio-derived star formation rate in these galaxies with increasing redshift.
This behaviour appears consistent with the expected picture of cosmic ‘downsizing’ (Cowie et al., 1996). Not only does the volume-averaged star formation density of the Universe increase by more than an order of magnitude with increasing lookback time from to but the size and star formation rate of galaxies in the star-forming population also increases. Thus, if core-collapse supernova rate is directly proportional to star formation rate (i.e. the larger core collapse population is an unbiased tracer, as GRBs are not believed to be), the majority of events would be expected to be seen in more intense starbursts at than typically exist in the local Universe. As a result the detection of a single core-collapse supernova implies the existence of more young stars if it occurs at than if it occurs more locally, and any attempt to reconstruct the cosmic star formation history would require an adjustment for this evolution in the host galaxy population.
If GRBs are indeed still more biased towards low metallicity environments, as theoretically and observationally suggested (e.g. Woosley & Heger, 2006; Levesque et al., 2010a; Graham & Fruchter, 2013), but not universally accepted (e.g. Levesque et al., 2010b), then this effect would likely be stronger, with lower star formation rates needed, on average, to produce a burst at high redshift than in the local Universe, since a fraction of the higher metallicity star formation is not represented in the GRB rate. Further observations are clearly required to determine whether GRB hosts follow a similar pattern to that seen in the small sample of CCSN presented here, which could plausibly bias attempts to interpret the burst rate at a given redshift as a proxy for the volume averaged cosmic star formation rate. We note that the increase in radio-derived star formation rate between our lowest redshift bin and the highest is a factor of 7.7. If the typical rates seen in GRBs in the local Universe increase by a similar factor, it would be doubtful whether our radio observations are sufficiently sensitive to detect them.
In a pessimistic scenario, where GRB hosts are no more radio luminous than those of the larger CCSN population at high redshift, securing radio detections at the level of the core collapse supernovae hosts would require an improvement in sensitivity by a factor of 10 over the current observations. While using a larger array (for example the VLA rather than ATCA) may allow progress to be made in reasonable integration times at , the hosts at will need integration times approaching 8-10 hours per source to reach star formation rates of 10 M⊙ yr-1, making this an expensive study to undertake.
5.3 Dark GRB Hosts
Four of our sample, GRBs 051022, 060814, 050223 and 100621A, have been identified as dark bursts in earlier work. These are defined as sources which are sub-luminous in the optical relative to the X-ray, typically with an optical-to-X-ray spectral slope . This spectral index is beyond those normally allowed in GRB fireball models, and is most commonly attributed to the presence of dust in the GRB host galaxy. Indeed, the majority of these dark bursts have been shown to be associated with high optical extinctions (Perley et al., 2013). Studies in the optical and near-infared have suggested that the hosts of such bursts are typically more massive and chemically evolved than those of other GRBs, with higher star formation rates (e.g. Perley et al., 2013; Krühler et al., 2011). However, as already discussed, dust obscuration can make intepretation of galaxy spectral energy distributions challenging. Given the difficulties associated with faint optical emission, radio continuum observations have the potential to improve our understanding of the host galaxies of these sources (Zauderer et al., 2013).
Two of our candidates, GRBs 051022 and 060814 are included in the dark burst sample of Perley et al. (2013). Another, GRB 050223, does not satisfy the strict criteria for , with the strongest available constraint of , but based on its host galaxy properties Pellizza et al. (2006) claim this source as part of the dark sample (although Page et al., 2005, find no evidence for excess extinction in the X-ray emission from the burst). A high extinction (=3.8) and low has also been reported for a fourth source, GRB 100621A (Krühler et al., 2011; Melandri et al., 2012).
Radio constraints on the host galaxies of an exclusively ‘dark’ sample of 15 hosts, observed from the VLA, have recently been presented by Perley & Perley (2013). Only one source, GRB 051022, overlaps with the sample presented here, with the majority of targets in the Perley & Perley study lying at higher redshift than those in our sample. Four of their targets were detected: 3 host galaxies at SFR M⊙ yr-1 and GRB 051022 at M⊙ yr-1, consistent with our limit given in table 1. Two further host galaxies (GRBs 060202 and 090417B) were constrained to have radio star formation rates under 120 M⊙ yr-1, while the remaining, higher redshift targets, have less constraining upper limits on their star formation rates spanning from to a relatively weak M⊙ yr-1.
We detect the hosts of dark GRBs 050223 and 100621A in our 5.5 GHz observations, giving radio-derived star formation rates of M⊙ yr-1 – significantly higher than the majority of GRB hosts. Given the likely high redshift of GRB 060814 (see section 2.1), the star formation rate constraint on this source is rather weak and we exclude it from further discussion.
Between the Perley & Perley (2013) study and the observations reported here, the hosts of nine dark bursts have detected or well constrained radio derived SFRs - three in the range SFR M⊙ yr-1, three with higher star formation rates more akin to ULIRGs ( M⊙ yr-1), and three undetected sources constrained to have SFR M⊙ yr-1 (typical of the GRB host population as a whole, see figure 4). The remainder (lying at higher redshift) have relatively weak constraints on their radio flux and could still be harbouring star formation rates of several hundred solar masses per year, and yet remain undetected. As with GRBs 060814, we exclude these from further analysis.
To evaluate the probability of this detection rate occuring by chance, assuming that dark burst hosts are drawn from the same underlying star formation rate distribution as the non-dark burst sample, we consider a bootstrap resampling of the full existing, non-dark burst, dataset. The observations presented here and in Michałowski et al. (2012) provide detections or limits of M⊙ yr-1 or better on 28 individual non-dark sources. We make the conservative assumption that we have barely missed detecting the majority of sources (i.e. that their 2 limits are representative of their true star formation rates), and randomly draw sub-samples of nine objects from this compilation to mimic the dark burst sample, repeating the process times. We find that in only 1.7% of cases do six or more randomly sampled objects in a sample of nine have star formation rates exceeding 60 M⊙ yr-1. As such, it is highly unlikely that the dark busts we have identified above, are drawn from same underlying population as the non-dark bursts. The deviation of dark burst host star formation rates from those of the non-dark GRBs, is significant at the 2 level (subject, of course, to the vagaries of low number statistics) and merits further investigation.
This may suggest that while, as Perley & Perley (2013) and others have concluded, dark GRB hosts are typically forming stars at a lower rate than submillimeter galaxies, they are nonetheless biased towards systems with higher star formation rates than seen in the general, less extinguished long GRB host population.
6 Conclusions
Our conclusions can be summarized as follows:
-
1.
We present observations of 17 gamma ray burst host galaxies at 5.5 GHz, with 13 of these also observed simultaneously at 9.0 GHz. Typical rms noise levels in the images are 30 Jy/beam.
-
2.
Radio continuum (5.5 GHz) point sources are detected at the location of four GRBs (GRB 050223, 060729, 100418A and 100621A). Assuming a standard conversion factors, the fluxes of these correspond to radio-derived star formation rates of M⊙ yr-1.
-
3.
Comparison of our late time measurements with published data suggests that the radio flux reported at early times by Greiner et al. (2013) in GRB 100621A likely arises from the host galaxy rather than the burst afterglow as previously suggested. However our detection of GRB 100418A likely arises from late time radio afterglow emission. Our remaining two sources are observed several years post-burst.
-
4.
Based on our observations, we see no strong evidence for evolution in the typical star formation rate of the GRB host galaxy population with redshift, but note that we detect three sources at - an anomalously high fraction of sources in that redshift bin. Given the small number statistics it is difficult to comment further on the significance of this.
-
5.
We compare to the typical radio emission of CCSN hosts from the GOODS survey, securing detections in stacked samples at and 1.04, but not at . These detections correspond to star formation rates that are substantially lower (by an order of magnitude) than current GRB host limits. They also show some evidence for a trend towards higher star formation rates at higher redshift.
-
6.
Four of our targets satisfy criteria for identification as dark bursts. We detect two of these. In combination with earlier results, we suggest that these sources may have average star formation rates rather higher than those seen in the general population of long GRB hosts.
Acknowledgments
This paper is based in part on data obtained at the Australia Telescope Compact Array associated with programme C2544. The Australia Telescope Compact Array is part of the Australia Telescope National Facility which is funded by the Commonwealth of Australia for operation as a National Facility managed by CSIRO.
Also based in part on observations taken at the NRAO Karl G. Jansky Very Large Array (VLA), associated with programme 12A-279. The National Radio Astronomy Observatory is a facility of the National Science Foundation operated under cooperative agreement by Associated Universities, Inc.
This work made use of data supplied by the UK Swift Science Data Centre at the University of Leicester (Evans et al., 2009). We also made use of Ned Wright’s very useful cosmology calculator (Wright, 2006).
AJL and ERS acknowledge support from the UK Science and Technology Facilities Council, under the Warwick Astrophysics consolidated grant ST/L000733/1 and PATT-linked travel support grant. We also acknowledge the influence of suggestions from the anonymous referee on the evolution of this paper.
References
- Berger et al. (2003) Berger E., Cowie L. L., Kulkarni S. R., Frail D. A., Aussel H., Barger A. J., 2003, ApJ, 588, 99
- Castro Cerón et al. (2010) Castro Cerón J. M., Michałowski M. J., Hjorth J., Malesani D., Gorosabel J., Watson D., Fynbo J. P. U., Morales Calderón M., 2010, ApJ, 721, 1919
- Cenko et al. (2009) Cenko S. B., et al., 2009, ApJ, 693, 1484
- Chandra & Frail (2012) Chandra P., Frail D. A., 2012, ApJ, 746, 156
- Chapman et al. (2005) Chapman S. C., Blain A. W., Smail I., Ivison R. J., 2005, ApJ, 622, 772
- Chen et al. (2009) Chen H.-W., et al., 2009, ApJ, 691, 152
- Christensen, Hjorth, & Gorosabel (2004) Christensen L., Hjorth J., Gorosabel J., 2004, A&A, 425, 913
- Condon, Cotton, & Broderick (2002) Condon J. J., Cotton W. D., Broderick J. J., 2002, AJ, 124, 675
- Coward et al. (2013) Coward D. M., Howell E. J., Branchesi M., Stratta G., Guetta D., Gendre B., Macpherson D., 2013, MNRAS, 432, 2141
- Cowie et al. (1996) Cowie L. L., Songaila A., Hu E. M., Cohen J. G., 1996, AJ, 112, 839
- Cowie et al. (2004) Cowie L. L., Barger A. J., Fomalont E. B., Capak P., 2004, ApJ, 603, L69
- Dahlen, Strolger, & Riess (2008) Dahlen T., Strolger L.-G., Riess A. G., 2008, ApJ, 681, 462
- Dahlen et al. (2012) Dahlen T., Strolger L.-G., Riess A. G., Mattila S., Kankare E., Mobasher B., 2012, ApJ, 757, 70
- Djorgovski et al. (2001) Djorgovski S. G., Frail D. A., Kulkarni S. R., Bloom J. S., Odewahn S. C., Diercks A., 2001, ApJ, 562, 654
- Elliott et al. (2012) Elliott J., Greiner J., Khochfar S., Schady P., Johnson J. L., Rau A., 2012, A&A, 539, A113
- Evans et al. (2009) Evans P. A., et al., 2009, MNRAS, 397, 1177
- Fruchter et al. (2006) Fruchter A. S., et al., 2006, Nature, 441, 463
- Fynbo et al. (2009) Fynbo J. P. U., et al., 2009, ApJS, 185, 526
- Galama et al. (1998) Galama T. J., et al., 1998, Natur, 395, 670
- Gehrels et al. (2004) Gehrels N., et al., 2004, ApJ, 611, 1005
- Giavalisco et al. (2004) Giavalisco M., et al., 2004, ApJ, 600, L93
- Graham & Fruchter (2013) Graham J. F., Fruchter A. S., 2013, ApJ, 774, 119
- Greiner et al. (2011) Greiner J., et al., 2011, A&A, 526, A30
- Greiner et al. (2013) Greiner J., et al., 2013, A&A, 560, A70
- Groot et al. (1998) Groot P. J., et al., 1998, ApJ, 493, L27
- Hatsukade et al. (2012) Hatsukade B., Hashimoto T., Ohta K., Nakanishi K., Tamura Y., Kohno K., 2012, ApJ, 748, 108
- Hao & Yuan (2013) Hao J.-M., Yuan Y.-F., 2013, ApJ, 772, 42
- Hjorth et al. (2012) Hjorth J., et al., 2012, ApJ, 756, 187
- Hopkins et al. (2010) Hopkins P. F., Younger J. D., Hayward C. C., Narayanan D., Hernquist L., 2010, MNRAS, 402, 1693
- Hunt et al. (2014) Hunt L. K., et al., 2014, arXiv, arXiv:1402.4006
- Jakobsson et al. (2004) Jakobsson P., Hjorth J., Fynbo J. P. U., Watson D., Pedersen K., Björnsson G., Gorosabel J., 2004, ApJ, 617, L21
- Kamble et al. (2014) Kamble A., Soderberg A., Berger E., Zauderer A., Chakraborti S., Williams P., 2014, arXiv, arXiv:1401.1221
- Kann et al. (2010) Kann D. A., et al., 2010, ApJ, 720, 1513
- Kelly & Kirshner (2012) Kelly P. L., Kirshner R. P., 2012, ApJ, 759, 107
- Kocevski & West (2011) Kocevski D., West A. A., 2011, ApJ, 735, L8
- Kocevski, West, & Modjaz (2009) Kocevski D., West A. A., Modjaz M., 2009, ApJ, 702, 377
- Kohno et al. (2005) Kohno K., et al., 2005, PASJ, 57, 147
- Kouveliotou et al. (1993) Kouveliotou C., Meegan C. A., Fishman G. J., Bhat N. P., Briggs M. S., Koshut T. M., Paciesas W. S., Pendleton G. N., 1993, ApJ, 413, L101
- Krühler et al. (2011) Krühler T., et al., 2011, A&A, 534, A108
- Krühler et al. (2012) Krühler T., et al., 2012, arXiv, arXiv:1205.4036
- Lee, Hwang, & Ko (2013) Lee J. C., Hwang H. S., Ko J., 2013, ApJ, 774, 62
- Levesque (2014) Levesque E. M., 2014, PASP, 126, 1
- Levesque et al. (2010a) Levesque E. M., Kewley L. J., Berger E., Zahid H. J., 2010a, AJ, 140, 1557
- Levesque et al. (2010b) Levesque E. M., Kewley L. J., Graham J. F., Fruchter A. S., 2010b, ApJ, 712, L26
- Mainzer et al. (2011) Mainzer A., et al., 2011, ApJ, 731, 53
- Melandri et al. (2012) Melandri A., et al., 2012, MNRAS, 421, 1265
- Michałowski et al. (2012) Michałowski M. J., et al., 2012, ApJ, 755, 85
- Michałowski et al. (2009) Michałowski M. J., et al., 2009, ApJ, 693, 347
- Miller et al. (2008) Miller N. A., Fomalont E. B., Kellermann K. I., Mainieri V., Norman C., Padovani P., Rosati P., Tozzi P., 2008, ApJS, 179, 114
- Moin et al. (2013) Moin A., et al., 2013, ApJ, 779, 105
- Morrison et al. (2010) Morrison G. E., Owen F. N., Dickinson M., Ivison R. J., Ibar E., 2010, ApJS, 188, 178
- Nakagawa et al. (2006) Nakagawa Y. E., et al., 2006, PASJ, 58, L35
- Page et al. (2005) Page K. L., et al., 2005, MNRAS, 363, L76
- Pellizza et al. (2006) Pellizza L. J., et al., 2006, A&A, 459, L5
- Perley et al. (2013) Perley D. A., et al., 2013, ApJ, 778, 128
- Perley et al. (2008) Perley D. A., et al., 2008, ApJ, 688, 470
- Perley et al. (2007) Perley D. A., Chornock R., Bloom J. S., Fassnacht C., Auger M. W., 2007, GCN, 6850, 1
- Perley & Perley (2013) Perley D. A., Perley R. A., 2013, ApJ, 778, 172
- Priddey et al. (2006) Priddey R. S. et al, 2006, MNRAS, 369, 1189
- Robertson & Ellis (2012) Robertson B. E., Ellis R. S., 2012, ApJ, 744, 95
- Rol et al. (2005) Rol E., Wijers R. A. M. J., Kouveliotou C., Kaper L., Kaneko Y., 2005, ApJ, 624, 868
- Salvaterra et al. (2012) Salvaterra R., et al., 2012, ApJ, 749, 68
- Sault et al. (1995) Sault, R. J., Teuben, P. J., & Wright, M. C. H. 1995, Astronomical Data Analysis Software and Systems IV, 77, 433
- Savaglio, Glazebrook, & LeBorgne (2009) Savaglio S., Glazebrook K., LeBorgne D., 2009, ApJ, 691, 182
- Speagle et al. (2014) Speagle J. S., Steinhardt C. L., Capak P. L., Silverman J. D., 2014, arXiv, arXiv:1405.2041
- Stanway, Davies, & Levan (2010) Stanway E. R., Davies L. J. M., Levan A. J., 2010, MNRAS, 409, L74
- Stanway et al. (2011) Stanway E. R., Bremer M. N., Tanvir N. R., Levan A. J., Davies L. J. M., 2011, MNRAS, 410, 1496
- Strolger et al. (2004) Strolger L.-G., et al., 2004, ApJ, 613, 200
- Svensson et al. (2010) Svensson K. M., Levan A. J., Tanvir N. R., Fruchter A. S., Strolger L.-G., 2010, MNRAS, 405, 57
- Svensson et al. (2012) Svensson K. M., et al., 2012, MNRAS, 421, 25
- Tanvir et al. (2004) Tanvir N. R., et al., 2004, MNRAS, 352, 1073
- Tanvir et al. (2012) Tanvir N. R., et al., 2012, ApJ, 754, 46
- Thoene, Perley, & Bloom (2007) Thoene C. C., Perley D. A., Bloom J. S., 2007, GCN, 6663
- Wainwright, Berger, & Penprase (2007) Wainwright C., Berger E., Penprase B. E., 2007, ApJ, 657, 367
- Wang, Chen, & Huang (2012) Wang W.-H., Chen H.-W., Huang K.-Y., 2012, ApJ, 761, L32
- Weiler et al. (2002) Weiler K. W., Panagia N., Montes M. J., Sramek R. A., 2002, ARA&A, 40, 387
- Wirth et al. (2004) Wirth G. D., et al., 2004, AJ, 127, 3121
- Woosley & Heger (2006) Woosley S. E., Heger A., 2006, ApJ, 637, 914
- Wright (2006) Wright E. L., 2006, PASP, 118, 1711
- Wright et al. (2010) Wright E. L., et al., 2010, AJ, 140, 1868
- Yun & Carilli (2002) Yun M. S., Carilli C. L., 2002, ApJ, 568, 88
- Zauderer et al. (2013) Zauderer B. A., et al., 2013, ApJ, 767, 161
Appendix A The hosts of Core Collapse Supernovae
As discussed in section 5.2, we extract radio fluxes at the locations of core-collapse supernovae originally identified as part of the GOODS campaign (Giavalisco et al., 2004). Sources identified during the 2002-2003 observing campaign were catalogued, classified and reported by Strolger et al. (2004), listed both by ‘nickname’ and IAU approved transient name. Sources from 2004-2005 were classified by and discussed in Dahlen, Strolger, & Riess (2008) and Dahlen et al. (2012). Formal IAU naming was not sought for these later objects. Spectroscopic redshifts were obtained either from literature values for the supernova host galaxy or through Keck Observatory spectroscopy primarily originating from or compiled by the Team Keck Treasury Redshift Survey (Wirth et al., 2004). Target classifications, locations and redshifts for all these sources were made available electronically in 2008, as described in Dahlen, Strolger, & Riess (2008), and we make use of this publically released catalogue, and specifically those supernovae classified as core collapse and within the coverage region of the available radio imaging.
In this appendix we tabulate the measured radio fluxes at each position in table 5. Radio fluxes are measured on the publically released 1.4 GHz VLA maps of GOODS-S from Miller et al. (2008) and GOODS-N from Morrison et al. (2010). Names presented are those used in previous literature. Where formal names are available these are given, else the GOODS team ‘nickname’ is presented for ease of comparison with previous work. For details of the sample see Dahlen et al. (2012), see also Svensson et al. (2010) for further analysis of these sources. Note that only objects with redshifts between and contribute to the stacks described in section 5.2. Six supernova host galaxies are individually detected at better than 3 , with the strongest two detections both lying at the low redshift end of the sample. The remaining objects do not represent individual detections at the supernova location.
| ID | RA & Declination (J2000) | Redshift | Flux | RMS | S/N | |
|---|---|---|---|---|---|---|
| Jy | Jy | |||||
| 2002fz | 03 32 48.566 -27 54 17.73 | 0.838 | 6.9 | 7.9 | 0.9 | |
| 2002hq | 03 32 30.027 -27 43 47.40 | 0.669 | 10.3 | 9.1 | 1.1 | |
| 2002hs | 03 32 18.537 -27 48 34.14 | 0.388 | -3.8 | 7.6 | -0.5 | |
| 2002ke | 03 31 58.677 -27 45 00.32 | 0.577 | 8.5 | 7.6 | 1.1 | |
| 2002kb | 03 32 42.429 -27 50 25.15 | 0.578 | 26.9 | 6.8 | 3.9 | |
| 2002kl | 12 37 49.281 62 14 06.61 | 0.412 | 5.6 | 6.0 | 0.9 | |
| 2003ba | 12 36 15.912 62 12 37.70 | 0.286 | 9.7 | 3.9 | 2.5 | |
| 2003bb | 12 36 24.423 62 08 36.58 | 0.955 | 8.0 | 4.4 | 1.8 | |
| 2003bc | 12 36 38.210 62 09 53.78 | 0.511 | 4.7 | 4.0 | 1.2 | |
| 2003dx | 12 36 31.681 62 08 48.66 | 0.512 | 5.7 | 5.0 | 1.1 | |
| 2003dz | 12 36 39.921 62 07 52.56 | 0.48 | 2.7 | 3.8 | 0.7 | |
| 2003en | 12 36 33.149 62 13 47.66 | 0.54 | -0.81 | 4.0 | -0.2 | |
| 2003er | 12 36 32.384 62 07 34.48 | 0.595 | 15.5 | 4.1 | 3.8 | |
| 2003et | 12 35 55.862 62 13 33.13 | 1.296 | 8.4 | 3.7 | 2.3 | |
| 2003ew | 12 36 27.806 62 11 25.07 | 0.517 | 5.1 | 4.0 | 1.3 | |
| 2003N | 12 37 09.265 62 11 00.65 | 0.425 | 3.0 | 6.3 | 0.5 | |
| K0404-005 | 12 36 27.056 62 15 09.75 | 0.79 | -1.4 | 3.8 | -0.4 | |
| K0404-006 | 12 37 06.731 62 21 17.82 | 0.406 | 4.0 | 4.4 | 0.9 | |
| K0404-008 | 12 38 03.647 62 17 11.77 | 0.278 | 69.0 | 3.9 | 17.5 | |
| K0404-010 | 12 36 46.069 62 16 25.80 | 0.61 | -2.2 | 5.3 | -0.4 | |
| K0404-011 | 12 36 49.362 62 16 04.83 | 1.53 | 1.9 | 4.0 | 0.5 | |
| K0405-001 | 12 35 50.757 62 10 37.95 | 1.012 | 5.6 | 3.8 | 1.5 | |
| K0405-002 | 12 36 26.710 62 08 30.15 | 0.556 | 0.40 | 4.4 | 0.1 | |
| K0405-005 | 12 36 35.991 62 17 32.67 | 0.683 | -0.12 | 4.1 | -0.03 | |
| K0405-007 | 12 36 58.447 62 16 37.37 | 0.497 | -1.2 | 4.0 | -0.3 | |
| K0405-008 | 12 37 33.842 62 19 22.24 | 0.88 | 2.3 | 5.0 | 0.5 | |
| HST04Bon | 03 32 16.164 -27 49 41.81 | 0.664 | 34.0 | 6.9 | 4.9 | |
| HST04Cli | 03 32 05.073 -27 41 42.61 | 0.75 | 6.82 | 7.1 | 1.0 | |
| HST04Con | 12 37 08.258 62 12 53.74 | 0.838 | 6.1 | 3.9 | 1.6 | |
| HST04Cum | 12 37 18.453 62 10 50.72 | 0.972 | 4.8 | 3.8 | 1.2 | |
| HST04Fox | 03 32 41.765 -27 53 29.45 | 0.69 | 11.8 | 6.8 | 1.7 | |
| HST04Geo | 12 36 44.432 62 10 53.19 | 0.937 | 2.2 | 4.2 | 0.5 | |
| HST04Gua | 12 37 36.423 62 16 27.12 | 1.26 | 3.3 | 4.0 | 0.8 | |
| HST04Hei | 03 32 42.415 -27 50 21.76 | 0.576 | 4.9 | 7.0 | 0.7 | |
| HST04Jef | 03 32 23.679 -27 53 27.67 | 0.964 | 10.0 | 6.3 | 1.6 | |
| HST04Ken | 03 32 44.702 -27 49 22.77 | 0.522 | 13.0 | 6.0 | 2.2 | |
| HST04Mur | 03 32 35.307 -27 49 39.95 | 1.79 | 3.5 | 6.5 | 0.5 | |
| HST04Pata | 12 37 25.258 62 10 06.36 | 0.41 | 32.4 | 4.1 | 8.0 | |
| HST04Patu | 12 38 08.961 62 18 47.39 | 0.571 | 4.5 | 4.4 | 1.0 | |
| HST04Pol | 03 32 19.681 -27 50 23.53 | 0.561 | 8.6 | 6.8 | 1.3 | |
| HST04Riv | 03 32 32.407 -27 44 52.84 | 0.606 | 8.6 | 6.4 | 1.3 | |
| HST04Sos | 03 32 22.638 -27 50 15.30 | 0.55 | 4.6 | 5.5 | 0.8 | |
| HST04Tov | 03 32 49.625 -27 55 34.73 | 1.83 | 10.7 | 6.7 | 1.6 | |
| HST04Wil | 03 32 13.061 -27 42 04.92 | 0.422 | -6.9 | 7.2 | -0.9 | |
| HST05Boy | 03 32 44.859 -27 54 11.25 | 0.66 | -10.6 | 7.3 | -1.5 | |
| HST05Bra | 12 37 21.764 62 12 25.67 | 0.48 | 10.4 | 4.9 | 2.2 | |
| HST05Cas | 12 36 07.767 62 13 08.63 | 0.73 | 2.43 | 3.9 | 0.6 | |
| HST05Den | 12 37 14.773 62 10 32.61 | 0.971 | 5.2 | 4.3 | 1.2 | |
| HST05Fil | 12 37 19.329 62 15 59.30 | 1.21 | 2.9 | 4.0 | 0.7 | |
| HST05Kir | 12 36 14.875 62 12 53.07 | 0.448 | 6.3 | 3.9 | 1.6 | |
| HST05Mob | 12 36 25.518 62 15 11.04 | 0.68 | 1.3 | 3.6 | 0.4 | |
| HST05Pic | 12 37 37.965 62 12 43.95 | 0.911 | 4.0 | 4.1 | 1.0 | |
| HST05Sco | 12 36 51.196 62 19 56.11 | 0.93 | -7.6 | 4.2 | -1.8 | |
| HST05Sev | 12 37 43.773 62 14 38.11 | 0.96 | 4.6 | 4.0 | 1.2 | |
| HST05Ste | 12 37 01.534 62 17 47.13 | 0.475 | 3.5 | 4.5 | 0.8 | |
| HST05Str | 12 36 46.879 62 11 45.21 | 1.06 | 2.3 | 4.3 | 0.6 | |
| HST05Ton | 12 37 01.545 62 11 29.01 | 0.778 | 16.4 | 4.2 | 3.9 |