Quantifying the Effect of Matrix Structure on Multithreaded Performance of the SpMV Kernel
Abstract
Sparse matrix-vector multiplication (SpMV) is the core operation in many common network and graph analytics, but poor performance of the SpMV kernel handicaps these applications. This work quantifies the effect of matrix structure on SpMV performance, using Intel’s VTune tool for the Sandy Bridge architecture. Two types of sparse matrices are considered: finite difference (FD) matrices, which are structured, and R-MAT matrices, which are unstructured. Analysis of cache behavior and prefetcher activity reveals that the SpMV kernel performs far worse with R-MAT matrices than with FD matrices, due to the difference in matrix structure. To address the problems caused by unstructured matrices, novel architecture improvements are proposed.
I Introduction
Unstructured, sparse matrices arise in many common applications such as network analysis, linear dynamical systems, Markov chains, and eigendecomposition. Performance of these applications depends on the efficiency of sparse linear algebra operations on matrices. Sparse matrix-vector multiplication (SpMV) is the foundation for many of these operations. For example, SpMV is an essential kernel in signal processing for graph applications, where the computation of principal components (obtained through the use of eigensolvers) is a key step in finding anomalies in network data [1]. In this and many other applications, SpMV dominates the runtime, so performance is limited by SpMV efficiency.
In previous work, it was shown that the SpMV kernel performs one to three orders of magnitude worse in GOPS/Watt than its dense counterpart [2]. Dense matrix-vector multiplication is highly optimized and makes good use of modern architectural features [3]. Sparse matrix-vector multiplication (SpMV) with structured, sparse matrices benefits from many of the same features. For SpMV on unstructured, sparse matrices, however, irregularity of data access causes a high amount of traffic within the memory hierarchy. The architectural features of processors such as caches and prefetchers do not improve the performance of the SpMV kernel significantly for these matrices.
This work quantifies the performance of the SpMV kernel for unstructured sparse matrices, using data on structured sparse matrices for comparison. In Section II, the structure of the matrices and the architecture used are detailed, as well as the relationship between the two. Section III explains how the data was collected and how it is used to measure the performance of various components of the architecture, the caches, and the prefetcher. Results are presented in Section IV. Finally, Section V discusses the implications of sparse matrix structure and proposes architectural innovations to improve SpMV performance.
II Background
II-A Matrices
R-MAT matrices are unstructured and model the type of graphs that arise frequently in network applications [4]. R-MAT matrices are constructed to approximate realistic network models using a power law distribution. This construction skews the distribution of nonzeros in the matrix. To avoid problems of load balancing across threads, the rows and columns of the R-MAT matrices are permuted randomly. This does not change the results of the multiplication and eliminates a confounding element in comparisons to performance with other matrices. These R-MAT matrices are generated to represent a network with an average of eight connections per node, giving an average of eight nonzeros per row.
Finite difference (FD) matrices are also sparse, but have a more regular structure than R-MAT matrices. The FD matrices are generated using a two-dimensional, 9-point stencil [5]. The matrices have three diagonal bands of three nonzero elements each, giving nine nonzeros per row.
Both types of sparse matrices are stored efficiently in compressed sparse row (CSR) format [6]. The CSR format consists of three dense arrays: an array of nonzero values, an array of column indices for each nonzero, and an array of indices to the start of each new row in the values array. The total number of elements in these arrays, for a matrix with rows and nonzeros, is .
The CSR format stores sparse matrices compactly, which allows sequential access to the nonzero entries of the matrix. Matrix accesses, however, are not the only source of memory requests. To perform matrix-vector multiplication, each nonzero element (found in some column ) is multiplied by the element of an input vector . For sparse matrices, the order of accesses to is determined by the location of the nonzeros in the matrix. The kernel’s ability to access the needed elements of determines the performance of matrix-vector multiplication.
II-B Intel Sandy Bridge Architecture
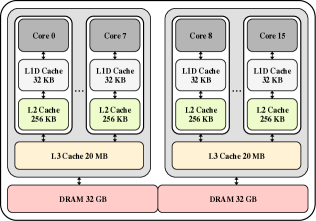
The SpMV performance measurements were conducted on Intel Sandy Bridge, a multi-core, non-uniform memory access architecture. The Sandy Bridge memory hierarchy has two levels of on-core cache (L1D and L2), a shared on-chip L3 cache, and shared off-chip DRAM, as shown in Figure 1. This architecture has a memory prefetcher, which preemptively loads data into the L2 cache from the L3 cache (or from DRAM, if the data is not found in L3) to speed up future access to this data. If the link to DRAM is too congested with demand requests from the SpMV kernel, the prefetcher will not turn on [7].
This architecture is commonly found in laptop, desktop, workstation and server computers. Sandy Bridge processors are also used in Amazon’s Elastic Compute Cloud and Google’s Compute Engine. The Intel Sandy Bridge architecture was selected because of its widespread use, its multi-core processor, and the availability of tools to access various hardware counters in the processor for tracking data such as cache hits and instruction counts.
For this study, performance data was obtained on a Sandy Bridge system containing two Intel Xeon E5-2690 processors running at 2.9 GHz, with 32 GB of shared DRAM for each processor. Each processor has 20MB of on-chip shared L3 cache and contains 8 cores. Each core has 32KB of on-core L1D cache and 256 KB of on-core L2 cache [8].
II-C Cache Utility
The performance of SpMV depends greatly on the architecture’s ability to utilize cache efficiently. The multiplication operation uses three data structures that must be stored in memory: a matrix, an input vector (), and a vector for the solution. When the problem size is small enough that all three data structures fit in cache, every memory request is satisfied on-chip (cache hit). When the problem size is large, the processors must access DRAM to obtain data that has not yet been pulled into cache. Accesses to DRAM are far more costly than accesses to cache and hinder performance.
The matrices tested have sizes ranging from nonzeros to nonzeros.111The R-MAT matrix sizes range from to rows, times 8 nonzeros per row. The FD matrices have the same range of rows, times 9 nonzeros per row. The smallest problems fit entirely in the L2 cache, while the largest barely fit in DRAM. Table I shows the maximum number of nonzeros a matrix may have and still fit within each cache level.
| Level | Size | FD | R-MAT | |
|---|---|---|---|---|
| Serial | L2 | 256KB | 18,432 | 18,078 |
| L3 | 20MB | 1,474,560 | 1,446,311 | |
| Parallel | L2 | 4MB | 294,912 | 289,262 |
| L3 | 40MB | 2,949,120 | 2,892,623 |
For both FD and R-MAT matrices, the CSR matrix data is straightforward for the system architecture to load. The elements of all three arrays of the CSR format are stored and accessed sequentially, allowing each memory request to retrieve an entire cache line of useful data. This spatial locality enables the L2 prefetcher to anticipate data needs correctly and retrieve useful data from lower memory in advance. The challenge arises when accessing the elements of .
Caching data from is much easier for matrix-vector multiplication on structured matrices than on unstructured matrices. First, consider the ideal case of a dense matrix. In dense matrix-vector multiplication, elements of are accessed sequentially (since every element in each row is treated as a nonzero), so portions of can be fetched into the cache in advance for efficient access. The pattern of accesses to is not so simple for SpMV with sparse matrices.
| Finite difference matrix |
For FD matrices, accesses to elements of have strong spatial and temporal locality. In a given row, there are three sets of three adjacent nonzero elements. For each set, the SpMV kernel requires three adjacent elements of , as shown in Figure 2 by red letter As. This sequential access pattern allows the prefetcher to anticipate the needs of the kernel successfully and load the appropriate elements of into the L2 cache. Since memory accesses are performed in units of a cache line, additional elements of are loaded and will be in cache when needed. Accesses to also exhibit temporal locality: after an element of is used the first time, it gets used again during the multiplications of the next two rows of the matrix, since they have nonzeros in the same column (see Figure 2, blue letter Bs). Even if the kernel were to miss in cache for the first usage of an element of , it would hit for the next two uses immediately after. These properties of FD matrix structure and the resultant accesses to allow the SpMV kernel to use cache effectively.
For R-MAT matrices, the lack of structure forces the SpMV kernel to access elements of at random. Without spatial or temporal locality in accesses to , the prefetcher fails to predict data needs; therefore, useful data is rarely found in cache. This forces the SpMV kernel to make many more demand requests to DRAM, slowing the computation and damaging performance.
III Methodology
III-A Intel VTune Amplifier
Performance data is measured precisely with Intel’s VTune Amplifier XE tool. VTune records activity on various components of the processor. This study concentrates on cache-related metrics. VTune collects hits and misses for each level of cache, as well as remote versus local DRAM accesses. It also captures high-level metrics such as the number of instructions executed and the number of cycles used. The most powerful functionality of VTune is the ability to collect data on specific functions, threads, or even line numbers. In this work, the data is collected exclusively from the SpMV operation. To ensure the SpMV operation uses enough resources for VTune to track it accurately, the SpMV kernel is run many times and the result is averaged over the number of runs. The number of times SpMV is run per matrix is:
This function has the property that the amount of computational work performed is constant and independent of the matrix size. This allows for comparison of the counters across matrix sizes without normalizing. Additionally, the SpMV program is run without VTune to measure the runtime of the SpMV kernel, to ensure that gathering the metrics does not slow the runtime measurement.
III-B Metrics
From the VTune counters222
The VTune counters are renamed above for readability. Here is the correspondence between the names above and the identifiers used in VTune:
L2 Demand Misses
MEM_LOAD_UOPS_RETIRED.L2_MISS
L3 Demand Misses
MEM_LOAD_UOPS_RETIRED.LLC_MISS
Prefetcher L2 Misses
L2_RQSTS.PF_MISS
L2 Cycles Stalled
CYCLE_ACTIVITY.STALL_CYCLES_L2_PENDING
Number of Instructions
INST_RETIRED.ANY
Total Number of Cycles
CPU_CLK_UNHALTED.THREAD
, five compound metrics are computed to capture
concisely the relevant performance information. These five metrics are
L2 Miss Rate, L3 Miss Rate, Prefetch Miss Rate, L2 Stall Cycles, and GFLOPS.
L2 Miss Rate is a measure of how often the process misses the L2 cache for demand requests. A high cache miss rate indicates poor utilization of the cache. The L2 Miss Rate is computed as:
| (1) |
L3 Miss Rate is the equivalent metric for the L3 cache. A high cache miss rate (in the L2 or L3 caches) causes the system to waste time waiting for the request to complete.333Data on the L1D cache was not included because L1D miss rate would not affect L2 Stall Cycles, one of the primary metrics used to measure performance The L3 Miss Rate is computed as:
| (2) |
Prefetch Miss Rate measures how often the prefetcher loads data into the L2 cache. A high Prefetch Miss Rate indicates prefetcher success in speeding up the SpMV operation. It is important to note that this is contrary to the L2 and L3 Miss Rates in that a higher Prefetch Miss Rate implies better performance. Prefetch Miss Rate is computed as:
| (3) |
L2 Stall Cycles is the percent of total cycles spent waiting for data in the L2 cache. L2 Stall Cycles includes not only L2 misses but also subsequent L3 accesses and fetches from DRAM. These are the cycles that would have been saved, had the data been present in L2. L2 Stall Cycles is computed as:
| (4) |
GFLOPS shows performance in billion floating-point operations per second. In SpMV, each non-zero element is involved in one multiplication and one addition, so the number of floating point operations is twice the number of nonzeros. GFLOPS is inversely proportional to the runtime, so faster runtimes correspond to higher GFLOPS. GFLOPS is computed as:
| (5) |
IV Results
Performance data on the SpMV kernel is presented for 1, 2, 4, 8, and 16 threads. Data is not shown for 32 threads, as the results are confounded by hyperthreading. 444The system has 16 physical cores and uses hyperthreading to simulate an additional 16 cores [8]. Hyperthreading does not duplicate the resources essential to the SpMV kernel, so there is no performance gain from attempting to use more threads than physical cores. In fact, simulating additional cores only fragments resources and increases congestion. For cache metrics, two representative cases are presented for simplicity. The serial case (1 thread) is presented to show performance without the congestion of additional threads. Data for 16 threads is used as the parallel case, to show maximal utilization of all processor resources by the kernel. Performance is quantified in terms of L2 Miss Rate, L3 Miss Rate, Prefetcher Miss Rate, L2 Stall Cycles, and GFLOPS.
IV-A L2 Miss Rate
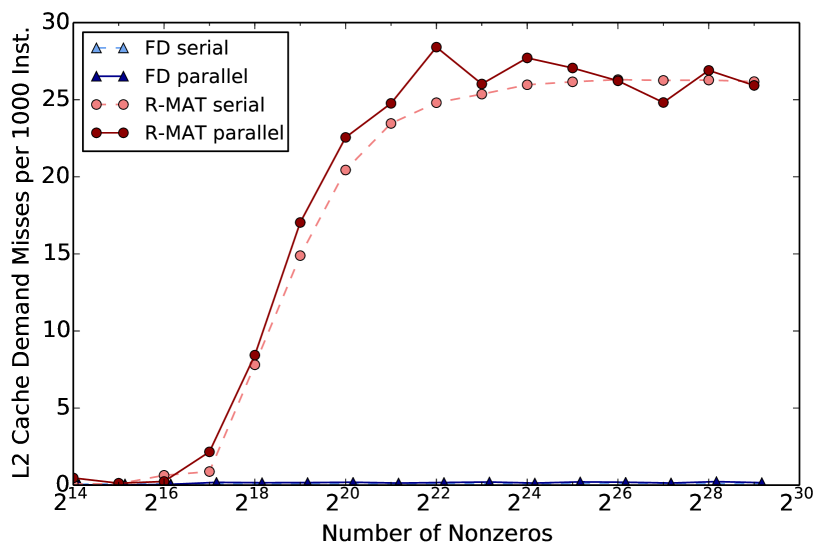
Figure 3(a) shows the L2 Miss Rate (Eq. 1) of the SpMV kernel for FD and R-MAT matrices. For the FD matrices, the SpMV kernel maintains a low L2 Miss Rate of about 0.1 misses per thousand instructions across all matrix sizes. For the R-MAT matrices, as the problem size exceeds the capacity of the L2 cache, L2 Miss Rate increases dramatically, reaching a plateau around 26 misses per thousand instructions. This discrepancy is caused by the difference in structure between the two matrix types.
The regular structure of the FD matrices results in some sequential accesses to by the SpMV kernel and allows reuse of some data in the L2 cache. The consequence of this regular access pattern is that the needed data is regularly present in the L2 cache, producing a low (good) L2 Miss Rate.
For R-MAT matrices, their unstructured composition generates random accesses to . These erratic accesses to hinder the architecture’s ability to keep relevant data in the L2 cache, causing a high (bad) L2 Miss Rate.
The L2 Miss Rate differs little between the SpMV kernel running in serial and in parallel. Although running in parallel provides multiple L2 caches, the increased net capacity does not increase L2 cache capacity for any individual core. The performance of each core depends only on the data present within its own L2 cache, not on the data within the L2 caches of other cores. The performance of each core for a given matrix size, therefore, remains the same as in the serial case.
The L2 Miss Rates level out when only a trivial portion of the problem fits in the L2 cache. For these large problem sizes, data accesses to elements of by the SpMV kernel settle into a pattern of where the data is found. For FD matrices, the pattern is that the hardware prefetcher successfully anticipates data requirements and loads the correct data into the L2 cache. For R-MAT matrices, the prefetcher fails to predict data requirements (due do the random R-MAT structure), so the data access pattern is as follows: look for the data in the L2 cache, miss, and then retrieve the data from a more remote location in memory.
IV-B L3 Miss Rate
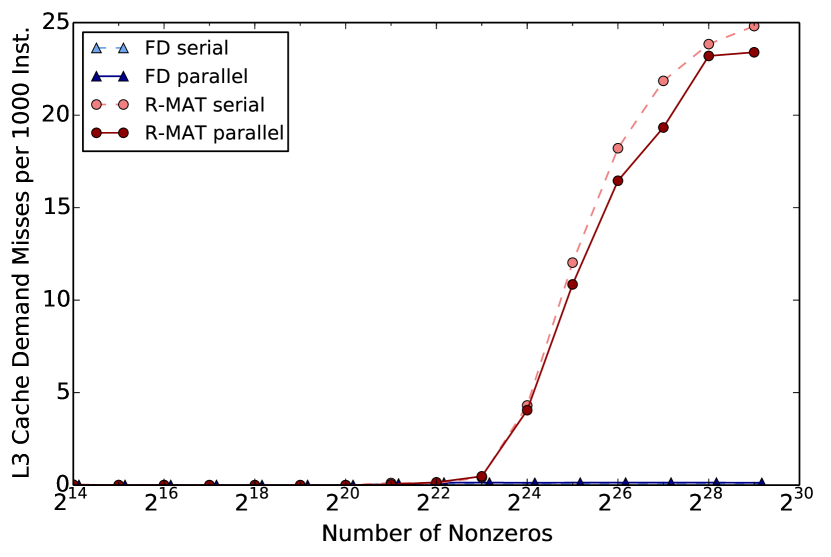
The L3 Miss Rate (Eq. 2) of the SpMV kernel behaves analogously to the L2 Miss Rate, only shifted by the increased cache size, as shown in Figure 3(b). Just as with the L2 Miss Rate, L3 Miss Rate for FD matrices is consistently low, at about 0.1 misses per thousand instructions. For R-MAT matrices, the L3 Miss Rate increases dramatically, to about 25 misses per thousand instructions, at the point where the problem size exceeds the capacity of the L3 cache.
The L3 Miss Rate data parallels the observation made in the previous section of the pattern of fetching data from the L2 cache. For the FD matrices, the prefetcher successfully loads data into the L2 cache. Because the SpMV kernel nearly always finds the data it needs in the L2 cache, it rarely needs to access the L3 cache. Consequently, the L3 Miss Rate (which is normalized by the number of instructions, not the number of L3 accesses) is low (good) for FD matrices. For the R-MAT matrices, the L3 Miss Rate follows the same pattern as the L2 Miss Rate: once the problem size no longer fits in cache, the miss rate increases sharply.
For both types of matrices, the L3 Miss Rate approaches the L2 Miss Rate. In the case of the largest matrices (for which only a trivial portion of the problem fits in the L3 cache) nearly every L2 miss is followed by an L3 miss. This implies that when the SpMV kernel looks for data in the L2 cache and misses, it consistently misses in the L3 cache as well and must access DRAM to retrieve the data. This shows that the L3 cache rarely contains relevant data and that L3 cache accesses merely waste compute cycles.
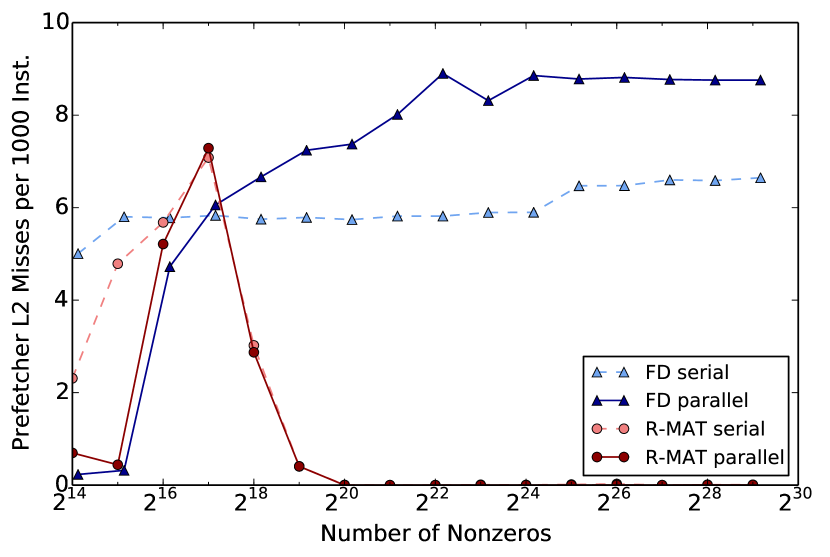
IV-C L2 Stall Cycles & Prefetch Miss Rate
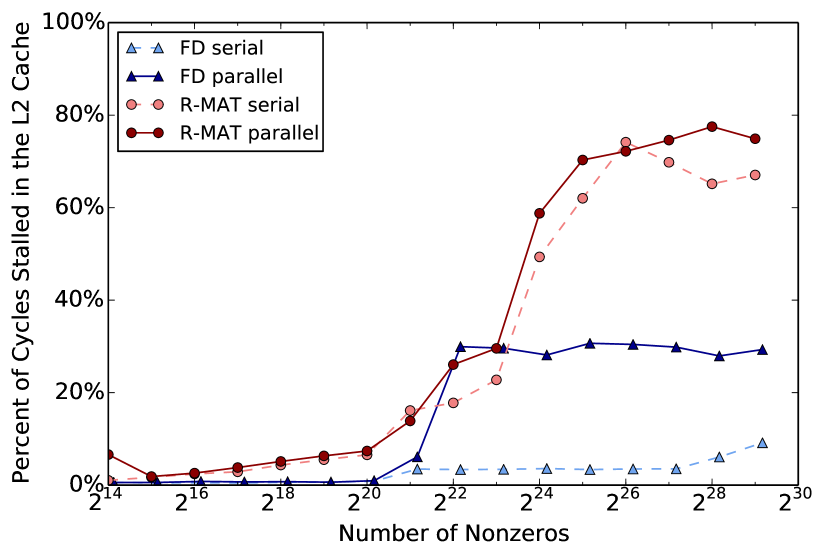
L2 Stall Cycles (Eq. 4) in Figure 5 shows the percentage of total cycles that are wasted due to L2 cache misses. High L2 Stall Cycles indicates congestion in the memory hierarchy and shows that the SpMV kernel is performing poorly. High L2 and L3 Miss Rates both contribute to L2 Stall Cycles. An L2 miss leads to an L3 access, causing the processor to stall for several cycles. An L3 miss leads to a DRAM access, causing the processor to stall for many more cycles. In the case where most L2 misses are followed by L3 misses (which happens for both types of matrices), an L2 miss is extremely costly.
For FD matrices, L2 Stall Cycles is less than one percent for problem sizes that fit in the L3 cache. On larger matrices, L2 Stall Cycles increases, especially in the parallel case. Although the L3 Miss Rate is still low for these large matrices, high Prefetch Miss Rate (as shown in Figure 5, from Eq. 3) congests memory and causes stalls. A high Prefetch Miss Rate shows that the prefetcher is successfully anticipating data needs and making the SpMV kernel more efficient. However, the tradeoff is additional traffic to DRAM, which increases the L2 Stall Cycles resulting from an L3 miss.555For small problems that fit entirely in the L2 cache, the SpMV kernel does not miss in L2, so the Prefetch Miss Rate does not factor into L2 Stall Cycles. In the serial case, prefetcher activity does not stall the processor significantly, but in the threaded case, each core has its own prefetcher, so prefetcher activity causes congestion and stall cycles.
For R-MAT matrices, L2 Stall Cycles begins to increase at the point when the problem size exceeds the capacity of the L2 cache (where the L2 Miss Rate increases). The effect of the L2 Miss Rate on L2 Stall Cycles is exacerbated by the L3 Miss Rate, particularly once the problem size exceeds the capacity of the L3 cache (where the L3 Miss Rate jumps). As more requests go to DRAM, the DRAM quickly reaches a bottleneck in the rate at which it can fulfill requests. The Prefetch Rate indicates that the congestion in DRAM overwhelms the prefetcher, causing the prefetcher to be shut off. Once the DRAM bottleneck is reached, the L2 Stall Cycles plateaus around 70%. This means that, for the largest R-MAT matrices, at most 30% of cycles are used for computation of the SpMV kernel, and the rest are wasted stalling.
IV-D GFLOPS
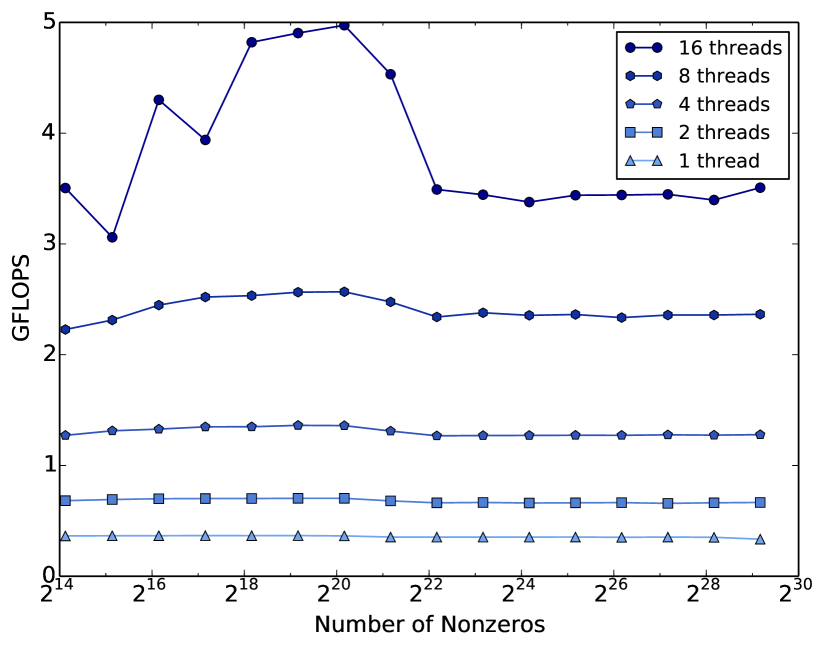
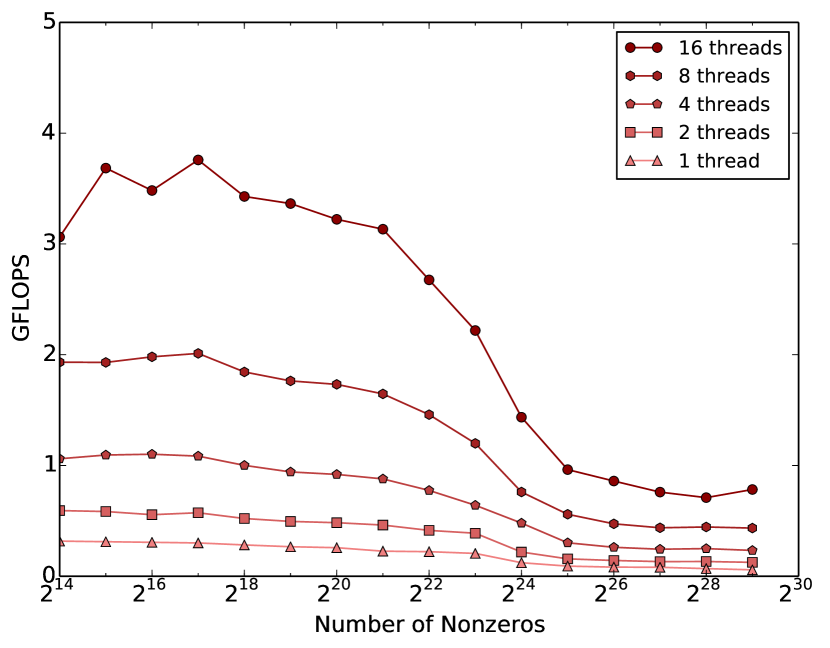
Figure 6(a) shows the performance in GFLOPS (Eq. 5) of the SpMV kernel on FD matrices. The data indicates that doubling the number of threads approximately doubles the GFLOPS. This shows that the SpMV kernel is able take advantage of the resources provided by additional threads. The performance in GFLOPS remains constant across the number of nonzeros, indicating that the SpMV kernel generally scales well with matrix size, with the exception of 16 threads. The behavior on 16 threads differs due to a bottleneck in DRAM accesses. The prefetcher causes a large amount of DRAM activity, which, although beneficial overall, slows demand requests and causes the SpMV kernel to stall.
Similar to the FD matrices, the SpMV kernel with R-MAT matrices is able to utilize the resources provided by additional threads, as shown in Figure 6(b). Unlike for FD matrices, increasing R-MAT matrix size causes GFLOPS to decline. In particular, when the problem size exceeds the capacity of the L3 cache, the SpMV kernel begins to be limited by a bottleneck in DRAM accesses, causing a performance drop.
V Conclusions
Matrix structure plays a strong role in the performance of the SpMV kernel. Structured matrices allow the SpMV kernel to take advantage of prefetching and caches to achieve good performance. Unstructured matrices, however, inhibit the utilization of these architectural features and cause performance to suffer.
For FD matrices, the regular matrix structure leads to a regular data access pattern that is easy for the architecture to handle. This leads to low L2 and L3 cache miss rates, high prefetcher effectiveness, and low L2 Stall Cycles. The result is high GFLOPS, which shows high performance of the SpMV kernel with FD matrices.
For R-MAT matrices, the random matrix structure creates an irregular data access pattern, which is difficult for the architecture to anticipate. Even though the matrix itself is stored in a structured format (like the FD matrices), the erratic accesses to cause high L2 and L3 cache miss rates, prefetcher failure, and high L2 Stall Cycles. The result is low GFLOPS, which shows low performance of the SpMV kernel. More specifically, the performance in GFLOPS of the SpMV kernel with large R-MAT matrices is only 20% of the GFLOPS SpMV achieves with large FD matrices.
There are several potential solutions to mitigate the problem of poor SpMV performance on unstructured, sparse matrices. One possibility is to bypass the L3 cache for larger problems. As the L2 and L3 miss rates show, the L3 cache rarely contains data useful to the SpMV kernel, even in the case of FD matrices, so performance would be improved by not accessing the L3 cache at all. This would save power and time on standard hardware, and potentially save chip space on specialized hardware. The prefetcher would also perform better if it were exclusively fetching matrix data, since it is stored in a dense format, rather than also fetching portions of . In conjunction with this more refined prefetcher activity, most of the cache could be used to store the values from (rather than extra matrix data, which the prefetcher could retrieve easily). A more sophisticated improvement to the prefetcher would be to give it a more intelligent strategy to predict data requirements. The prefetcher is able to anticipate memory accesses that are sequential, but is currently unable to predict non-sequential data needs. If the prefetcher were able to predict the non-sequential data, the structure of the matrix would not matter. In general, these improvements would require allowing the kernel more control over the architecture and tailoring the architecture usage for the particular problem of performing SpMV on unstructured, sparse matrices.
Acknowledgments
The authors want to thank the DARPA MTO for support of the PAKCK study. We thank Albert Reuther his contributions.
References
- [1] B. A. Miller, N. T. Bliss, P. J. Wolfe, and M. S. Beard, “Detection theory for graphs,” Lincoln Laboratory Journal, vol. 20, no. 1, pp. 10–30, 2013.
- [2] J. S. Mullen, M. M. Wolf, and A. Klein, “Pakck: Performance and power analysis of key computational kernels on cpus and gpus,” in Proc. of HPEC 2013, 2013.
- [3] K. Goto and R. A. v. d. Geijn, “Anatomy of high-performance matrix multiplication,” ACM Trans. Math. Softw., vol. 34, no. 3, pp. 12:1–12:25, May 2008. [Online]. Available: http://doi.acm.org/10.1145/1356052.1356053
- [4] D. Chakrabarti, Y. Zhan, and C. Faloutsos, “R-MAT: A Recursive Model for Graph Mining,” in Proc. of the 4th SIAM Conference on Data Mining, 2004, pp. 442–446.
- [5] Y. Saad, Iterative Methods for Sparse Linear Systems, 2nd ed. Philadelphia, PA, USA: Society for Industrial and Applied Mathematics, 2003.
- [6] R. P. Tewarson, Sparse matrices, ser. Mathematics in Science and Engineering. Academic Press, 1973.
- [7] Intel® 64 and IA-32 Architectures Optimization Reference Manual, Intel Corporation, March 2014, order number 248966-029.
- [8] Intel® Xeon® Processor E5-1600/E5-2600/E5-4600 Product Families, 2nd ed., Intel Corporation, May 2012, reference number 326508.