Deep Photospheric Emission Lines as Probes for Pulsational Waves
Abstract
Weak line emission originating in the photosphere is well known from O stars and widely used for luminosity classification. The physical origin of the line emission are NLTE effects, most often optical pumping by far-UV lines. Analogous lines in B stars of lower luminosity are identified in radially pulsating Cephei stars. Their diagnostic value is shown for radially pulsating stars, as these lines probe a much larger range of the photosphere than absorption lines, and can be traced to regions where the pulsation amplitude is much lower than seen in the absorption lines.
keywords:
stars: oscillations, stars: atmospheres, stars: individual ( CMa, BW Vul)1 Introduction
Weak line emission originating in the photosphere is well known from luminous O stars. The physical origin of the line emission is NLTE effects, most often optical pumping by far-UV lines. In early B hypergiants Feiii emission lines were identified to be pumped by Hei lines (Wolf & Stahl 1985). Rivinius et al. (1997) found these lines to have the least negative radial velocity and the least degree of variability. This means they are seated deeply in the photosphere. Analogous lines can be found in early B-type Cephei stars of lower luminosity. Their diagnostic value is shown for radially pulsating stars, as these lines probe a much larger range of the photosphere than absorption lines.
2 Observations
Observations of CMa (116 proprietary intensity spectra) and BW Vul (434 archival intensity spectra) were carried out with ESPaDOnS/CFHT on Mauna Kea (, 370 to 1000 nm, for all observations). Data were usually obtained by continuously observing the targets over several hours.
For CMa the formation of the weak emission lines in the photosphere is corroborated by their magnetic signature, which is identical in shape, but inverted in sign w.r.t. the absorption lines. This is the expected behaviour for photospherically formed emission. See Shultz et al. (this volume) for a more in-depth discussion of the magnetic properties of CMa
For most lines, the pumping or fluorscence mechanisms were not yet identified. However, for several of the emission lines that could be identified, the upper levels coincide with the upper levels of strong potassium resonance lines below about 100 nm. The lines in which emission is seen were tentatively identified as
-
•
Siii: 6347, 6371.
-
•
Siiii: 6462 (or Cii), 7463, 7467, 8103.
-
•
Feiii: 5879.
-
•
Cii: 6151, 6462 (or Siiii)
-
•
Unidentified: 5056, 5070, 6587, 6718, 6777, 6804, 6806, 6852, 6928, 7113, 7116, 7388, 7552, 7512, 7852, 8236, 8287, 8293, 8630, 9826, 9855.
3 Discussion
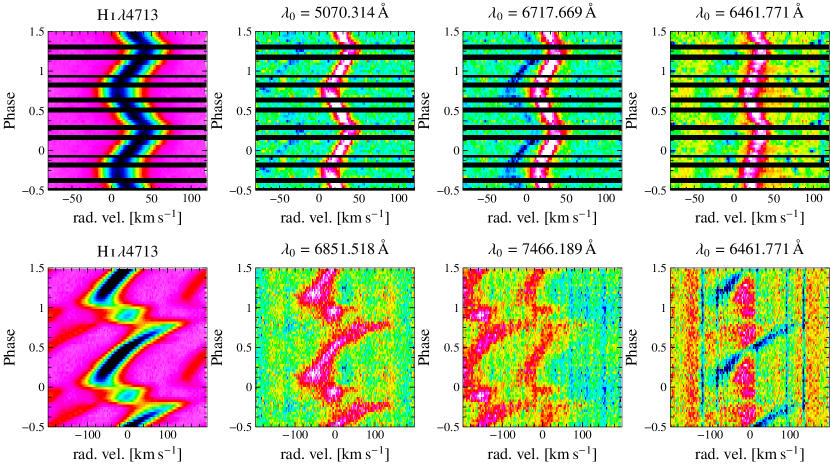
Fig. 1 shows that the pulsation amplitude in the emission lines is either similar or smaller than in the absorption lines. It is known for radial pulsators that there is an amplitude gradient in the photosphere. For high amplitude pulsators, the amplitude increases with height (see Fig. 2 of Fokin et al. 2004, for models).
However, the typical change of amplitude is rather small over the range of the photospheric absorption lines. Fig. 6 of Nardetto et al. (2013) indicates changes of up to 10% between weak and strong absorption lines. In the case of CMa, the emission lines with the lowest peak-to-peak amplitudes have an amplitude of only 50% of the amplitude of the absorption lines, while for BW Vul the amplitude seems even to approach zero in the most extreme case (see lower row of Fig. 1, Hei4713 vs. Å).
References
- Fokin et al. (2004) Fokin, A., Mathias, P., Chapellier, E., Gillet, D., & Nardetto, N. 2004, A&A 426, 687
- Nardetto et al. (2013) Nardetto, N., Mathias, P., Fokin, A., et al. 2013, A&A 553, A112
- Rivinius et al. (1997) Rivinius, T., Stahl, O., Wolf, B., et al. 1997, A&A 318, 819
- Wolf & Stahl (1985) Wolf, B. & Stahl, O. 1985, A&A 148, 412