Send correspondence to Markus Hartung: mhartung@gemini.edu, Telephone: +56-51-2205 664
On-sky low order non-common path correction of the GPI Calibration Unit
Abstract
The Gemini Planet Imager (GPI) entered on-sky commissioning phase, and had its First Light at the Gemini South telescope in November 2013. Meanwhile, the fast loops for atmospheric correction of the Extreme Adaptive Optics (XAO) system have been closed on many dozen stars at different magnitudes (I=4-8), elevation angles and a variety of seeing conditions, and a stable loop performance was achieved from the beginning. Ultimate contrast performance requires a very low residual wavefront error (design goal 60 nm RMS), and optimization of the planet finding instrument on different ends has just begun to deepen and widen its dark hole region. Laboratory raw contrast benchmarks are in the order of or smaller. In the telescope environment and in standard operations new challenges are faced (changing gravity, temperature, vibrations) that are tackled by a variety of techniques such as Kalman filtering, open-loop models to keep alignment to within 5 mas, speckle nulling, and a calibration unit (CAL). The CAL unit was especially designed by the Jet Propulsion Laboratory to control slowly varying wavefront errors at the focal plane of the apodized Lyot coronagraph by the means of two wavefront sensors: 1) a 7x7 low order Shack-Hartmann SH wavefront sensor (LOWFS), and 2) a special Mach-Zehnder interferometer for mid-order spatial frequencies (HOWFS) - atypical in that the beam is split in the focal plane via a pinhole but recombined in the pupil plane with a beamsplitter. The original design goal aimed for sensing and correcting on a level of a few nm which is extremely challenging in a telescope environment. This paper focuses on non-common path low order wavefront correction as achieved through the CAL unit on sky. We will present the obtained results as well as explain challenges that we are facing.
keywords:
High contrast imaging, non-common path aberrations1 INTRODUCTION
In high contrast imaging systems the control of non-common path aberrations (NCPA) is another key element for contrast performance. This has been addressed for GPI[1] with the design of a dedicated CAL unit. The HOWFS was specified to a wavefront error of 1 nm RMS over spatial frequencies of 3-22 cycles/pupil) and the low-order wavefront sensor (LOWFS) to 5 nm RMS for spatial frequencies cycles/pupil. In the laboratory the CAL unit was demonstrated to reach a performance of nm RMS for the LOWFS and nm RMS for the HOWFS, but this was not done with the benefit of the full AO system of GPI but using a set-up with a phase aberration screen.[2]. Not surprisingly, the commissioning of all functionalities of this subsystem poses one of our greatest challenges since we are aiming to reach a precision of a few nanometers in the telescope environment that is subject to a changing gravity vector, thermal drifts, vibrations, etc. We remind the reader that there are also other techniques to sense and control NCPA such as phase diversity and speckle nulling, and GPI indeed makes use of speckle nulling to further lower the noise floor of the “dark hole”[3]. Although these other techniques exist, the sensing must occur on time-scales over which the speckles evolve. Speckle decorrelation times on other telescopes are on the order of 30 to 60 seconds.[4] Therefore interrupting science observations on these timescales is impractical, and the baseline method of contemporaneous calibration wavefront sensing and science observations was decided upon.
In this paper we describe the status and share our challenges of the on-sky commissioning of the LOWFS which has started recently. Due to internal vibrations caused by the cryocoolers the commissioning of the Mach-Zehnder type interferometer of the CAL has been postponed. Currently, we are in the process of investigating to upgrade our cryocoolers with an active vibration cancellation system.111Sunpower recently advertised its new ACS (Active Cancellation System) for the GT and other models. Our current Sunpower GT coolers are damped passively only with tuned vibration absorbers.[5]
After GPI had its First Light in November 2013 the commissioning team concentrated on basic and high priority tasks such as loop stability, integration into Gemini science operations[6], vibration mitigation[5] and AO controller optimization [7]. In the most recent commissioning run (4th run, May 2014) with all core functionalities working and verified, we could shift part of our resources to continue the commissioning of GPI’s CAL unit.
 |
During the Assembly & Testing (A&T) stage[8] at the University of California, Santa Cruz we established the nominal focus using a knife edge experiment at the Focal Plan Mask (FPM), and the corresponding wavefront sensor centroid offsets define the zero point. We tested effects that potentially can create focus offsets. A chromatic effect can make calibrations more challenging, and partly illuminated subapertures might be more susceptible to instrument misalignments or other effects. When applying the LOWFS measured and reconstructed wavefront, a careful eye is required on the interplay between tip/tilt and coma. Furthermore, the spherical has a larger measurement error than the other Zernikes due to our geometry. With a sampling of 7 subapertures over the pupil and the central obscuration the central cap of the Zernike mode is blended out and this results into a large fitting error.
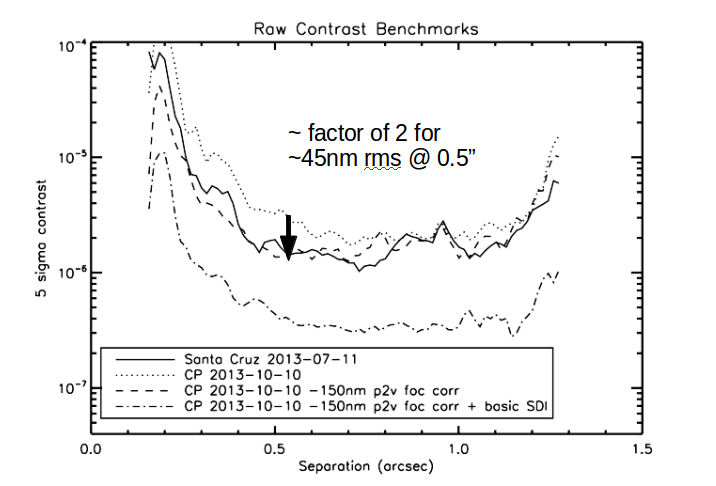
Based on our A&T experiences we chose a low-risk approach for on-sky commissioning of the CAL unit and decided to reduce the complexity and ignore the higher order modes for the first steps of on-sky commissioning. Also, we expect to get the highest immediate gain from assuring a correct non-common path focus. A defocus as small as 45 nm rm cost us approximately a factor of two in contrast at 0.5” as we demonstrated during commissioning at Cerro Pachon[8] (Fig. 1). Therefore, this mode is prioritized particularly in the light of moving GPI into Gemini standard science operations by the end of this year. As soon as the off-load interfaces are verified higher modes can be safely added.
 |
2 Techniques and laboratory tests
2.1 LOWFS wavefront measurement and offload
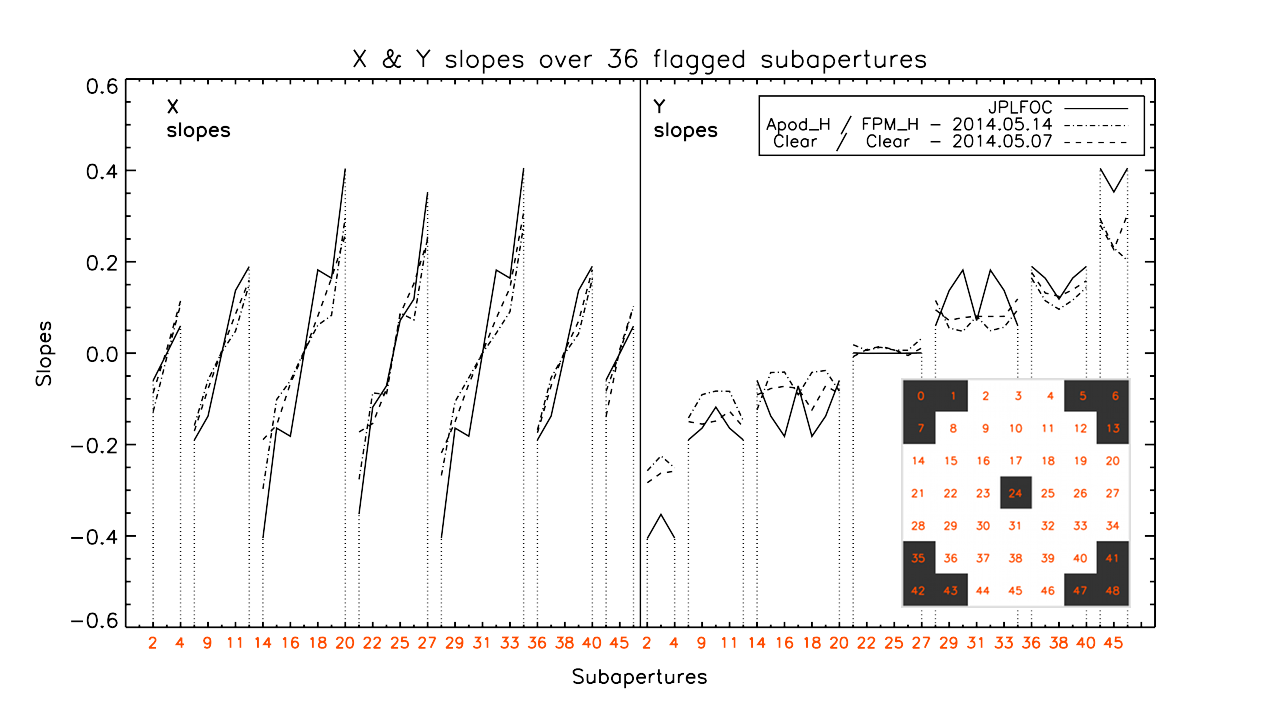
The wavefront reconstruction of the LOWFS is based on a standard vector matrix multiplier (VMM) approach. In the original design, this phase reconstruction matrix was derived synthetically (the slopes corresponding to the different Zernike modes were simulated using an appropriate geometry for the pupil, subapertures, the beam, and detector pixel size). According to the sampling of 7 subapertures across the pupil, the default size of the reconstruction matrix is 14x72, containing 14 Zernike coefficients (rows) and 72 slopes (columns; first all x slopes, then all y slopes). The inlet in Fig. 2 shows the geometry and the valid subapertures. There are three invalid subapertures at the four edges and one in the center (the central subaperture is obscured by the secondary mirror) which leaves us with 72 valid slopes. The 14 Zernike coefficients representing the wavefront as measured by the LOWFS (output of the VMM) are converted into a 48x48 phase grid. To compensate the measured NCPA this phase grid is rendered to the AO system. The tip/tilt offload loop is commissioned already, and the higher-order off-load loop is currently in its commissioning phase.
2.2 Laboratory tests
 |
One reason for the discrepancy of the LOWFS focus measurements compared to knife-edge measurements appeared to be the partly illuminated subapertures. Indeed, temporarily “flagging out” all partly illuminated subapertures significantly improved the accuracy of absolute focus measurements (a low sensitivity for the spherical mode also contributes to these discrepancies).
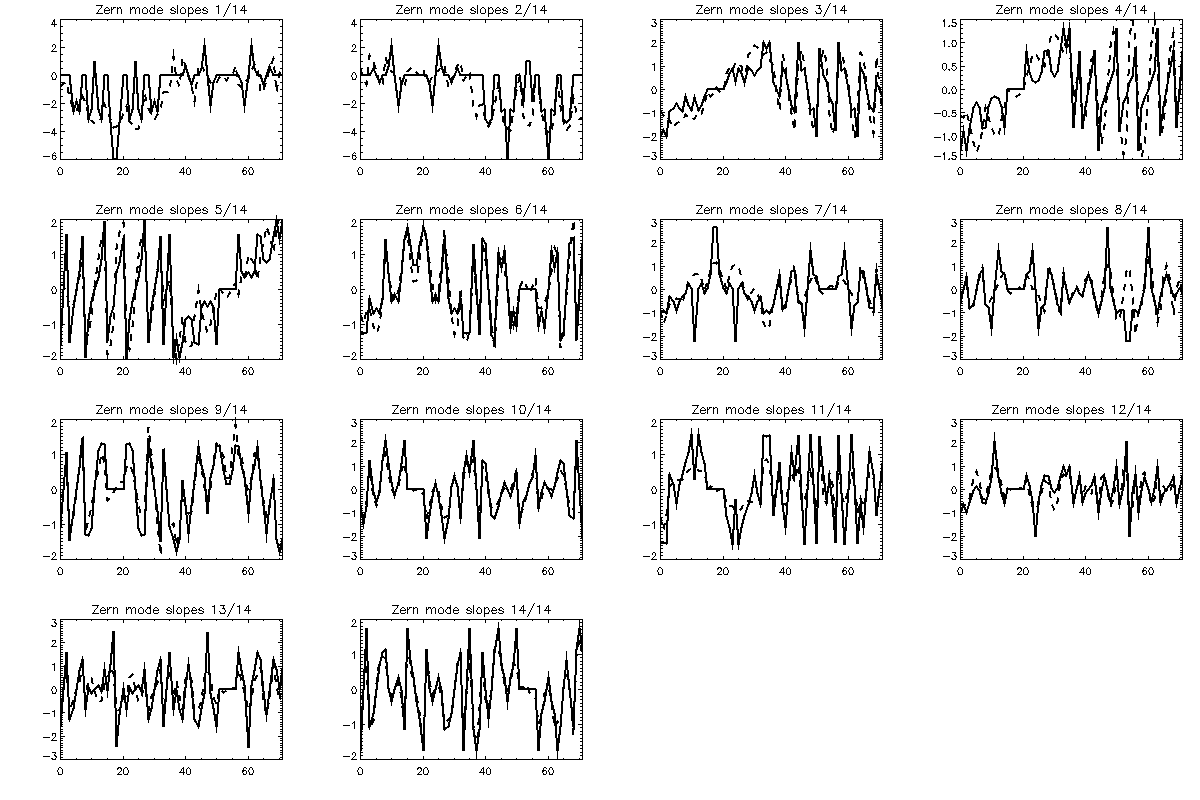
Inspection and additional measurements on CAL/LOWFS alignment (collimation, lenslet, foci) did not reveal any significant anomalies with respect to the design - still we might not have caught all potential systematic discrepancies. Therefore, we have been investigating to replace the synthetic reconstruction matrix with a matrix based on measured slopes using the GPI’s internal calibration source (ASU - Artificial Star Unit). Fig. 3 shows a comparison of the slopes for all Zernike modes of the synthetic matrix from the original design with the slopes that were measured by pushing the required Zernike modes using the AO system. Any instrumental effects that cannot be simulated such as systematic offsets or misalignments should be included in this measured matrix. A potential systematic error in the original reconstruction might be from the diameter of the central obstruction of the telescope which was improperly interpreted in the design phase, and thus improperly included in the as-delivered synthetic reconstruction matrix. We remind the reader that since we are comparing the slopes of the reconstruction matrices, the measured forward matrix was inverted via a standard singular value decomposition (SVD).
Fig. 2 shows a direct comparison of measured LOWFS slopes for two different instrument setups and a comparison with the focus projection-slopes extracted from the synthetic reconstruction matrix. We applied a 200 nm RMS defocus with the AO system. This was done in closed loop by the means of a reference centroid offset to avoid creeping of the woofer or hysteresis errors. To help visual inspection only neighbouring subapertures are connected (in contrary to the matrix slopes comparison in Fig. 3). We remind the reader that for a pure focus aberration the slopes are expected to rise linearly in and to be constant in for each subaperture row which is clearly reflected. The dash-dotted line displays the measured LOWFS slopes for a focus test wavefront with the apodizer (Apod_H) inserted (typical coronagraphic set up) and the simple dashed line measures the same test wavefront but with the apodizer mask removed (Clear). This verifies that the discrepancies between these slopes are small. Nevertheless, if they are completely negligible and can be safely ignored is still a matter of investigation.
The continuous line in Fig. 2 represents the values of the focus row from the original synthetic reconstructor matrix. These projection-slopes are scaled to match the measured slopes. The discrepancy of the projection-slopes to the measured slopes arises because of instrumental effects that could not be simulated and because of the matrix inversion process involving all 14 Zernikes. This demonstrates the advantages of a reconstruction matrix based on measurements and also reminds us of the trade-off done by the selection of Zernike modes contained in the matrix. For example, in our geometry the focus row is significantly modified by the inclusion of spherical during the inversion process (fitting).
2.3 Low sensitivity for the spherical mode
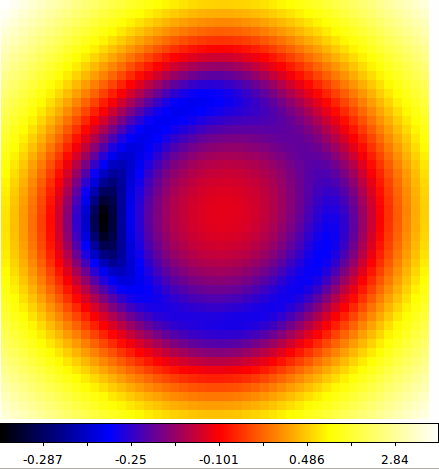
Fig. 4 shows a 48x48 phase grid that is generated for a 200 nm RMS focus wavefront by the CAL interface and which is rendered to the AO system to offload NCPAs. The phase is purely based on LOWFS slopes and reconstructed as described in Sect. 2.1. An erroneous primary spherical aberration can be identified which originates from noise amplification or the low sensitivity of the LOWFS to measure this mode. This is a consequence of the central obscuration invalidating the central sub-aperture which contains strongly weighted information to fit a spherical. The best solution in our case might be to reject this mode completely. The small but notable discrepancy for circular symmetry could be real NCPA. If not they are expected to disappear when the original synthetic reconstruction matrix (used in this case) is replaced by a measured one.
 |
2.4 Edge effects seen by the AOWFS
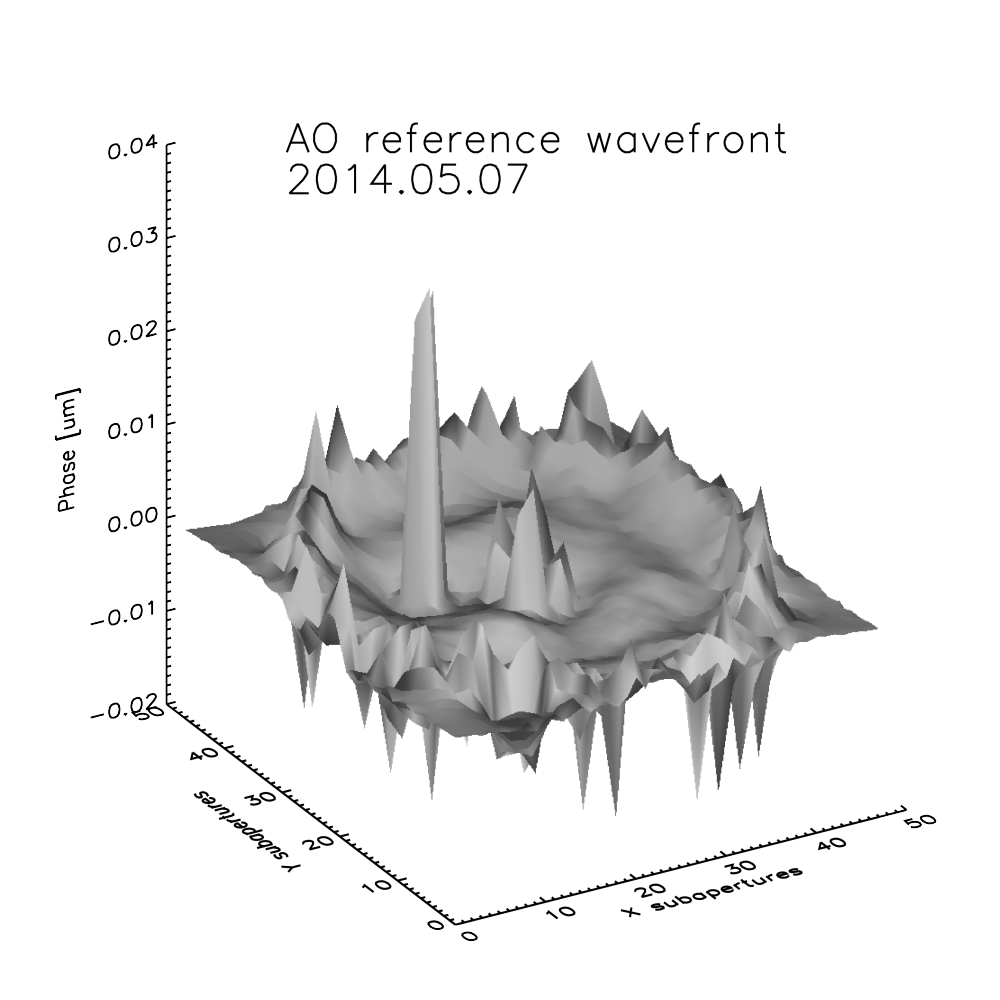 |
For our test measurement we applied two methods to control the wavefront and produce a focus with the AO system. The first method directly commands the woofer in the required shape, working open loop. This method is expected to be less precise since we can be impacted by hysteresis and creeping. The second method works in closed loop and introduces a focus offset via AOWFS reference centroids. The introduced focus offset (starting from a flat reference) is expected to be corrected by the woofer only (low order) and the MEMS should keep its shape. Fig. 5 shows a reference wavefront used for LOWFS focus tests. Even though the 200 nm RMS focus is applied it remains invisible since it is contained in the reference centroids. Therefore, the displayed wavefront is expected to show mainly noise. It is interesting to see that the MEMS appears not to remain entirely unmodified. Handling edge effects on a circular pupil in an optimal way using a Fourier Controller as GPI does is still subject to ongoing research. The “large” (20 nm) spike is coincident with a dead actuator that is masked out.
 |
Moreover, since March 2014 the AO system was modified to handle the focus correction in a separate loop and therefore focus is removed from the slopes before they are fed to the Fourier controller, in order to increase the performance. This feature was successfully commissioned during the May 2014 commissioning run. We also noted a significantly improved LOWFS reference wavefront using this new AO focus loop implementation. This improvement is not too surprising since a Fourier Controller is not optimally suited to handle the very low order wavefront aberrations (tip/tilt, focus, astigmatism). With the successful implementation of the separate AO loop to control focus, we might consider doing the same for astigmatism (similar slopes as focus apart from sign).
3 On-sky commissioning tests
During the last night of May 2014 commissioning run (2014-05-13), we acquired a key data set to proceed with the LOWFS’s focus offload commissioning. We selected a binary star as target and applied a series of different focus offsets. The binary target allowed us to use the coronagraphic mode and having the binary star as Strehl reference target at the same time. For each of these focus offsets, a comprehensive set of AO and CAL telemetry data was saved and science data cubes were taken with GPI’s Integral Field Spectrograph (IFS).
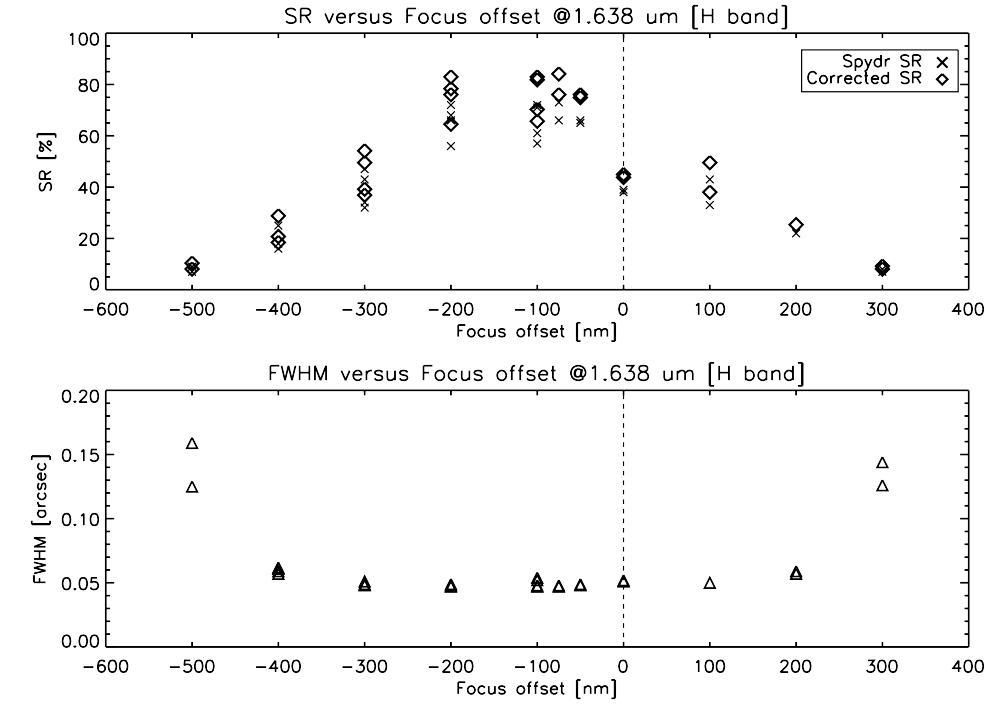
From the GPI pipeline[9] reduced and wavelength calibrated data cubes we selected images at m. This wavelength corresponds to a clean, well-suited frame for SR measurement in the middle range of the data cube where also the wavelength solution should be most reliable. The SR and FWHM values of the companion were calculated using the Spydr software package[10] for each focus value. These parameters are plotted against the focus offset in Fig. 6. The SR is indicated by crosses and the FWHMs by triangles. The best SR performance is reached for a focus offset of -150 nm peak to valley. The off-load of this focus value yields a non-negligible improvement in the instrument’s performance (see Sect. 1) and should be fully automated during the course of this year with the commissioning of LOWFS’s non-common path (focus) correction. We remind the reader that this on-sky focus offset refers to the science detector and not the focal plane mask. At a future moment, another key experiment for a precision calibration of the LOWFS will be to perform a knife-edge experiment on-sky.
The SR ratios are subject to a large error (as indicated by the dispersion) mainly due to the error of background correction on the images. Nevertheless, the largest values are around the 80% mark (H-band) which corresponds to a residual wavefront error of 120 nm RMS. This is roughly twice the value then given by our goal error budget. But these measurements were undertaken under the impact of the significant vibrations that are currently mitigated. We recently demonstrated that the mitigation of these vibrations through active compensation using external hardware or Kalman filtering on the AO controller side will significantly improve our error budget in respect to these measurements[7, 5].
Since the effect of GPI’s apodizer profile on the SR is not taken into account in the Spydr software package, we calculated a correction factor. We obtained this correction factor by simulating the effect of the apodizer profile on the PSF:
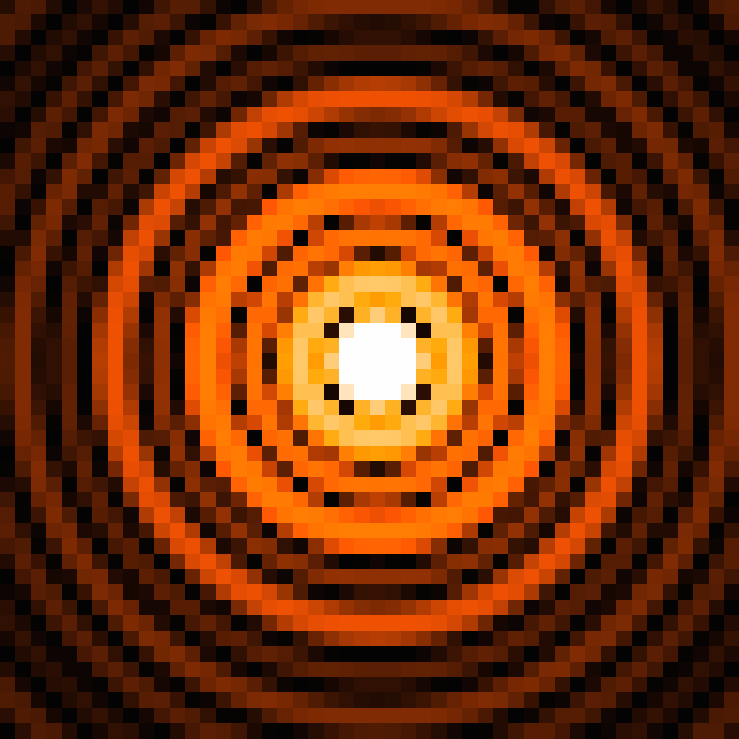
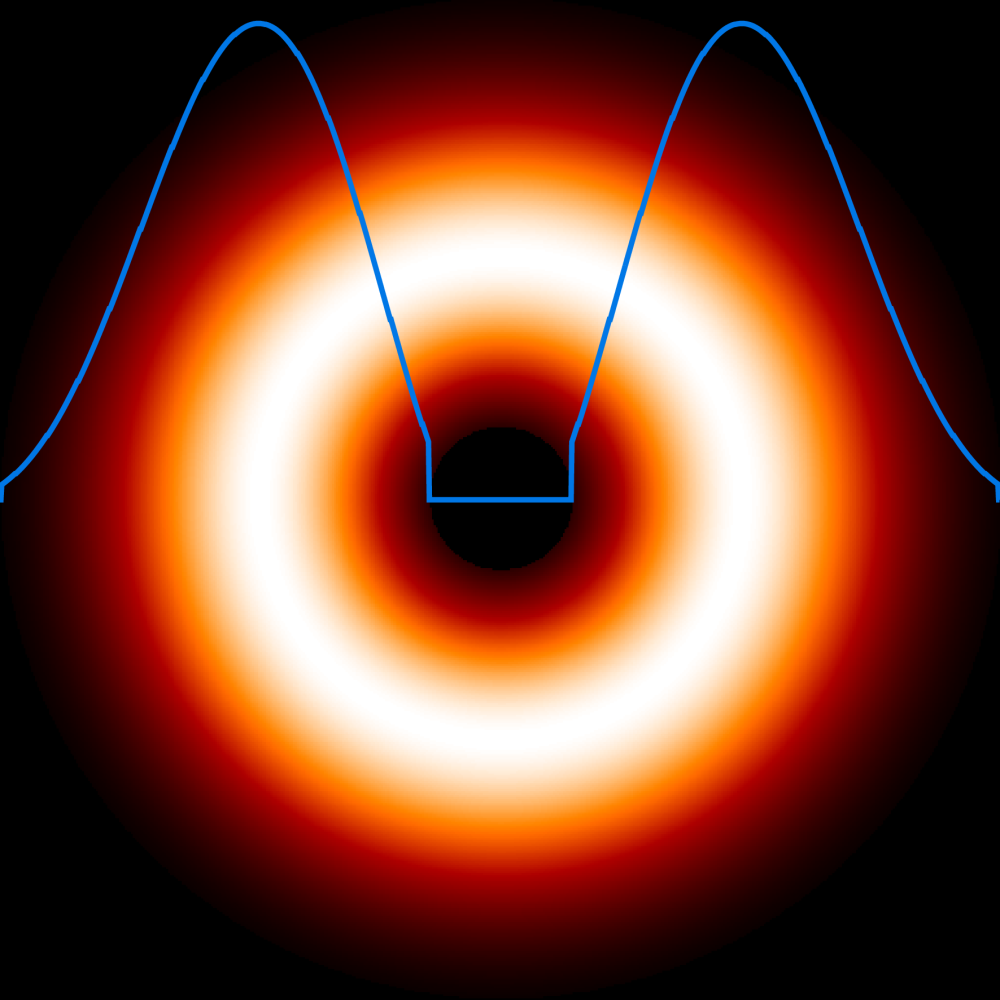
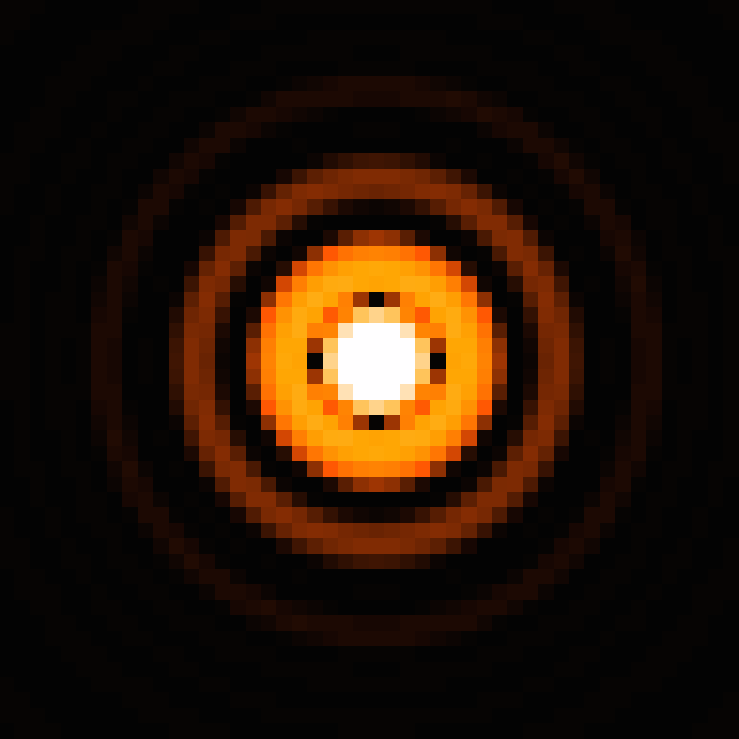
First, we simulate the diffraction of an incoming homogeneous flat wavefront on our telescope aperture ( m, central obscuration = 1.024 m) and we match the spatial sampling to the IFS science detector (14 mas/pixel). In a second step, we “slide” the H apodizer in. Fig. 7 shows how the PSF is reshaped by the apodizer.
Finally, the SR correction factor is calculated as the intensity ratio between each set-up’s PSF (with and without apodizer), with normalized light inputs (the apodizer roughly takes out half of the incident photons). With this approach we obtain a correction factor of 1.15 for the SR.
 (a)
(b)
(c)
4 Summary
The First Light run in November 2013 and the following commissioning runs have been an impressive success. In April 2014 GPI was already offered to the community in an Early Science run without fully implemented mitigation strategies to cancel vibrations[5] and without the powerful upgrades of the AO controller[7] (extraction of rotation signal from centroids of the AO WFS, separate focus AO loop and removal of focus from the Fourier Controller, and the modal gain optimizer). These enhancements are currently commissioned and integrated for standard science operations[6]. Still, the community was more than satisfied by the delivered data and already scientific publications have been produced.
This cleared the road to work on the details for ultimate XAO and high contrast performance such as optimizing NCPA suppression. This paper focused on one of the many elements to address this matter. We shared our challenges and the approach to continue the commissioning of the CAL unit, starting with the low-order NCPA compensation. It is a large effort to achieve the ultimate goals (sense and control the wavefront with a precision of a few nm) in an “adverse” telescope environment (vibrations, thermal drifts, changing gravity). Nevertheless, these challenges have been addressed from different ends[5, 7, 11] and enabled the commissioning of the CAL/LOWFS unit. Technical work on the interface details between the AO system and the CAL is on-going. The next and last foreseen commissioning run of GPI will take place in September 2014 and we demonstrated to have all tools in place to successfully finish the commissioning of NCPA low-order offload. Even without high-order compensation by the HOWFS commissioned yet this will be a major step to keep contrast performance optimal and ensure by itself that GPI can be safely transferred to Gemini science operations by the end of 2014.
Acknowledgements.
The Gemini Observatory is operated by the Association of Universities for Research in Astronomy, Inc., under a cooperative agreement with the NSF on behalf of the Gemini partnership: the National Science Foundation (United States), the National Research Council (Canada), CONICYT (Chile), the Australian Research Council (Australia), Ministério da Ciência, Tecnologia e Inovação (Brazil) and Ministerio de Ciencia, Tecnología e Innovación Productiva (Argentina).References
- [1] Macintosh, B., Graham, J. R., Ingraham, P., Konopacky, Q., Marois, C., Perrin, M., Poyneer, L., Bauman, B., Barman, T., Burrows, A., Cardwell, A., Chilcote, J., De Rosa, R. J., Dillon, D., Doyon, R., Dunn, J., Erikson, D., Fitzgerald, M., Gavel, D., Goodsell, S., Hartung, M., Hibon, P., Kalas, P. G., Larkin, J., Maire, J., Marchis, F., Marley, M., McBride, J., Millar-Blanchaer, M., Morzinski, K., Norton, A., Oppenheimer, B. R., Palmer, D., Patience, J., Pueyo, L., Rantakyro, F., Sadakuni, N., Saddlemyer, L., Savransky, D., Serio, A., Soummer, R., Sivaramakrishnan, A., Song, I., Thomas, S., Wallace, J. K., Wiktorowicz, S., and Wolff, S., “First Light of the Gemini Planet Imager,” Proceedings of the National Academy of Sciences (2014).
- [2] Wallace, J. K., Burruss, R. S., Bartos, R. D., Trinh, T. Q., Pueyo, L. A., Fregoso, S. F., Angione, J. R., and Shelton, J. C., “The Gemini Planet Imager calibration wavefront sensor instrument,” in Adaptive Optics Systems II , Proc. SPIE 7736 (July 2010).
- [3] Savransky, D., Thomas, S. J., Poyneer, L. A., Palmer, D. W., De Rosa, R. J., and Hartung, M., “Focal plane wavefront sensing and control for ground-based imaging,” in Proc. SPIE , 8447 (2012).
- [4] Hinkley, S., Oppenheimer, B. R., Soummer, R., Brenner, D., Graham, J. R., Perrin, M. D., Sivaramakrishnan, A., Lloyd, J. P., Roberts, Jr., L. C., and Kuhn, J., “Speckle Suppression Through Dual Imaging Polarimetry, and a Ground-based Image of the HR 4796A Circumstellar Disk,” Astroph. Journal 701, 804–810 (Aug. 2009).
- [5] Hartung, M., Hayward, T., Saddlemyer, L., Poyneer, L., Cardwell, A., Cavedoni, C., Cho, M., Chilcote, J. K., Collins, P., Dillon, D., Galvez, R., Gausachs, G., Goodsell, S., Guesalaga, A., Hibon, P., Larkin, J., Macintosh, B., Palmer, D., Sadakuni, N., Savransky, D., Serio, A., Rantakyro, F., and Wallace, K., “On-sky vibration environment for the Gemini Planet Imager and mitigation effort,” in Adaptive Optics Systems IV , Proc. SPIE 9148 (2014).
- [6] Rantakyro, F. T., Cardwell, A., Chilcote, J., Dunn, J., Goodsell, S., Hibon, P., Macintosh, B., Quiroz, C., Marshall, D. P., Sadakuni, N., Saddlemyer, L., Savransky, D., Serio, A., Winge, C., Galvez, R., Gausachs, G., Hardie, K., Hartung, M., Luhrs, J., Poyneer, L., and Thomas, S., “Gemini planet imager integration to the gemini south telescope software environment,” in Observatory Operations: Strategies, Processes, and Systems V , Proc. SPIE 9149 (2014).
- [7] Poyneer, L. A., De Rosa, R. J., Macintosh, B., Palmer, D. W., Perrin, M. D., Sadakuni, N., Savransky, D., Bauman, B., Cardwell, A., Chilcote, J. K., Dillon, D., Gavel, D., Goodsell, S. J., Hartung, M., Hibon, P., Rantakyrö, F. T., Thomas, S., and Véran, J.-P., “On-sky performance during verification and commissioning of the Gemini Planet Imager’s adaptive optics system,” in Adaptive Optics Systems IV , Proc. SPIE 9148 (2014).
- [8] Hartung, M., Macintosh, B., Poyneer, L., Savransky, D., Gavel, D., Palmer, D., Thomas, S., Dillon, D., Chilcote, J., Ingraham, P., Sadakuni, N., Wallace, K., Perrin, M., Marois, C., Maire, J., Rantakyro, F., Hibon, P., Saddlemyer, L., and Goodsell, S., “Final A&T stages of the Gemini Planet Finder,” in Proceedings of the Third AO4ELT Conference , Esposito, S. and Fini, L., eds. (Dec. 2013).
- [9] Perrin, M. D., Maire, J., Ingraham, P., Savransky, D., Millar-Blanchaer, M., Wolff, S. G., Ruffio, J.-B., Wang, J. J., Draper, Z. H., Sadakuni, N., Marois, C., Rajan, A., Fitzgerald, M. P., Macintosh, B., Graham, J. R., Doyon, R., Larkin, J. E., Chilcote, J. K., Goodsell, S. J., Palmer, D. W., Labrie, K., Beaulieu, M., De Rosa, R. J., Greenbaum, A. Z., Hartung, M., Hibon, P., Konopacky, Q., Lafreniere, D., Lavigne, J.-F., Marchis, F., Patience, J., Pueyo, L., Rantakyrö, F. T., Soummer, R., Sivaramakrishnan, A., Thomas, S., Ward-Duong, K., and Wiktorowicz, S., “Gemini Planet Imager Observational Calibrations I: Overview of the GPI Data Reduction Pipeline,” in Ground-based and Airborne Instrumentation for Astronomy V , Proc. SPIE 9147 (2014).
- [10] Rigaut, F., “Spydr - Image Analysis Software, based on yorick.” https://github.com/frigaut/yorick-spydr.
- [11] Sadakuni, N., Macintosh, B. A., Palmer, D. W., Poyneer, L. A., Max, C. E., Savransky, D., Thomas, S. J., Cardwell, A., Goodsell, S., Hartung, M., Hibon, P., Rantakyrö, F., Serio, A., and with the GPI team, “Effects of differential wavefront sensor bias drifts on high contrast imaging,” in Adaptive Optics Systems IV , Proc. SPIE 9148 (2014).