Send correspondence to Markus Hartung: mhartung@gemini.edu, Telephone: +56-51-2205 664
On-sky vibration environment for the Gemini Planet Imager and mitigation effort
Abstract
The Gemini Planet Imager (GPI) entered on-sky commissioning and had its first-light at the Gemini South (GS) telescope in November 2013. GPI is an extreme adaptive optics (XAO), high-contrast imager and integral-field spectrograph dedicated to the direct detection of hot exo-planets down to a Jupiter mass. The performance of the apodized pupil Lyot coronagraph depends critically upon the residual wavefront error (design goal of 60 nm RMS with 5 mas RMS tip/tilt), and therefore is most sensitive to vibration (internal or external) of Gemini’s instrument suite. Excess vibration can be mitigated by a variety of methods such as passive or active dampening at the instrument or telescope structure or Kalman filtering of specific frequencies with the AO control loop. Understanding the sources, magnitudes and impact of vibration is key to mitigation. This paper gives an overview of related investigations based on instrument data (GPI AO module) as well as external data from accelerometer sensors placed at different locations on the GS telescope structure. We report the status of related mitigation efforts, and present corresponding results.
keywords:
High-contrast imaging, vibration absorbers, LQG, Kalman filter, telescope vibrations1 GPI’s Vibration history
 |
Vibrations have been a concern since early in the GPI project[1]. Questions like what are the maximum allowable vibration levels from the telescope environment or what is the impact of wind shake (also during target acquisition) had been specified and discussed between the observatory and GPI collaboration from early on. Ironically, during on-sky commissioning it turned out that the most dominant source of vibrations arose from GPI’s own cryocoolers which are injected into the telescope structure. GPI’s Integral Field Spectrograph[2] (IFS) is cooled by two Stirling cycle cryocoolers (Sunpower CryoTel GT). Already in 2011 (when the IFS was still at UCLA) it became clear that the coolers were a not negligible source of vibrations at 60 Hz (and harmonics) causing microphonic effects on the science detector. Design modifications were undertaken to eliminate microphonics and the coupling into the IFS was reduced via Sorbothane washers.[3]. Furthermore, a study was undertaken by CSA Moog to determine resonance frequencies of GPI[4]. During the pre-shipment acceptance test review (July 2013) even though the injection of vibration from the coolers had been significantly suppressed, the tip/tilt power spectra showed that we still did not fully meet the specification ( 4 mas RMS on a bright star excluding measurement noise) but it was demonstrated that this effect could be mitigated by implementing a Linear-Quadratic-Gaussian (LQG) controller (Kalman filter)[5]. The fine tuning of the LGQ parameters (carefully watching loop stability) continued as soon as GPI arrived in the Cerro Pachon laboratory (Aug - Oct 2013). Also during this period we studied carefully the beating effect of the two cryocoolers. A slight discrepancy (or instability) in the nominal frequency of 60 Hz caused the coolers to cycle through an in- and counter-phase state in a time period of 20 to 30 min producing a change of the vibration amplitude up to a factor of 4. A changing gravity vector also seemed to play a role. For these reasons, we upgraded the Sunpower controller board in January 2014 to a new model that can drive the two cryocoolers with a constant relative phase. As expected, an optimal result is achieved when the coolers are driven exactly counter phase. With this new board the beating effect disappeared and the injected vibrations were kept to a minimum.
| Zernike Mode | Amplitude (relative to focus) | Phase (rad) |
|---|---|---|
| Focus | 1.00 | 0 |
| Trefoil (45°) | 0.14 | 0 |
| Spherical | 0.15 |
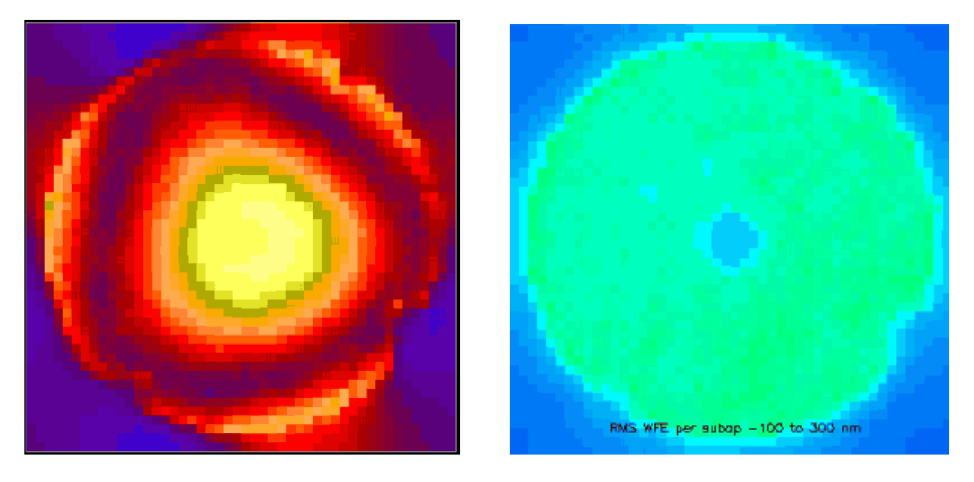
In November and December 2013 we had our first two commissioning runs at the telescope. During these runs, we focused on basic functionalities, such as closing the loops (tip/tilt, woofer, tweeter), loop stability, off-loading to the secondary mirror (M2), and measurements for the on-sky wavefront error budget. During our first closed-loop on-sky night in November we were surprised by a triangular shape in the RMS phase map (Fig. 1). This shape was caused by a 60 Hz mode in the wavefront that mostly projects into focus. On the other hand, the 60 Hz tip/tilt error showed up in predicted levels and was already successfully mitigated during the March 2014 commissioning run. The tip/tilt LQG filter is meanwhile fully implemented to be part of regular observations. The filter can be adjusted with a comprehensive set of parameters (watching loop stability for an aggressive tuning). Common and non-common path tip/tilt signals can be addressed as required.[5, 6].
The triangular shape in the RMS map was never seen in the laboratory (using GPI’s internal calibration source, the Artificial Star Unit - ASU). But switching off GPI’s cryocoolers removed any doubt that this signal originates from GPI and is transmitted into Gemini’s instrument support and telescope structure. During the March 2014 commissioning run we obtained a detailed diagnosis of the 60 Hz triangular shape on RMS map. We filtered the AO telemetry at 60 Hz to inspect the phase and amplitude relation ship for the lowest Zernike modes and indeed, we could confirm that the triangular shape is caused by a mode consisting mainly of focus, trefoil and spherical (Table 1). The mode is dubbed “Onigiri”-mode because of its similarity with this Sushi delicacy. The phase shift of for the spherical Zernike mode means a sign flip in respect to the other modes. Using the exact same LQG framework as for tip-tilt (but with different model coefficients) we can correct the 60 Hz focus signal (the largest component of the Onigiri-mode). An extra step is needed to remove the focus signal from the centroids for direct control, see Poyneer et al.[5] for more detail.111The CANARY team also implemented successfully an LQG controller for higher orders.[7] Since the May 2014 run (our last commissioning run before Gemini South winter shutdown period) the focus LQG control is implemented and we demonstrated that the 60 Hz focus signal can be fully suppressed (below a negligible value of 2 nm RMS). As a next step we like to experiment with adding the higher order Zernike terms (trefoil, spherical) and make the higher-order LQG controller part of standard science operations.
Even though the successful mitigation of LQG filters (tip/tilt and focus signals) works impressively, there are reasons not to abandon a “root” treatment - that is to eliminate the 60 Hz excitation directly at GPI’s IFS. The high-order wavefront sensor of GPI’s calibration unit[8] (a Mach-Zehner type interferometer) cannot be successfully commissioned with these internal vibrations because of a strong loss in fringe contrast. Furthermore, we are investigating in how far other instruments (like GeMS) are impacted and it is always best to keep the telescope vibration environment as quiet as possible.
 |
 |
2 Vibrations: Simulations and measurements
2.1 The Onigiri mode
In this section we concentrate on the dominant Zernike mode of which the Onigiri-mode is composed, that is the focus mode (Table 1). The continuous line in Fig 2 shows the power of the focus contribution as it evolved over the March 2014 run. Therefore, all available AO telemetry was filtered for 60 Hz and the focus mode extracted. The levels range between 80 and 150 nm RMS. The dates in the plot indicate the start and the end of the individual commissioning nights. Intermittently, the signal drops to almost zero - this corresponds to daytime telemetry on the internal calibration source. (The dashed line indicates whether the focus mode was included in the Fourier reconstructor or if the separate focus loop was active. This information can be ignored for our purpose here.) Eq. 1 is used to convert an RMS wavefront error into a focus shift given an f-number of :
| (1) |
Thus, a 150 nm RMS focus wavefront error (WFE) corresponds to a 1 mm focus offset at the Cassegrain focus (f/D = 16). The same focus WFE also arises for a translation of m of M2 relative to M1 (or M1 relative to M2, f/D = 1.8). Nevertheless, be reminded that if no translation were involved to explain the focus vibration but just a (parabolic) bending of a surface in the beam, the corresponding peak to valley sagitta movement is “only” nm.222Multiplication by converts the RMS value into peak to valley (of a focus wavefront in a circular pupil). As we describe in the next section, acceleration measurements show that that the primary mirror (M1) appears to undergo such a sagitta movement that could explain most of the 60 Hz-focus vibrations.
2.2 Accelerometer measurements
To investigate the transmission of GPI’s 60 Hz vibration into the telescope, an extensive set of accelerometer measurements was taken at different locations of the telescope[9]. This study is on-going and led by the telescope scientist Tom Hayward. It is a large effort to understand and mitigate vibrations for the Gemini telescopes in general and is not only GPI related. Here, we present a small extract of this comprehensive study and some key insights concerning the transmission of vibrations in the GPI context.
 |
A high priority has been to understand and mitigate the excitation of the Onigiri-mode, particularly its focus contribution, and which optical surface or surfaces are creating it. GPI’s internal surfaces are excluded since it is not seen internally on the ASU.
First, accelerometer sensors were placed on the M2 support structure. We measured an acceleration of 0.010 m/s2 corresponding to a displacement amplitude of 0.07 m at 60 Hz. This is only 0.5% of the required displacement of 13 m (see Sect.2.1) to explain a focus WFE of 150 nm RMS by a pure translatory motion. The stiffness of M2 should not allow for a substantial flexing to create a relevant focus term.
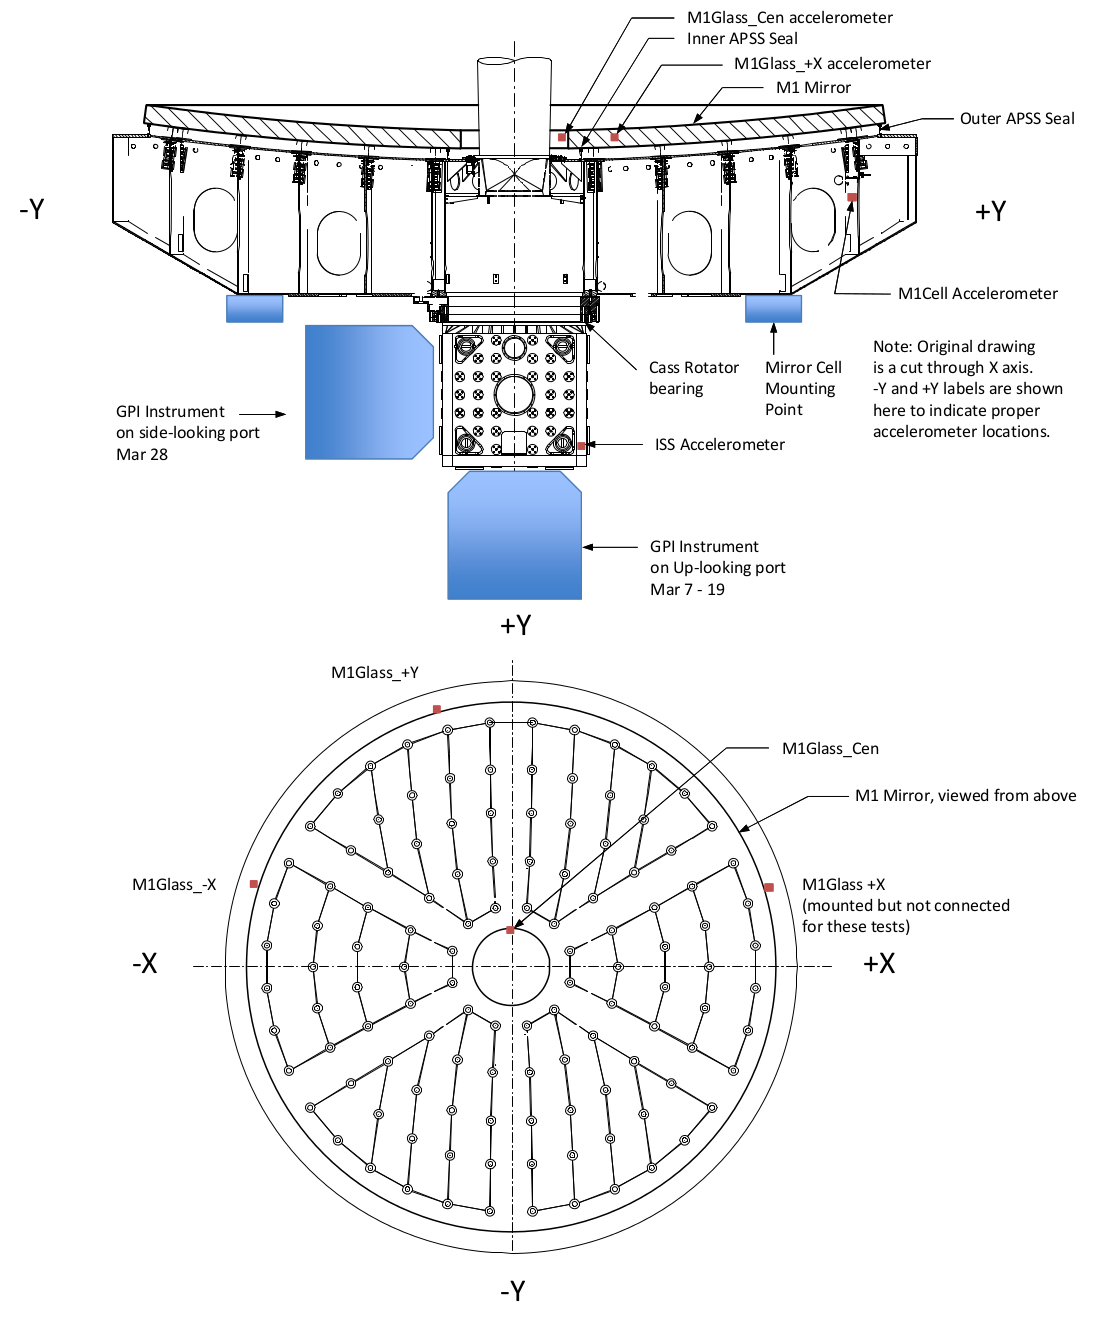
As a next step, we installed accelerometer sensors on the primary mirror M1. Fig. 3 shows a schematic of M1 with the locations of the sensors at the center and the mirror edge marked as red squares. The weight of the mirror is supported 120 hydraulic actuators (marked by circles in the top view) and by an air cavity. The air cavity sustains 80% of the mirror’s weight and the actuators only carry the remaining 20%. The cavity (dubbed “air bag”) can be seen in the side view. The inner and outer seals of the Air Pressure Support System (APSS) are also indicated. In the near future we will install a dedicate pressure sensor inside the cavity to investigate in how far vibrations are transmitted via the APSS.
The accelerometer measurements showed that the central part of the mirror (sagitta) is moving at 60 Hz against the edges with a measured maximum acceleration of 0.06 m/s2 at the mirror center which corresponds to an amplitude of 0.422 m. This translates in a 122 nm RMS wavefront error if we simply interpret this sagitta movement being solely responsible for the focus wavefront error. But since we still lack information on the exact phase relation ship between edge and center sensors this value should be seen as an order of magnitude value. Nevertheless, this experiment gives striking evidence that all or the major part of the 60 Hz focus vibration originates from a flexing surface of M1.
Fig. 4 shows an example of one of the many time series and power spectra of the Gemini South / GPI vibration study[9]. The dominant line of the power spectra (right plot) is the 60 Hz signal from GPI (other lines are at 50 and 100 Hz). The ratio of the acceleration amplitudes (linear to Peak-to-Peak displacements) for different test scenarios can be best compared in the time series on the left side. The largest amplitude (blue line, legend index 3) is obtained when the two GPI cryocoolers are tuned to oscillate in phase (0 deg) and the APSS pressurized to its default as for regular night time observing (“unparked”). The green line (legend index 2) corresponds to the two cryocoolers tuned to counter phase (180 deg) which minimizes the injection of the 60 Hz signal. This is also a demonstration of the successful Sunpower controller upgrade (overseen by L. Saddlemyer and Gausachs) that was done in February 2014. If the telescope is “parked”, i.e. if the “air bag” is deflated the amplitude goes even further down (red, legend index 1) and the 60 Hz contribution disappears completely (grey line, legend index 4) if the cryocoolers are switched off.
2.3 Further remarks on the origin of the Onigiri-mode
The M1 and M2 acceleration measurements showed that at least the major part of the focus amplitude originates from M1. The contributions of the higher Zernike orders (coma, spherical) are small (approx. 20 nm RMS or smaller) and the triangular shape is still not fully understood.
First, we suspected M2 to be the source of the triangular shape since it is mounted with three links (120 deg apart) to the M2 support structure. On the other hand, as seen on the top view of M1 (Fig. 3), the hydraulic actuators are organized into six segments which are pairwise interconnected which might also explain the triangular geometry. Further acceleration measurements at additional locations on M1 and M2 would be needed to completely understand the origin of the triangular shape. In practice these measurements require significant resources. This underlines the importance to have a suite of (ideally triaxial) acceleration sensors permanently mounted at the telescope with sufficient read-out channels.
 |
2.4 FEA study of primary mirror response to an APSS force
In the context of GPI’s 60 Hz vibrations, a Finite Element Analysis (FEA) was done by Myung Cho to study the effect of the APSS on the mirror figure.[10] Here we give a short summary of preliminary key results of this effort which is also substantial to understand Gemini’s vibration environment in general and to develop suitable mitigation strategies. The model aims to include all hardware mounted on the outer edge of the mirror, the air cavity seals at their nominal positions and with their nominal forces (outer seal 283 N/m, inner seal 484 N/m). Furthermore, axial support locations, forces, and the effect of the air pressure in the cavity (”air bag”) is included. These are the preliminary results based on the FEA model:
In the static case, to obtain a WFE of 100 nm RMS requires a force per meter of 1.6 N/m or 8.1 N/m on the outer or inner seal, respectively. This corresponds to a total force of 40.5 N or 37.3 N on the the outer or inner seal, respectively.
The dynamic amplification yields approximately a factor of 7 and the required excitation force to generate a 100 nm RMS WFE is reduced to approximately 5.5 N for the inner or outer seal. (The WFE on the mirror figure is much smaller if inner and outer seal are excited in phase with the same force.)
To conclude, this FEA study shows that a dynamic force (60 Hz) as small as 5.5 N on the APSS is sufficient to cause the seen WFE. It is plausible that the excitation forces of GPI’s cryocoolers can easily account for this transmitted force and this study is also consistent with the accelerometer results.
3 A short theory reminder vibration absorbers and terminology
 |
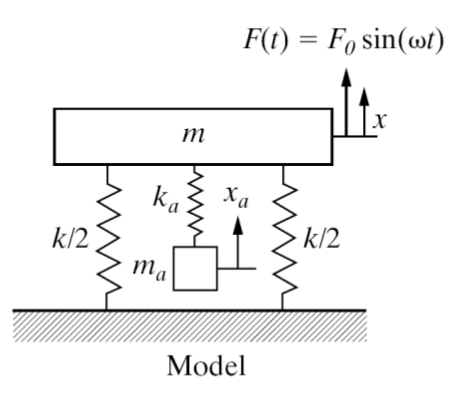
In the concept of an harmonic oscillator the natural angular frequency is given by ( for primary system) where is the spring constant and the mass.333This is common lecture book knowledge, e.g. see the book of Hartog on mechanical vibrations[11]. The Internet provides plenty of material, such as free MIT online lectures on vibrations[12] or the website or Russel, Penn. State University[13]. This is the only frequency a 1-degree of freedom system (dof) oscillates at if no other forces are applied. If an oscillating external force acts on a primary mass as shown in Fig. 5 then this force can be compensated for by attaching an absorber mass to the primary mass. This converts a 1-dof system into a 2-dof system with two eigen-frequencies slightly different from the natural frequencies of the separate systems. If the natural frequency of the absorber mass ( for absorber system) exactly matches the external force frequency , the forces cancel out and the displacement amplitude of the primary mass is zero.
Substituting a synchronous motion (Eq. 2) into the equations of motion (Eq. 3)
| (2) |
| (3) |
yields a displacement amplitude of
| (4) |
or a normalized displacement of the primary mass of
| (5) |
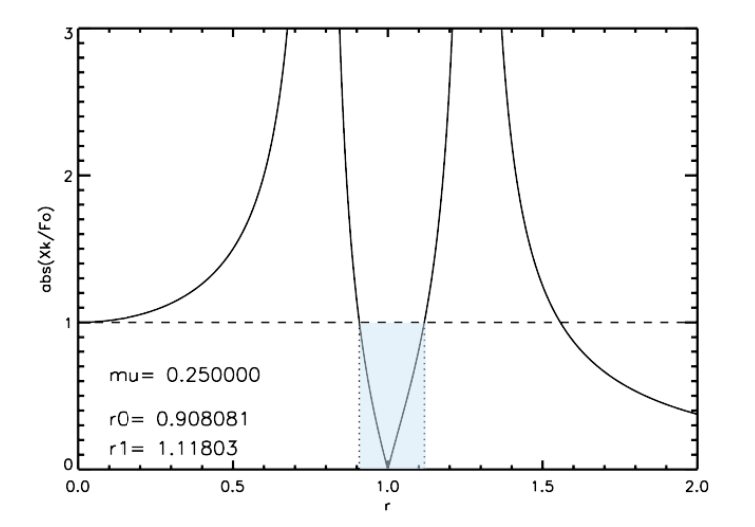
where , and . The normalized displacement (Eq. 5) is shown in Fig. 6. The shaded square indicates the useful operating bandwidth of the absorber system () for a specific absorber mass to mass ratio of 1/4 (. Recommended mass ratios range between The higher the mass ratio (i.e. the larger the absorber mass) the larger the usable bandwidth but for practical reasons and engineering constraints the absorber mass is usually kept as small as possible. Table 2 lists “useful” bandwidths for a few different mass ratios. Particularly for small absorber masses (small ) it is important to remind that the absorber system can amplify vibrations if not carefully tuned.
| mass ratio | useful bandwidth (%) | ||
|---|---|---|---|
| 0.01 | 0.995 | 1.005 | 0.99 |
| 0.05 | 0.977 | 1.025 | 4.78 |
| 0.10 | 0.957 | 1.049 | 9.19 |
| 0.25 | 0.908 | 1.118 | 21.0 |
4 Vibration Mitigation with Hardware
4.1 Tunable Vibration Absorbers & Tuned Mass Dampers
 |
In the short theory section we reminded about the basics to mitigate vibrations by attaching an undamped absorber mass system. Such systems are typically referred to as Tunable Vibration Absorbers (TVA). They are a good choice if the vibration response is dominated by a single frequency (nearby motor, pump or other disturbance source). This frequency should be separated far enough from a structural resonance frequency otherwise a Tuned Mass Damper (TMD) is likely a better choice.
TMDs are suited to reduce modal frequencies of a structure that are excited by any means (motors, mechanical shock, wind, etc). The difference between a TMD and a TVA is that a damping term is included:
| (6) |
whereby F(t) is the external excitation force and the term describing the dampening. This term is physically realized by an element that dissipates energy. It could be simply a visco-elastic medium or a using a magnetic device similar to a voice coil. The second approach has the advantage that it can also be used for an active compensation.
 |
| Frequency | 60 Hz (tuning screws 59.5 to 60.5 Hz) |
|---|---|
| Moving Mass | 2.26 lbs (1.03 kg) |
| Total Mass | 2.26 lbs (1.03 kg) |
| Max Stroke (hard limit) | 0.135” (3.43 mm) |
| Estimated operational stroke | 0.100” (2.54 mm) |
| Force reacted at 60Hz and 0.100” | 334 N |
| Force reacted at 60Hz and 0.135” | 467 N |
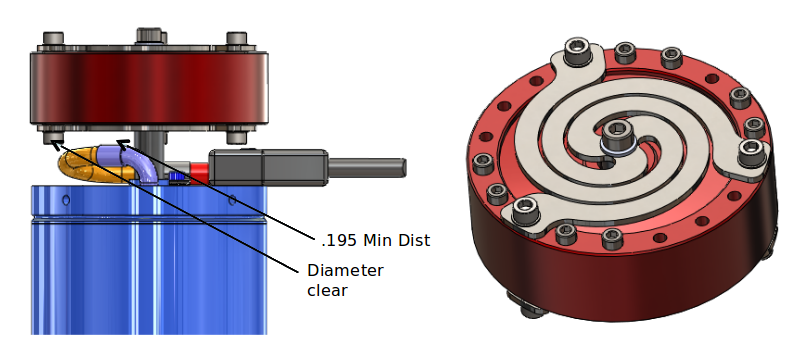
Fig. 7 shows one of the two GPI cryocoolers with a TVA from CSA Moog mounted. Its specifications are listed in Tab. 3. The TVA is specified for 60 Hz and can be finetuned by 0.5 Hz using the depicted tuning screw. As stated in Sect. 3 the fine tuning is critical for absorbing efficiency. In the worst case amplification can occur, particularly if a natural structural mode is located in the close neighborhood. It is notable (Table 3) that even though the TVA mass is only about one kilogram and has a maximum stroke of a three and a half mm, a reacting force444The reacting force corresponds to the centripetal force with an angular frequency and a “stroke” : . up to 467 N is created at 60 Hz (corresponding to 48 kg if translated into weight). After shipment and arrival of GPI to Cerro Pachon in Chile, it appeared that the TVAs lost their effectiveness which is currently investigated by CSA (and the TVAs were dismounted from the cryocooler heads for inspection). For the next commissioning run in September 2014 we expect these TVAs to be mounted again with a corrected fine-tuning.
4.2 GPI modal study
| Mode | TMD | Modal | f (Hz) | TMD moving | Comment | |
| Location | mass (kg) | mass (kg) | ||||
| 1 | Interface Ring | 2,276 | 48.7 | 22.8 | 0.01 | GPI frame torsion about Y |
| 2 | Interface Rings | 2,172 | 52.2 | 21.7 | 0.01 | GPI frame rocking about Y |
| 3 | CAL | 213 | 74.6 | 2.1 | 0.01 | CAL plunging in Z against rocking IFS |
| 4 | CAL | 450 | 80.4 | 4.5 | 0.01 | IFS bouncing against GPI frame |
| 5 | CAL | 690 | 93.8 | 6.9 | 0.01 | CAL rocking about Y |
| 6 | CAL | ? | 114.9 | ? | CAL torsion | |
| 7 | CAL | 422 | 126.5 | 4.2 | 0.01 | CAL and IFS rocking about X, Z |
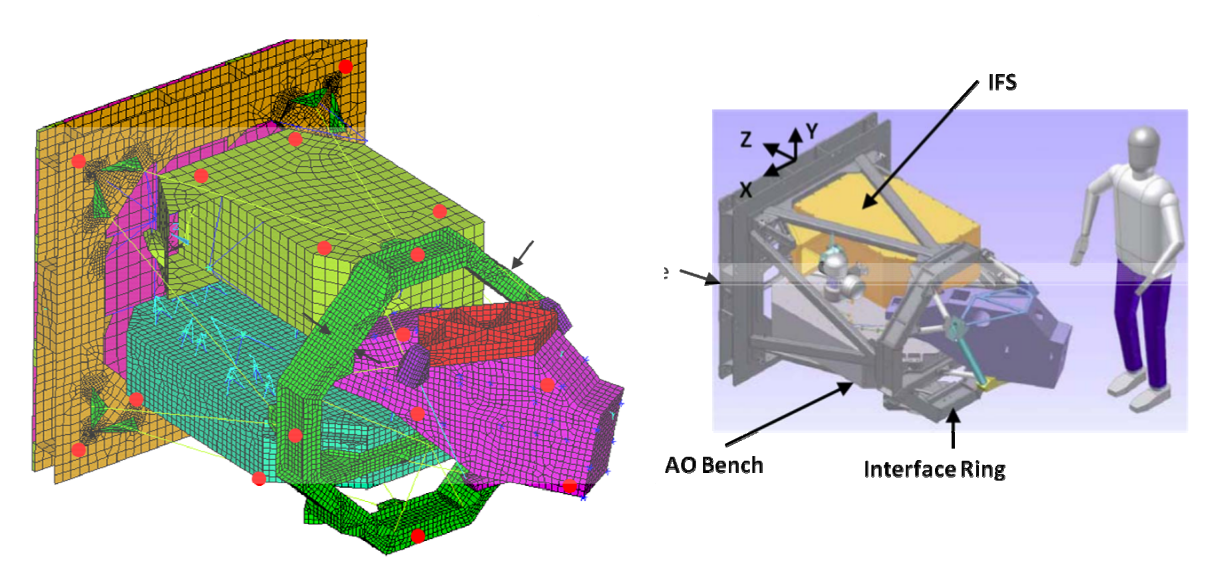
CSA Moog was contracted to study GPI’s modal frequencies[4]. They prepared a wire frame model for simulation. Test measurements were done using a modal hammer to excite the GPI structure and accelerometer sensors were attached to measure the response. Fig. 8 visualizes the wire frame model. The excitation locations are marked with black arrows; one arrow is hidden behind the purple CAL unit. The red dots indicate the locations of the accelerometer sensors. Tab. 4 shows the extracted modes from their data set in the frequency range from 40 to 150 Hz. All recommended masses for the TMDs by CSA are based on a mass ratio of . The study was done in December 2012 while GPI was in the A&T laboratory[14] at UCSC and mounted to a carriage creeper (dubbed the “L-frame”). The first two modes with the lowest frequencies (49 and 52 Hz) are likely to shift when GPI is attached to the telescope. This is one of the reasons why no TMDs have been installed yet. The decision was taken to revisit this study once enough on-telescope experience is gained to evaluate if TMDs are required. To this point no TMDs are installed and so far it seems that no TMDs are required. The main vibration line in our error budget (60 Hz) is not on a structural mode assuming that the two low frequency structural modes of GPI have not shifted through the mounting at the telescope in an unfortunate way.
5 Summary
The topic of vibration in general is complex and is a topic prone to misunderstandings between mechanics, opticians, electrical engineers and scientists. An awareness of context and language is critical in this interdisciplinary field. Coordinating a sensible and successful vibration mitigation effort in an effective way is a challenge and requires its resources and roles such as an interconnected project manager and a “vibration officer”. There is a constant struggle with hard decisions: Does it make sense to spend the extra dollar to finish a study that runs out of funding? And avoiding the “sunk cost” effect in a “prototype” development environment is never easy.
GPI has the strongest constraints on its wavefront error budget of all Gemini South instruments and certainly has risen the observatory’s awareness of vibrations in the telescope environment. The mitigation using an LQG controller for both pointing and focus has been implemented successfully. This is an intriguing demonstration of how new technologies can be used to mitigate vibration effects from the controller side. In that sense, using the LQG controller, the impact of the cryocooler vibrations on GPI’s performance is low if not negligible. The only exception is the high-order wavefront front sensor of the CAL unit. It is a Mach-Zehnder type interferometer and the loss in fringe contrast due to the vibration prevents its commissioning. Fortunately, this is not critical, since the basic functionalities of the CAL (keeping the star bore-sight, and low-order wavefront sensing) are not impacted. Furthermore, the GPI team has developed further alternatives to treat NCPA such as speckle-nulling. And so far, even though other instruments such as GeMS can see the vibration signal on their wavefront sensors, it seems that there is no impact on performance555We are still waiting for a confirmation of this statement for excellent seeing conditions. For medium or worse seeing conditions, we confirmed already that performance is not impacted. Nevertheless, a “root treatment” is always preferable and it is in the observatory’s natural interest to keep its “vibration” spectra as clean as possible. Recently, Sunpower has developed an Active Cancellation System (ACS) as add-on for its GT cryocooler series and we are investigating to upgrade our coolers with it.
There is widespread use of TMDs for aircrafts, machinery, in the car industry, for trains and railways, buildings, power lines and in optical systems. And certainly there is still plenty of room to make a better use of these devices in the field of astronomical instrumentation and optical telescopes.
A good infrastructure of acceleration sensors is required to effectively understand and solve unwanted vibrations. Otherwise measurements are difficult to obtain and to confirm, and resources of the observatory are wasted in large overheads. In the case of the Gemini Observatory it seems recommendable to have at least 5 sensors around the cell of M1 (and one could dream about having each hydraulic M1 actuator equipped with a sensor). ELTs will take this matter (hopefully) serious, plan for an integrated design and maybe feature a dedicated “vibration control room”.
As GPI and other (XAO) instruments can always be seen as pathfinders for future telescopes and instrumentation, sharing our challenges is hopefully helpful to find suitable solutions in other complex environments. GPI can serve as a good example for the successful implementation of a mitigation strategy and for how powerful mitigation strategies such as LGQ filtering of the wavefront have become.
Acknowledgements.
The authors thank Paul Langlois for suggestions and improvements on the figures. The Gemini Observatory is operated by the Association of Universities for Research in Astronomy, Inc., under a cooperative agreement with the NSF on behalf of the Gemini partnership: the National Science Foundation (United States), the National Research Council (Canada), CONICYT (Chile), the Australian Research Council (Australia), Ministério da Ciência, Tecnologia e Inovação (Brazil) and Ministerio de Ciencia, Tecnología e Innovación Productiva (Argentina).References
- [1] Macintosh, B., Graham, J. R., Ingraham, P., Konopacky, Q., Marois, C., Perrin, M., Poyneer, L., Bauman, B., Barman, T., Burrows, A., Cardwell, A., Chilcote, J., De Rosa, R. J., Dillon, D., Doyon, R., Dunn, J., Erikson, D., Fitzgerald, M., Gavel, D., Goodsell, S., Hartung, M., Hibon, P., Kalas, P. G., Larkin, J., Maire, J., Marchis, F., Marley, M., McBride, J., Millar-Blanchaer, M., Morzinski, K., Norton, A., Oppenheimer, B. R., Palmer, D., Patience, J., Pueyo, L., Rantakyro, F., Sadakuni, N., Saddlemyer, L., Savransky, D., Serio, A., Soummer, R., Sivaramakrishnan, A., Song, I., Thomas, S., Wallace, J. K., Wiktorowicz, S., and Wolff, S., “First Light of the Gemini Planet Imager,” Proceedings of the National Academy of Sciences (2014).
- [2] Larkin, J. E., Chilcote, J. K., Aliado, T., Bauman, B. J., Brims, G., Canfield, J. M., Cardwell, A., Dillon, D., Doyon, R., Dunn, J., Fitzgerald, M. P., Graham, J. R., Goodsell, S., Hartung, M., Hibon, P., Ingraham, P., Johnson, C. A., Kress, E., Konopacky, Q. M., Macintosh, B. A., Magnone, K. G., Maire, J., McLean, I. S., Palmer, D., Perrin, M. D., Quiroz, C., Rantakyrö, F., Sadakuni, N., Saddlemyer, L., Serio, A., Thibault, S., Thomas, S. J., Vallee, P., and Weiss, J. L., “The Integral Field Spectrograph for the Gemini Planet Imager,” in Ground-based and Airborne Instrumentation for Astronomy V , Proc. SPIE 9147 (2014).
- [3] Chilcote, J. K., Larkin, J. E., Maire, J., Perrin, M. D., Fitzgerald, M. P., Doyon, R., Thibault, S., Bauman, B., Macintosh, B. A., Graham, J. R., and Saddlemyer, L., “Performance of the integral field spectrograph for the Gemini Planet Imager,” in Ground-based and Airborne Instrumentation for Astronomy IV , Proc. SPIE 8446 (Sept. 2012).
- [4] Pargett, T., “Gemini Planet Imager (GPI) Modal Test Report,” CSA Report No. 2012712 (Dec. 2012).
- [5] Poyneer, L. A., De Rosa, R. J., Macintosh, B., Palmer, D. W., Perrin, M. D., Sadakuni, N., Savransky, D., Bauman, B., Cardwell, A., Chilcote, J. K., Dillon, D., Gavel, D., Goodsell, S. J., Hartung, M., Hibon, P., Rantakyrö, F. T., Thomas, S., and Véran, J.-P., “On-sky performance during verification and commissioning of the Gemini Planet Imager’s adaptive optics system,” in Adaptive Optics Systems IV , Proc. SPIE 9148 (2014).
- [6] Poyneer, L. A. and Véran, J.-P., “Kalman filtering to suppress spurious signals in adaptive optics control,” J. Opt. Soc. Am. A 27(11), A223–A234 (2010).
- [7] Sivo, G., Kulcsár, C., Conan, J.-M., Raynaud, H.-F., Gendron, E., Basden, A., Vidal, F., Morris, T., Meimon, S., Petit, C., Gratadour, D., Martin, O., Hubert, Z., Sevin, A., Perret, D., Chemla, F., Rousset, G., Dipper, N., Talbot, G., Younger, E., Myers, R., Henry, D., Todd, S., Atkinson, D., Dickson, C., and Langmore, A., “First on-sky SCAO validation of full LQG control with vibration mitigation on the CANARY pathfinder,” Optics Express (2014).
- [8] Wallace, J. K., Angione, J., Bartos, R., Best, P., Burruss, R., Fregoso, F., Levine, B. M., Nemati, B., Shao, M., and Shelton, C., “Post-coronagraph wavefront sensor for Gemini Planet Imager,” in Adaptive Optics Systems , Proc. SPIE 7015 (July 2008).
- [9] Hayward, T., “Gemini South / GPI Vibration Test Report,” Rev. 3, Gemini Observatory, internal report (May 2014).
- [10] Cho, M., “Gemini Primary Mirror Response to GPI vibration - M1 airbag effects - Static and dynamic responses,” internal report (2014).
- [11] Hartog, D., Mechanical Vibrations , Dover (1985).
- [12] Massachusetts Institute of Technology, “MIT OpenCourseWare.” http://ocw.mit.edu/courses/find-by-topic/.
- [13] Russel, “Acoustics and vibration animations.” http://www.acs.psu.edu/drussell/.
- [14] Hartung, M., Macintosh, B., Poyneer, L., Savransky, D., Gavel, D., Palmer, D., Thomas, S., Dillon, D., Chilcote, J., Ingraham, P., Sadakuni, N., Wallace, K., Perrin, M., Marois, C., Maire, J., Rantakyro, F., Hibon, P., Saddlemyer, L., and Goodsell, S., “Final A&T stages of the Gemini Planet Finder,” in Proceedings of the Third AO4ELT Conference , Esposito, S. and Fini, L., eds. (Dec. 2013).