Quasi-two-dimensional magnetism of Cu[C6H2(COO)4][C2H5NH3]2
Abstract
We report structural and magnetic properties of the spin- quantum antiferromagnet Cu[C6H2(COO)4][C2H5NH3]2 by means of single-crystal x-ray diffraction, magnetization, heat capacity, and electron spin resonance (ESR) measurements on polycrystalline samples, as well as band-structure calculations. The triclinic crystal structure of this compound features CuO4 plaquette units connected into a two-dimensional framework through anions of the pyromellitic acid [C6H2(COO)4]4-. The ethylamine cations [C2H5NH are located between the layers and act as spacers. Magnetic susceptibility and heat capacity measurements establish a quasi-two-dimensional, weakly anisotropic and non-frustrated spin- square lattice with the ratio of the couplings along the and directions, respectively. No clear signatures of the long-range magnetic order are seen in thermodynamic measurements down to 1.8 K. However, the gradual broadening of the ESR line suggests that magnetic ordering occurs at lower temperatures. Leading magnetic couplings are mediated by the organic anion of the pyromellitic acid and exhibit a non-trivial dependence on the Cu–Cu distance, with the stronger coupling between those Cu atoms that are further apart.
pacs:
75.30.Et, 75.50.Ee, 71.20.Ps, 61.66.FnI Introduction
Cu2+ compounds with organic cations and anions are in the focus of current research on quantum magnetism. Their advantages include facile crystal growth from the solutionYankova et al. (2012) and large Cu–Cu separations leading to relatively weak exchange couplings that are on the scale of feasible magnetic fields and reveal remarkable sensitivity to the applied pressure. Therefore, both magnetic field and external pressure can be used to change the physical regime of the system and tune it toward a new phase or a quantum critical point. Remarkable examples include the operational low-temperature magnetocaloric effect in the Cu-oxalate-based compound,Wolf et al. (2011) magnetic-field-induced ferroelectricity in sulfolane copper chloride Sul-Cu2Cl4,Schrettle et al. (2013) and pressure-induced incommensurate magnetism in piperazinium copper chloride PHCC.Thede et al. (2014)
Despite numerous experimental studies, microscopic aspects of Cu2+ magnets with organic components are relatively less developed.[Note; however; severalrecentstudies:][]jornet-somoza2010a; *jornet-somoza2010b; Vela et al. (2013) Many of these systems are easy to understand empirically, because organic molecules provide only a few linkages between the spin- Cu2+ ions, hence forming a clearly identifiable backbone of the low-dimensional magnetic unit.Goddard et al. (2008); Manson et al. (2011); Goddard et al. (2012) Nevertheless, detailed understanding of the underlying exchange mechanisms is vitally important for the deliberate preparation of new compounds. Moreover, as we show below, the trends in magnetic exchange through organic molecules are far from being trivial and extend our knowledge of superexchange interactions in general.
Here, we consider Cu(PM)(EA)2, where EA stands for the ethylamine [C2H5NH cation, and PM is the [C6H2(COO)4]4- anion of pyromellitic acid. This newly synthesized compound features layered crystal structure, with organic anions connecting Cu2+ ions into a two-dimensional (2D) square-lattice-like network. Two EA+ cations then balance the negative charge of the resulting anionic framework and reside between the layers. This type of structure is clearly reminiscent of quasi-2D magnets Cu(pz)2X2, where Cu2+ ions are linked through pyrazine molecules (pz) and form a cationic framework. Its charge is compensated by inorganic anions X, such as ClO, F-, etc.Goddard et al. (2008); Lancaster et al. (2007)
An interesting feature of Cu(pz)2X2 and related compounds is the weak frustrationTsyrulin et al. (2009); *tsyrulin2010; Siahatgar et al. (2011) of their square-lattice magnetic network by second-neighbor interactions yielding the well-known model of the frustrated square lattice (FSL) that enjoys close theoretical attention[][; andreferencestherein]fsl2004; *tsirlin2009 and possible connections to high-temperature superconductivity in doped Cu2+ oxides.Lee (2008) We thus expected that Cu(PM)(EA)2 might also show the FSL physics and reveal a stronger frustration than in Cu(pz)2X2. The latter compounds feature two nearest-neighbor couplings mediated by different pyrazine molecules, so that a direct superexchange pathway for is missing. In contrast, both first- and second-neighbor couplings in Cu(PM)(EA)2 should be mediated by the same organic molecule of the pyromellitic acid, hence an increase in is naturally expected.
Our experimental data and microscopic analysis confirm the quasi-2D nature of Cu(PM)(EA)2 with a weak spatial anisotropy of in-plane magnetic couplings and a very small interlayer coupling. We do not find any signatures of the frustration, though. Nevertheless, our data disclose a non-trivial mechanism of the remarkably long-range superexchange between the Cu2+ ions. This superexchange is mediated by the carbon atoms involved in the phenyl ring of the pyromellitic acid. Its implications for other quantum magnets are discussed.
II Methodology
For the preparation of single crystals of Cu(PM)(EA)2, an aqueous solution of Cu(CH3COO)H2O (5 mM, 1.0 g) was treated with 2 equivalents of ethylamine (0.9 ml, 10 mM, 70% solution in water) followed by the addition of pyromellitic (1,2,4,5-benzenetetracarboxylic) acid (5 mM, 1.27 g) solution in dimethylformamide. The initially formed greenish-blue precipitate was filtered out. The ensuing clear light-blue solution was kept at room temperature for slow evaporation. Blue needle-shaped crystals of the title compound were obtained after 8 days. They were repeatedly washed with water and finally with methanol. The sample dried in air was found to be phase-pure form of Cu(PM)(EA)2. Yield: 50% (based on Cu). Analysis (calculated for C14H18CuN2O8): C, 41.39; H, 4.43 ; N, 6.89. Found: C, 41.67; H, 4.42; N, 7.04%. Infra-red data (KBr pellet, in cm-1): 3154 br, 3092 br, 3056 s, 2934 br, 2911 br, 2871 s, 2809 s, 1630 s, 1589 m, 1497 m, 1429 m, 1360 s, 1316 m, 1196 w, 1140 w, 1040 m, 992 s, 820 m, 712 s, 690 s, 536 s, 494 s.
Single crystal x-ray diffraction (Bruker APEX-II machine with MoKα1 radiation of wave length Å) was performed on a high-quality single crystal of Cu(PM)(EA)2 at room temperature. The data were reduced using SAINTPLUS,sma and an empirical absorption correction was applied using the SADABS program.Sheldrick (1994) The crystal structure was solved by direct methods using SHELXS97 and refined using SHELXL97 from the WinGx suite of programs (Version 1.63.04a).Sheldrick (1997); *sheldrick1997b All the hydrogen atoms were placed geometrically and held in the riding mode for the final refinements. The final refinements included atomic positions for all the atoms, anisotropic thermal parameters for all the non-hydrogen atoms and isotropic thermal parameters for the hydrogen atoms. The crystal data and structure refinement parameters are shown in Table 1. Few single crystals were crushed into powder, and powder x-ray diffraction (PANalytical machine with CuKα radiation of wave length Å) was performed to confirm the purity of polycrystalline samples. Unfortunately, the size of individual single crystals of Cu(PM)(EA)2 was insufficient for thermodynamic measurements.
Magnetic susceptibility () was measured on the powder sample as a function of temperature (1.8 K 300 K) and at different applied magnetic fields () using a SQUID-VSM (Quantum Design). The magnetization isotherm ( vs. ) was measured at K in static fields up to 14 T with the VSM and in pulsed magnetic fields up to 30 T at the Dresden High Magnetic Field Laboratory (HLD). Heat capacity () was measured with Quantum Design PPMS as a function of and on three crystalline needles glued together on the heat capacity platform.
Electron spin resonance (ESR) measurements were carried out in a Bruker ELEXSYS E500-CW spectrometer working at X-band (9.4 GHz) frequencies equipped with a continuous-flow 4He cryostat Oxford Instruments ESR 900 and ESR 910 covering the temperature range K. Due to the lock-in amplification with field modulation, the ESR spectra record the field derivative of the microwave absorption dependent on the external static field. For this purpose the samples were fixed in Suprasil quartz-glass tubes with paraffin.
Individual exchange couplings in Cu(PM)(EA)2 were evaluated by density-functional (DFT) band-structure calculations in the FPLO code.Koepernik and Eschrig (1999) The Perdew-Burke-Ernzerhof (GGA) flavor of the exchange-correlation potentialPerdew et al. (1996) was supplied with the mean-field GGA+ correction for strong electronic correlations in the Cu shell using the on-site Coulomb repulsion eV and Hund’s exchange eV, as applied in previous studies.Janson et al. (2012); Nath et al. (2013) All calculations were performed for the experimental crystal structure with the positions of hydrogen atoms fully relaxed within GGA.[NotethattherelaxationwithinGGAissufficientforthispurpose; asshownin:][]lebernegg2013 Thermodynamic properties in zero field and in applied magnetic fields were calculated numerically using the loopTodo and Kato (2001) and dirloop_sseAlet et al. (2005) quantum Monte-Carlo (QMC) algorithms of the ALPS simulations package.Albuquerque et al. (2007)
III Results
III.1 Crystal Structure
| Empirical formula | C14H18CuN2O8 |
|---|---|
| Formula weight | 405.84 |
| Temperature | 293 K |
| Wave length () | 0.71073 Å |
| Crystal system | Triclinic |
| Space group | |
| Lattice parameters | Å |
| Å | |
| Å | |
| Volume () | 388.29(2) Å3 |
| 1 | |
| Calculated density () | 1.736 mg/mm3 |
| Absorption coefficient () | 1.455 mm-1 |
| F(000) | 209.0 |
| Crystal size | 0.2 0.15 0.1 mm3 |
| 2 range for data collection | 5.556∘ to 56.646∘ |
| Index ranges | , |
| , | |
| Reflections collected | 6870 |
| Independent reflections | 1919 [] |
| Data/restraints/parameters | 1919/0/117 |
| Goodness-of-fit on F2 | 1.278 |
| Final indexes [] | , |
| Final indexes [all data] | , |
| Largest diff. peak/hole | Å-3 |
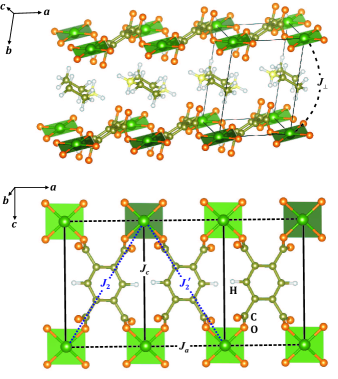
Crystals of Cu(PM)(EA)2 feature triclinic symmetry, space group . Their lattice parameters, atomic positions, and main interatomic distances and angles are given in Tables 1, 2, and 3, respectively. The Cu2+ ions are at the inversion center in the origin of the unit cell. They form nearly flat CuO4 plaquette units that are linked by the PM4- anions and build layers in the plane. The EA+ cations are located between these layers and connected to the anionic framework [Cu(PM)]2- through multiple hydrogen bonds.
A simple visual examination of the crystal structure suggests a pronounced spatial anisotropy. Given the large distance and the lack of direct connections between the CuO4 plaquettes along the crystallographic -direction, magnetic couplings along this direction should be very weak. The PM4- anion linking the Cu2+ ions may induce four different couplings in the plane: the nearest-neighbor exchanges (along ) and () and second-neighbor diagonal exchanges () and (), all running through the benzene ring of the PM molecule. The resulting model is a spatially anisotropic frustrated square lattice akin to those considered in Refs. Tsirlin and Rosner, 2009; Schmidt et al., 2010; *schmidt2011; Bishop et al., 2008; Majumdar, 2010. According to Cu-Cu distances in the experimental crystal structure (Table 4), we expect , but experimentally and microscopically, the order of couplings turns out to be different: , . In the following, we study the spin lattice of Cu(PM)(EA)2 and the origin of magnetic superexchange in this compound.
| Atoms | ||||
| Cu1 | 0 | 0 | 0 | 11.46(10) |
| O1 | 1999.0(19) | 786.7(16) | 1165.1(13) | 17.2(2) |
| O2 | 2850(2) | 2823.6(15) | 24.5(3) | |
| O3 | 6970(2) | 2913.1(17) | 1094.5(15) | 25.0(3) |
| O4 | 7557(2) | 27.5(17) | 1407.8(14) | 19.4(2) |
| N1 | 6718(3) | 6088(2) | 1595.4(19) | 26.1(3) |
| C1 | 2948(2) | 2502.5(18) | 14.5(3) | |
| C2 | 4096(2) | 3782.4(17) | 12.5(3) | |
| C3 | 5819(2) | 650.4(19) | 3456.3(17) | 12.4(3) |
| C4 | 6847(2) | 1292(2) | 1847.9(17) | 13.9(3) |
| C5 | 3301(2) | 5323.3(17) | 14.2(3) | |
| C6 | 10885(4) | 4449(3) | 2683(3) | 39.3(5) |
| C7 | 8579(3) | 5448(2) | 2985(2) | 27.7(4) |
| H1 | 7123 | 7091 | 521 | N1 |
| H2 | 5099 | 6686 | 1851 | N1 |
| H3 | 6556 | 4975 | 1396 | N1 |
| H4 | 1928 | 8278 | 5562 | C1 |
| H5 | 7922 | 4559 | 4108 | C4 |
| H6 | 8742 | 6683 | 3075 | C4 |
| H7 | 1519 | 5378 | 1568 | C5 |
| H8 | 704 | 3249 | 2537 | C5 |
| H9 | 2238 | 3960 | 3720 | C5 |
1
2
3
4
5
| Bond distances (Å) | |||
|---|---|---|---|
| Cu1-O1 | 1.9854(10) | C1-C2 | 1.5068(19) |
| Cu1-O11 | 1.9853(10) | C2-C3 | 1.3978(19) |
| Cu1-O42 | 1.9300(11) | C8-C7 | 1.510(3) |
| Cu1-O43 | 1.9300(11) | C3-C54 | 1.3937(19) |
| O1-C1 | 1.2777(19) | C3-C4 | 1.5061(19) |
| O2-C1 | 1.2414(19) | C4-O3 | 1.2350(19) |
| N1-C8 | 1.490(2) | C4-O4 | 1.2775(18) |
| C5-C2 | 1.3926(19) | O4-Cu15 | 1.9300(11) |
| C5-C34 | 1.3937(19) | ||
| Bond angles (degree) | |||
| O11-Cu1-O1 | 180.00(5) | C5-C2-C1 | 117.69(12) |
| O42-Cu1-O1 | 88.47(5) | C5-C2-C3 | 119.49(12) |
| O43-Cu1-O1 | 91.53(5) | C3-C2-C1 | 122.73(13) |
| O43-Cu1-O11 | 88.47(5) | N1-C8-C7 | 110.27(16) |
| O42-Cu1-O11 | 91.53(5) | C54-C3-C2 | 119.36(13) |
| O42-Cu1-O43 | 180.00(6) | C54-C3-C4 | 118.58(12) |
| C1-O1-Cu1 | 106.39(9) | C2-C3-C4 | 121.99(12) |
| C2-C5-C34 | 121.14(13) | O3-C4-C3 | 119.91(13) |
| O1-C1-C2 | 116.37(13) | O3-C4-O4 | 126.05(14) |
| O2-C1-O1 | 123.93(14) | O4-C4-C3 | 114.04(13) |
| O2-C1-C2 | 119.56(13) | C4-O4-Cu15 | 124.64(10) |
III.2 Microscopic magnetic model
To determine the magnetic model of Cu(PM)(EA)2, we evaluate individual exchange couplings. This procedure is two-fold. First, we analyze the band structure calculated within GGA. This band structure (Fig. 2, top) is gapless, at odds with the blue crystal color, because essential correlation effects in the Cu shell are missing in GGA. Nevertheless, the GGA band structure clearly identifies relevant magnetic states, which are Cu orbitals of symmetry contributing to the single band crossing the Fermi level, as shown in the bottom part of Fig. 2 (the and axes are directed to the corners of CuO4 plaquettes; they are different from the crystallographic directions and ). The tight-binding description of this band yields hopping integrals , which are introduced into a single-band Hubbard model and for the strongly localized case () at half-filling provide antiferromagnetic (AFM) part of the exchange couplings as , where eV is an effective on-site Coulomb repulsion on the Cu site.Janson et al. (2011); Tsirlin et al. (2013)
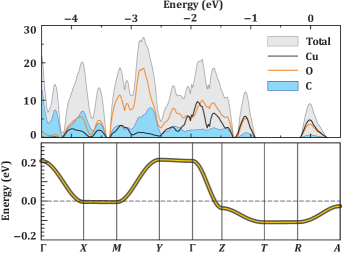
A qualitative inspection of the band in Fig. 2 reveals negligible dispersion along , hence the magnetic coupling along the direction is indeed very weak, in agreement with our crystallographic considerations in Sec. III.1. On the other hand, comparable dispersions along and imply only a weak spatial anisotropy in the plane. The evaluation of individual ’s yields similar values of and , whereas second-neighbor couplings and are very weak. The leading interlayer exchange is along , but it is three orders of magnitude lower than and .
| 5.86 | 37 | 14 | 7 | |
| 9.18 | 44 | 20 | 10 | |
| 10.88 | 7 | 0.5 | ||
| 10.90 | 10 | 1.0 | ||
| 8.36 | 0.01 |
Alternatively, we estimate individual ’s from total energies of collinear spin configurations calculated within GGA+. This approach verifies the results of our tight-binding analysis and provides ferromagnetic (FM) contributions to the superexhcnage, which were so far missing from the analysis. The GGA+ results confirm that , and both couplings are slightly below 10 K. Remarkably, systematically exceeds , even though it runs between those Cu2+ ions that are further apart.
Our microscopic analysis concludes that Cu(PM)(EA)2 features a rectangular lattice of Cu2+ ions in the plane. Both interlayer coupling and frustrating second-neighbor in-plane couplings are very weak. In the following, this microscopic scenario is confirmed experimentally.
III.3 Magnetization
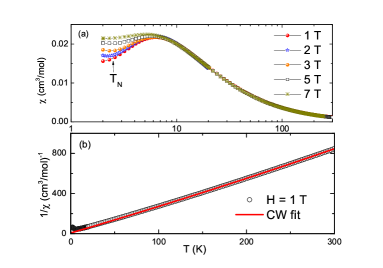
Magnetic susceptibility as a function of measured at different applied fields is shown in Fig. 3(a). With decreasing , at 1 T increases in a Curie-Weiss manner and then shows a broad maximum () at about 6 K indicative of the short-range magnetic order, which is a hallmark of low-dimensionality. At low temperatures, the susceptibility changes in a smooth manner without any signatures of a magnetic transition, in agreement with the heat-capacity and ESR data reported below.
To fit the bulk susceptibility data at high temperatures, we use the expression
| (1) |
where is the temperature-independent contribution and consists of diamagnetism of the core electron shells () and Van-Vleck paramagnetism () of the open shells of the Cu2+ ions present in the sample. The second term is the Curie-Weiss (CW) law with the Curie-Weiss temperature and Curie constant , where is Avogadro’s number, is the Boltzmann constant, is the Bohr magneton, and the effective moment is /f.u. and f.u. means formula unit.
Our fit in the temperature range between 210 K and 300 K [Fig. 3(b)] yields cm3/mol, cm3 K/mol, and K. Positive value of suggests that the dominant interactions are AFM in nature. The value yields an effective moment of 1.76 , slightly higher than the spin-only value of 1.73 (assuming ) and, thus, corresponding to the -factor above 2.0, which is typical for Cu2+ compoundsJanson et al. (2011); Nath et al. (2014) and agrees well with the ESR results reported below.
| (cm3/mol) | (K) | ||
|---|---|---|---|
| 2D | 2.05 | 6.8 | |
| 2.07 | 8.0 | ||
| 1D | 2.00 | 10.2 |
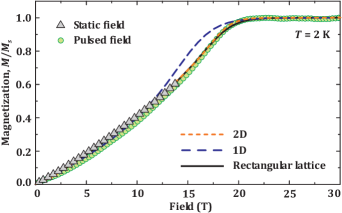
Magnetization as a function of field is nearly linear in low magnetic fields and reaches saturation at T (Fig. 5). A slight mismatch between the data measured in static and pulsed fields may be related to dynamic effects. Nevertheless, when scaled against the static-field data, the magnetization in pulsed fields saturates at /f.u. in excellent agreement with /f.u. expected for
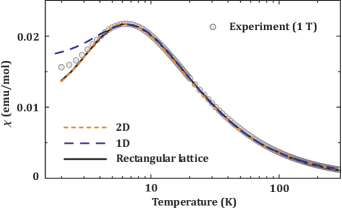
Taking into account the results of the microscopic analysis in Sec. III.2, we discard frustrated scenarios and focus on the rectangular spin lattice with . For the sake of completeness, we also consider the limiting cases of purely 1D ( or only) and purely 2D () spin lattices. First, we fit the susceptibility using obtained from QMC simulations and scaled with the -value, which is a fitting parameter together with the exchange coupling and the temperature-independent contribution . The values of these fitting parameters are listed in Table 5. All three models yield fits of comparable quality, although the purely 1D model fails to describe the data in the K temperature range, where both 2D models still work reasonably well. As we go from 2D toward 1D, the value systematically increases because the same overall coupling energy is distributed between only two bonds per site in 1D compared to four bonds per site in 2D. Note also that the -value of obtained in the fits with the 2D models is in good agreement with ESR (Sec. III.5).
The 1D and 2D spin models can be discriminated using high-field magnetization measurements and, in particular, the saturation field .Lebernegg et al. (2011) In Fig. 5, we show the experimental magnetization curve together with model curves simulated for the parameters from Table 5. The purely 1D model yields T, which is far below the experimental value. In contrast, the purely 2D model reproduces the experimental curve quite well: T. The model of the rectangular lattice is likewise matching the experimental data: T. Therefore, we conclude that Cu(PM)(EA)2 is clearly a quasi-2D magnet, but the presence of spatial anisotropy in the plane (the difference between and ) can’t be assessed from the magnetization data.
III.4 Heat Capacity
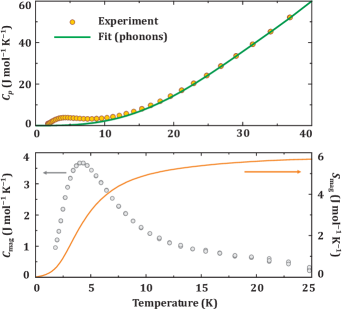
A further insight into the nature of Cu(PM)(EA)2 can be obtained from heat-capacity measurements. The heat capacity () in zero field is shown in the top panel of Fig. 6. While at high temperatures it is completely dominated by the contribution of phonon excitations, the magnetic contribution is clearly visible below 10 K. The maximum around K is characteristic of the short-range order similar to the broad maximum in . No kinks associated with the magnetic order are seen down to 1.8 K.
For a quantitative estimation of , the phonon part was subtracted from the total . The phonon part was estimated following the procedure used in Refs. Lancaster et al., 2007; Matsumoto et al., 2000. Above 15 K, the data were fitted by the following polynomial
| (2) |
where , , , and are arbitrary constants. 333The fitting results in J mol-1 K-4, J mol-1 K-6, J mol-1 K-8, and J mol-1 K-10. The fit was then extrapolated down to 1.8 K [Fig. 6, top] and subtracted from the experimental data.
The resulting is shown in the bottom panel of Fig. 6. Its broad maximum is at K. The subtraction procedure has been verified by calculating the magnetic entropy:
| (3) |
where the data below 1.8 K were extrapolated with a function.444The behavior is expected for a 3D antiferromagnet at low temperatures. In the purely 2D case, should be proportional to . Both extrapolations yield similar values of with less than 1 % difference. The estimated at K is 5.8 J mol-1 K-1 in excellent agreement with J mol-1 K-1 expected for . Above 20 K, is very small, and its contribution to the entropy is negligible, hence is nearly constant.
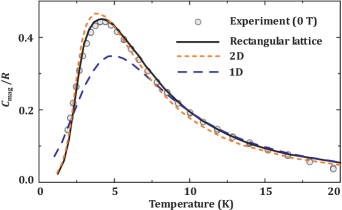
Now, we compare the experimental with simulation results for different spin models (Fig. 7). Similar to the magnetization data, the purely 1D model utterly fails to reproduce the experiment. The rectangular () and square () lattices are again quite similar, although both the exact position and the height of the specific heat maximum clearly favor the rectangular-lattice model. Therefore, we confirm experimentally the weak spatial anisotropy in the plane and also demonstrate the remarkable sensitivity of the magnetic specific heat to fine details of the spin lattice.
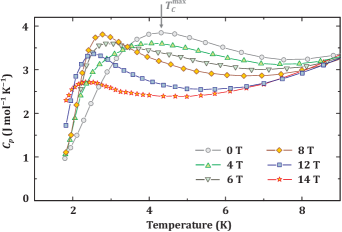
Our heat capacity data do not show any signatures of the long-range magnetic order or of any other transition down to 1.8 K. External field shifts the specific heat maximum toward lower temperatures indicating that a larger amount of magnetic entropy is released at low temperatures when external field is applied. This is typical for quasi-2D antiferromagnetsNath et al. (2008); Tsirlin et al. (2011) because external field suppresses antiferromagnetic spin correlations. The shape of the maximum remains rather symmetric and, thus, distinct from an asymmetric -type anomaly expected at a magnetic transition.
III.5 Electron spin resonance
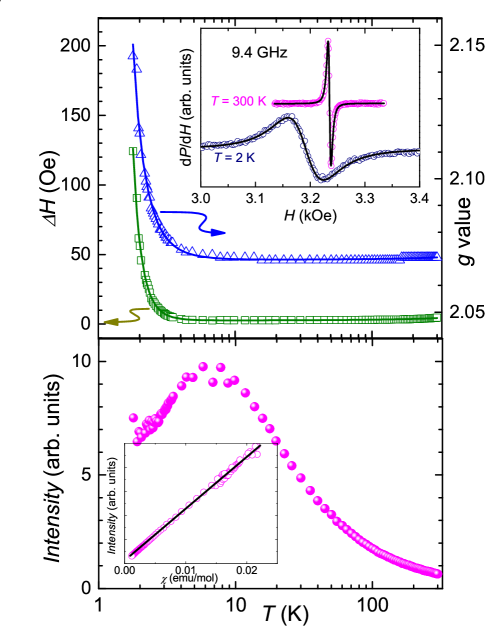
In order to get additional insight into the low-temperature behavior of Cu(PM)(EA)2, we performed ESR measurements. ESR measurements on polycrystalline samples revealed a distribution of values in the range indicating the influence of the square-planar ligand field onto the Cu2+ spins resulting in a characteristic tensor with difference principal values for the in-plane and out-of-plane directions, where the plane is built up by the ligands surrounding the Cu2+ ions.Abragam and Bleaney (1970) To investigate the temperature dependence in detail, we were able to orient a small twinned crystal in such a way that the signals of the two main domains merged into a single line. The corresponding direction of the external magnetic field was found to be close to the in-plane case.
The results obtained from this experiment are presented in Fig. 9. In the whole measured temperature range, the ESR spectra (inset of the upper panel of Fig. 9) consist of a single exchange-narrowed resonance line, which is well described in terms of a Lorentz profile. The line width is found to be increasing with decreasing temperatures. As one can see in the upper panel of Fig. 9, the value remains close to 2.07 above 10 K and then starts to diverge below 10 K. Similarly, the ESR line width also remains almost constant above 10 K and then diverges below 10 K. This low-temperature divergence behavior of and suggests that the compound is approaching magnetically long-range ordered state. In order to extract the parameters associated with the critical divergence, the data were fitted by the power law . Thus we obtained ( K, ) and ( K, ) from the -value and analysis, respectively. This means that the magnetic order is probably approached at temperatures below 0.9 K. The analysis of the critical behaviour requires measurements below 1.8 K and goes beyond the scope of the present study.
The temperature dependence of the ESR intensity is depicted in the lower panel of Fig. 9. Calibration of the intensity data using CaCu3Ti4O12 as reference,Pires et al. (2006) revealed that indeed all copper spins contribute to the ESR signal. The ESR intensity shows a pronounced broad maximum at around 6 K similar to the (T) data. In order to check how the ESR intensity scales with , we have plotted intensity vs. with temperature as an implicit parameter in the inset of the lower panel of Fig. 9. The straight line behavior in the whole temperature range suggests that the ESR intensity tracks the static susceptibility very well, and ESR probes the bulk behavior of the material.
IV Discussion and Summary
By combining experimental data with the microscopic analysis, we have shown that Cu(PM)(EA)2 is a non-frustrated quasi-2D antiferromagnet with the weak spatial anisotropy in the plane. From thermodynamic properties only, we can’t decide which of the couplings in the plane is stronger. However, the DFT results convincingly show that , even though the Cu–Cu distance for is nearly twice longer than that for (Table 4). This points to the non-trivial nature of the superexchange through the PM anions. To understand the origin of this superexchange process, we explore the nature of ligand orbitals that mix with the half-filled orbital of Cu2+ and, thus, mediate the superexchange.
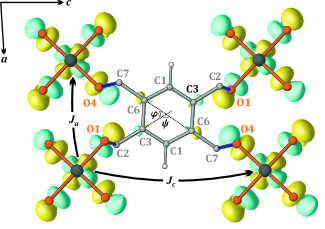
The Cu -based Wannier function (Fig. 10) features four leading contributions from the orbitals of oxygen atoms surrounding the Cu2+ ion (O1 and O4). These contributions are about 14 % each. Additionally, we find minuscule 2.5 % “tails” of the Wannier function on the C3 and C6 atoms belonging to the C6 phenyl ring. The difference between and can be now traced back to the positions of relevant orbitals on the carbon atoms. Their orientation is fixed by the C2–C3 (C7–C6) bonds, so that the effective bridging angles of the superexchange are and for and , respectively, and the superexchange is more favorable than that of according to Goodenough-Kanamori-Anderson rules. This explains why the order of magnetic couplings in Cu(PM)(EA)2 does not follow the order of Cu–Cu distances and a counter-intuitive microscopic scenario emerges.
Cu(PM)(EA)2 exhibits an interesting example of the superexchange through a very long Cu–OCCO–Cu pathway. This case is by far more involved than that of Cu(pz)2X2 magnets, where two Cu atoms are directly linked through the pyrazine molecule C4H4N2, with its nitrogen atoms being first neighbors of Cu2+ and, thus, featuring large contributions to the magnetic orbital.Vela et al. (2013) Then the tentative superexchange pathway is Cu–NN–Cu akin to the Cu–OO–Cu pathways that are abundant in Cu2+ phosphates and related compounds.Janson et al. (2011); Nath et al. (2014) The interactions of this type are quite sensitive to individual interatomic distancesVela et al. (2013) and require that the distance between the ligand atoms (NN or OO) stays below Å as to allow for the efficient overlap between the ligand orbitals.Tsirlin et al. (2013) The case of Cu(PM)(EA)2 is qualitatively different. The stronger coupling pertains to the longer CC distance, hence the spatial arrangement of interacting orbitals plays crucial role in this material.
Cu(PM)(EA)2 is a quasi-2D antiferromagnet. It features a non-negligible interlayer coupling that should trigger long-range magnetic order at low temperatures. Taking our tentative estimate of the interlayer coupling from Table 4, we arrive at and thus expect (Ref. Yasuda et al., 2005) or K. This temperature is on the verge of our experimental temperature range. Thermodynamic measurements show no evidence for the magnetic order down to 1.8 K. ESR data suggest that at low temperatures Cu(PM)(EA)2 is approaching the long-range-ordered state with the tentative Néel temperature of about 0.85 K obtained from an empirical fit. While an accurate estimate of the Néel temperature requires explicit measurements below 1.8 K and lies beyond the scope of the present study, even the fact that Cu(PM)(EA)2 does not order down to 1.8 K is already remarkable and makes this system comparable with the best available quasi-2D antiferromagnets, such as Cu(COO)H2O and Cu(pz)2X2, where is about 0.25.Rønnow et al. (2001); Lancaster et al. (2007)
Turning now to the in-plane physics, we note that its trends are somewhat counter-intuitive. Within the family of Cu2+ square-lattice antiferromagnets, the signatures of magnetic frustration by second-neighbor couplings have been so far observed in Cu(pz)2(ClO only.Tsyrulin et al. (2009); *tsyrulin2010 In this compound, two nearest-neighbor couplings are mediated by two different pyrazine molecules, hence an efficient superexchange pathway for is missing, because each pyrazine molecule connects nearest-neighbor Cu2+ ions only, and any obvious linkage between the second-neighbor Cu2+ ions is missing. Our Cu(PM)(EA)2 compound was supposed to remedy this problem by pinning both nearest-neighbor and second-neighbor couplings on the same PM anion. However, it turns out that the superexchange is not mediated by the benzene ring as a whole but by the orbitals of individual carbon atoms. The couplings and rely on the orbital overlap between those carbon atoms that are, respectively, first and second neighbors within the hexagonal benzene ring (Fig. 10). Diagonal couplings and will, in contrast, require the overlap between third neighbors, which is by far less efficient.
We speculate that the frustrating coupling can be enhanced by fine-tuning the organic anion. The straight-forward approach of removing two “idle” carbon atoms C1 seems to be not viable from chemistry viewpoint. However, five-member rings with a heteroatom, such as the furantetracarboxylic acid C4O(COOH)4, may be suitable molecular bridges for frustrated-square-lattice magnets with comparable first- and second-neighbor couplings. The realm of organic chemistry offers many other acids with cyclic carbon units and four carboxyl-groups (COOH) that are amenable to bond formation with the Cu2+ ion. Our work is a natural first step toward the preparation of such quantum magnets and understanding superexchange in these compounds.
In summary, we reported synthesis, crystal structure, magnetic properties, and microscopic magnetic model of a spin- magnet Cu(PM)(EA)2. Its quasi-two-dimensional magnetic unit features two leading exchange couplings, K and K forming a non-frustrated rectangular spin lattice. Superexchange couplings are mediated by carbon atoms of the phenyl ring and conform to the conventional Goodenough-Kanamori-Anderson rules, so that the stronger coupling is , even though the relevant Cu–Cu distance is nearly twice larger than that of .
Acknowledgements.
We thank B. R. Sekhar for extending his SQUID-VSM facility at the Institute of Physics, Bhubaneswar for the magnetic susceptibility measurements, as well as Tobias Förster and Helge Rosner for their kind help with the high-field magnetization measurements at HLD. RN would like to acknowledge Department of Science and Technology, India for financial support. AAT was supported by the EU under Mobilitas grant MTT77, and by the PUT733 grant of the Estonian Research Agency.References
- Yankova et al. (2012) T. Yankova, D. Hüvonen, S. Mühlbauer, D. Schmidiger, E. Wulf, S. Zhao, A. Zheludev, T. Hong, V. O. Garlea, R. Custelcean, and G. Ehlers, Phil. Mag. 92, 2629 (2012).
- Wolf et al. (2011) B. Wolf, Y. Tsui, D. Jaiswal-Nagar, U. Tutsch, A. Honecker, K. Remović-Langer, G. Hofmann, A. Prokofiev, W. Assmus, G. Donath, and M. Lang, Proc. Nat. Acad. Sci. 108, 6862 (2011).
- Schrettle et al. (2013) F. Schrettle, S. Krohns, P. Lunkenheimer, A. Loidl, E. Wulf, T. Yankova, and A. Zheludev, Phys. Rev. B 87, 121105(R) (2013).
- Thede et al. (2014) M. Thede, A. Mannig, M. M. ansson, D. Hüvonen, R. Khasanov, E. Morenzoni, and A. Zheludev, Phys. Rev. Lett. 112, 087204 (2014).
- Jornet-Somoza et al. (2010a) J. Jornet-Somoza, M. Deumal, C. P. Landee, M. M. Turnbull, and J. J. Novoa, Inorg. Chem. 49, 8017 (2010a).
- Jornet-Somoza et al. (2010b) J. Jornet-Somoza, M. Deumal, M. A. Robb, C. P. Landee, M. M. Turnbull, R. Feyerherm, and J. J. Novoa, Inorg. Chem. 49, 1750 (2010b).
- Vela et al. (2013) S. Vela, J. Jornet-Somoza, M. M. Turnbull, R. Feyerherm, J. J. Novoa, and M. Deumal, Inorg. Chem. 52, 12923 (2013).
- Goddard et al. (2008) P. A. Goddard, J. Singleton, P. Sengupta, R. D. McDonald, T. Lancaster, S. J. Blundell, F. L. Pratt, S. Cox, N. Harrison, J. L. Manson, H. I. Southerland, and J. A. Schlueter, New. J. Phys. 10, 083025 (2008).
- Manson et al. (2011) J. L. Manson, M. L. Warter, J. A. Schlueter, T. Lancaster, A. J. Steele, S. J. Blundell, F. L. Pratt, J. Singleton, R. D. McDonald, C. Lee, M.-H. Whangbo, and A. Plonczak, Angew. Chem. Int. Ed. 50, 1573 (2011).
- Goddard et al. (2012) P. A. Goddard, J. L. Manson, J. Singleton, I. Franke, T. Lancaster, A. J. Steele, S. J. Blundell, C. Baines, F. L. Pratt, R. D. McDonald, O. E. Ayala-Valenzuela, J. F. Corbey, H. I. Southerland, P. Sengupta, and J. A. Schlueter, Phys. Rev. Lett. 108, 077208 (2012).
- Lancaster et al. (2007) T. Lancaster, S. J. Blundell, M. L. Brooks, P. J. Baker, F. L. Pratt, J. L. Manson, M. M. Conner, F. Xiao, C. P. Landee, F. A. Chaves, S. Soriano, M. A. Novak, T. P. Papageorgiou, A. D. Bianchi, T. Herrmannsdörfer, J. Wosnitza, and J. A. Schlueter, Phys. Rev. B 75, 094421 (2007).
- Tsyrulin et al. (2009) N. Tsyrulin, T. Pardini, R. R. P. Singh, F. Xiao, P. Link, A. Schneidewind, A. Hiess, C. P. Landee, M. M. Turnbull, and M. Kenzelmann, Phys. Rev. Lett. 102, 197201 (2009).
- Tsyrulin et al. (2010) N. Tsyrulin, F. Xiao, A. Schneidewind, P. Link, H. M. Rønnow, J. Gavilano, C. P. Landee, M. M. Turnbull, and M. Kenzelmann, Phys. Rev. B 81, 134409 (2010).
- Siahatgar et al. (2011) M. Siahatgar, B. Schmidt, and P. Thalmeier, Phys. Rev. B 84, 064431 (2011).
- Misguich and Lhuillier (2004) G. Misguich and C. Lhuillier, in Frustrated spin systems, edited by H. T. Diep (World Scientific, Singapore, 2004) and references therein.
- Tsirlin and Rosner (2009) A. A. Tsirlin and H. Rosner, Phys. Rev. B 79, 214417 (2009).
- Lee (2008) P. A. Lee, Rep. Prog. Phys. 71, 012501 (2008).
- Momma and Izumi (2011) K. Momma and F. Izumi, J. Appl. Crystallogr. 44, 1272 (2011).
- (19) SMART (V 5.628), SAINT (V 6.45a), XPREP, SHELXTL; Bruker AXS Inc.: Madison, WI, 2004.
- Sheldrick (1994) G. M. Sheldrick, (1994), Siemens Area Correction Absorption Correction Program; University of Göttingen: Göttingen, Germany.
- Sheldrick (1997) G. M. Sheldrick, (1997), SHELXL-7 Program for Crystal structure solution and Refinement; University of Göttingen: Göttingen, Germany.
- Farrugia (1999) J. L. Farrugia, J. Appl. Cryst. 32 (1999).
- Koepernik and Eschrig (1999) K. Koepernik and H. Eschrig, Phys. Rev. B 59, 1743 (1999).
- Perdew et al. (1996) J. P. Perdew, K. Burke, and M. Ernzerhof, Phys. Rev. Lett. 77, 3865 (1996).
- Janson et al. (2012) O. Janson, I. Rousochatzakis, A. A. Tsirlin, J. Richter, Y. Skourski, and H. Rosner, Phys. Rev. B 85, 064404 (2012).
- Nath et al. (2013) R. Nath, A. A. Tsirlin, P. Khuntia, O. Janson, T. Förster, M. Padmanabhan, J. Li, Y. Skourski, M. Baenitz, H. Rosner, and I. Rousochatzakis, Phys. Rev. B 87, 214417 (2013).
- Lebernegg et al. (2013) S. Lebernegg, A. A. Tsirlin, O. Janson, and H. Rosner, Phys. Rev. B 88, 224406 (2013).
- Todo and Kato (2001) S. Todo and K. Kato, Phys. Rev. Lett. 87, 047203 (2001).
- Alet et al. (2005) F. Alet, S. Wessel, and M. Troyer, Phys. Rev. E 71, 036706 (2005), and references therein.
- Albuquerque et al. (2007) A. Albuquerque, F. Alet, P. Corboz, P. Dayal, A. Feiguin, S. Fuchs, L. Gamper, E. Gull, S. Gürtler, A. Honecker, R. Igarashi, M. Körner, A. Kozhevnikov, A. Läuchli, S. Manmana, M. Matsumoto, I. McCulloch, F. Michel, R. Noack, G. Pawłowski, L. Pollet, T. Pruschke, U. Schollwöck, S. Todo, S. Trebst, M. Troyer, P. Werner, and S. Wessel, J. Magn. Magn. Mater. 310, 1187 (2007).
- Schmidt et al. (2010) B. Schmidt, M. Siahatgar, and P. Thalmeier, Phys. Rev. B 81, 165101 (2010).
- Schmidt et al. (2011) B. Schmidt, M. Siahatgar, and P. Thalmeier, Phys. Rev. B 83, 075123 (2011).
- Bishop et al. (2008) R. F. Bishop, P. H. Y. Li, R. Darradi, and J. Richter, J. Phys.: Cond. Matter 20, 255251 (2008).
- Majumdar (2010) K. Majumdar, Phys. Rev. B 82, 144407 (2010).
- Janson et al. (2011) O. Janson, A. A. Tsirlin, J. Sichelschmidt, Y. Skourski, F. Weickert, and H. Rosner, Phys. Rev. B 83, 094435 (2011).
- Tsirlin et al. (2013) A. A. Tsirlin, O. Janson, S. Lebernegg, and H. Rosner, Phys. Rev. B 87, 064404 (2013).
- Nath et al. (2014) R. Nath, K. M. Ranjith, J. Sichelschmidt, M. Baenitz, Y. Skourski, F. Alet, I. Rousochatzakis, and A. A. Tsirlin, Phys. Rev. B 89, 014407 (2014).
- Lebernegg et al. (2011) S. Lebernegg, A. A. Tsirlin, O. Janson, R. Nath, J. Sichelschmidt, Y. Skourski, G. Amthauer, and H. Rosner, Phys. Rev. B 84, 174436 (2011).
- Matsumoto et al. (2000) T. Matsumoto, Y. Miyazaki, A. S. Albrecht, C. P. Landee, M. M. Turnbull, and M. Sorai, J. Phys. Chem. B 104, 9993 (2000).
- Note (1) The fitting results in \tmspace+.1667emJ\tmspace+.1667emmol-1\tmspace+.1667emK-4, \tmspace+.1667emJ\tmspace+.1667emmol-1\tmspace+.1667emK-6, \tmspace+.1667emJ\tmspace+.1667emmol-1\tmspace+.1667emK-8, and \tmspace+.1667emJ\tmspace+.1667emmol-1\tmspace+.1667emK-10.
- Note (2) The behavior is expected for a 3D antiferromagnet at low temperatures. In the purely 2D case, should be proportional to . Both extrapolations yield similar values of with less than 1\tmspace+.1667em% difference.
- Nath et al. (2008) R. Nath, A. A. Tsirlin, H. Rosner, and C. Geibel, Phys. Rev. B 78, 064422 (2008).
- Tsirlin et al. (2011) A. A. Tsirlin, R. Nath, A. M. Abakumov, Y. Furukawa, D. C. Johnston, M. Hemmida, H.-A. Krug von Nidda, A. Loidl, C. Geibel, and H. Rosner, Phys. Rev. B 84, 014429 (2011).
- Abragam and Bleaney (1970) A. Abragam and B. Bleaney, Electron Paramagnetic Resonance of Transition Ions (Clarendon Press, Oxford, 1970).
- Pires et al. (2006) M. A. Pires, C. Israel, W. Iwamoto, R. R. Urbano, O. Agüero, I. Torriani, C. Rettori, P. G. Pagliuso, L. Walmsley, Z. Le, J. L. Cohn, and S. B. Oseroff, Phys. Rev. B 73, 224404 (2006).
- Yasuda et al. (2005) C. Yasuda, S. Todo, K. Hukushima, F. Alet, M. Keller, M. Troyer, and H. Takayama, Phys. Rev. Lett. 94, 217201 (2005).
- Rønnow et al. (2001) H. M. Rønnow, D. F. McMorrow, R. Coldea, A. Harrison, I. D. Youngson, T. G. Perring, G. Aeppli, O. Syljuåsen, K. Lefmann, and C. Rischel, Phys. Rev. Lett. 87, 037202 (2001).