Low-coverage heteroepitaxial growth with interfacial mixing
Abstract
We investigate the influence of intermixing on heteroepitaxial growth dynamics, using a two-dimensional point island model, expected to be a good approximation in the early stages of epitaxy. In this model, which we explore both analytically and numerically, every deposited B atom diffuses on the surface with diffusion constant , and can exchange with any A atom of the substrate at constant rate. There is no exchange back, and emerging atoms diffuse on the surface with diffusion constant . When any two diffusing atoms meet, they nucleate a point island. The islands neither diffuse nor break, and grow by capturing other diffusing atoms. The model leads to an island density governed by the diffusion of one of the species at low temperature, and by the diffusion of the other at high temperature. We show that these limit behaviors, as well as intermediate ones, all belong to the same universality class, described by a scaling law. We also show that the island-size distribution is self-similarly described by a dynamic scaling law in the limits where only one diffusion constant is relevant to the dynamics, and that this law is affected when both and play a role.
pacs:
68.43.Jn-
Keywords:
Heteroepitaxy (Theory), Kinetic growth processes (Theory)
1 Introduction
Much of recent research on heteroepitaxial growth is focused to developing nanometer-scale devices with novel properties. Quality, performance and lifetime of these devices are determined by the purity, structural perfection and homogeneity of the epitaxial layers. Surface flatness and interface abruptness obtained through epitaxial crystal growth depend on the relative values of the interfacial energy and the surface free energy of the substrate and the film, under equilibrium conditions. However, in most cases thin films are grown far away from thermodynamic equilibrium, leading to kinetically controlled processes. Surface structures, thus depend in a very complicated way on several variables, which in simplest models include the deposition flux, the mobility the deposited particles, nucleation and detachment rates, and the interfacial energy between substrate and epitaxial film [1, 2]. Besides these processes, an additional mechanism, shown to be important in many cases of heteroepitaxial growths, is that of exchange, in which a deposited atom becomes embedded into the substrate and a substrate atom is removed. Exchange leads to growth of islands of mixed composition. Intermixing is specially undesired in case of magnetic materials, as it produces a decrease in the interface magnetization with respect to expected. It has been reported that V [3], Fe [4], Co [5], Ni [6], Cr [7], Ir [8] intermix with Cu atoms at their interfaces forming alloy layers, and for instance, the average magnetic moment of 4 mono-layer Ni film on Cu(001) is half of that in the bulk Ni, as detected by X-ray magnetic circular dichroism measurements [9].
It is not at all surprising that exchange occurs for two elements that are completely miscible like, for instance, Au and Ag [10]. Deposition of Au on Ag(110) forms alloy-like structures that are not energetically costly and the comparatively open atomic geometry of an fcc(110) surface makes place exchange possible with fairly small bond distortions. However, intermixing of the constituents may also well occur for bulk immiscible systems. The phase diagram of the Ir-Cu system shows a massive miscibility gap. At temperatures up to around 1000 K only 3 at. % Ir appears soluble in Cu and in the reverse case only 1 at. % Cu in Ir [11]. No intermixing would be expected for these elements, at least at low temperatures. As the surface free energy of Ir is considerably higher than of Cu (3 and 1.83 , respectively [12]), when Ir is deposited on Cu one should observe 3D growing clusters composed only of Ir atoms. However, experimental results for Ir on Cu(100) unequivocally show intermixing, even at room temperature [8]. Thus, structures resulting from heteroepitaxy are often complex and difficult to predict from bulk material parameters.
A common fact of heteroepitaxial systems with intermixing is that the surface free energy of the deposited atoms is higher than the substrate one [13, 14, 15, 16, 17, 18]. At high enough coverage, this results in step roughening; which might then be considered as an indicator of intermixing. However, well before 3D islands arise on the substrate, the question remains about what are the effects of intermixing at the early stages of heteroepitaxy. The case where deposited monomers can react with the substrate was studied in [19, 20]. After an irrevesible exchange, these atoms become immobile and act as centers of nucleation, which form inclusions in the substrate. The emerging atoms become mobile but are assumed to adhere to a step elsewhere, and play no role in the dynamics. The effects of intermixing on the structures formed on the substrate where analyzed in [21]. In this work, islands nucleate by the encounter of any pair of diffusing atoms, and the authors studied the properties of the concentration and the spatial correlation of substrate atoms which become part of the islands. However, in order to keep the analysis simple, they assume that both species diffuse equally fast on the surface.
In this paper, we address the problem of growth dynamics with intermixing according to a model of point islands ( which occupy a single site[22, 23]), expected to be a valid approximation at low enough coverages. The exchange rate is entered as a parameter, and both constants of diffusion are taken into account Our approach is two-fold: theoretical analysis and numerical Monte Carlo (MC) simulations.
The paper is organized as follows. In section 2 we define the model. We consider two species of atoms, and the dynamics depend on the intermixing and deposition rates as well as on the diffusion constants of both species. The main results are presented in section 3. In 3.1, we analyze the behavior of the density of islands. The composition of interface at low coverage is studied in 3.2, and the results of simulations are compared with experiments. In 3.3, we state and solve mean-field evolution equations for island an monomer densities. These equations lead to a scaling form for the island density, described in 3.4. A reduced form of the dynamic scaling of the island-size distribution is presented in 3.5. Finally, in section 4, we state our conclusions.
2 The model
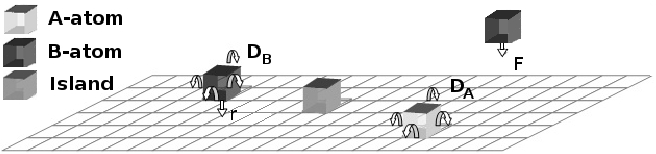
A substrate, which consists of A atoms, is represented by a square lattice of sites, with periodic boundary conditions to avoid edge effects. On this lattice, we deposit B atoms, which perform random walks and undergo place exchange with substrate atoms by a phenomenological constant rate . When any two diffusing atoms meet, they form a point island. Theses islands do not diffuse nor break, and grow irreversibly by aggregation of other atoms. Every island occupies only one lattice site, in spite of the number of atoms that compose it. Detachment and evaporation are not considered. Structures result of mixed composition because two kind of atoms are involved. During time evolution, we take into account the following processes (shown schematically in figure 1):
(a) Deposition: starting from an initially flat substrate consisting of A atoms, each empty site of the lattice is occupied by an B atom with probability per unit time . Every simulation runs until the number of atoms deposited per site reaches a desired value .
(b) Intermixing: when a diffusing B atom (not bounded to an island) lays on a A atom of the substrate, the former exchanges with the latter with rate . After an exchange, the B atom remains irreversibly incorporated to the substrate (no exchange back) and the A atom starts diffusing.
(c) Diffusion: any unbounded A (B) atom on the surface diffuses with diffusion constant (), by hopping among nearest-neighbors lattice sites.
(d) Nucleation: when any two diffusing atoms (either A or B) meet, they form a stable non-moving island. Each island acts as a nucleation center and occupies only one site on the lattice.
(d) Aggregation: when an diffusing atom, regardless of its type, hops to a site occupied by an island, the former aggregates to the latter, which increases its number of particles by one. Detachment events are not allowed, i. e. islands grow irreversibly.
We are interested in island formation at low enough densities, at which the lattice mismatch and most of the interactions among diffusing atoms can be neglected. We expect that, in early stages of growth, this point island model is useful to describe different properties of the system, such as island density and interface composition. We perform simulations with always below mono layer (ML).
According to the above described processes, the model dynamics depend on four parameters: the deposition flux , exchange rate , and the diffusion constants and . However, at a given coverage (or time ), the surface structure is determined by only three non-dimensional numbers, which are the ratios , and , where is the lattice constant (in the following we set ). In this work, we will show results for , though it is easy to extend them to other values of . Note that this model reduces to the standard point islands one, when all atoms diffuse with the same constant, i., e., for [22]. In the following, we study the density and composition of the islands as a function of , for different values of the non-dimensional intermixing and diffusion ratios and , respectively .
3 Results
3.1 Island density
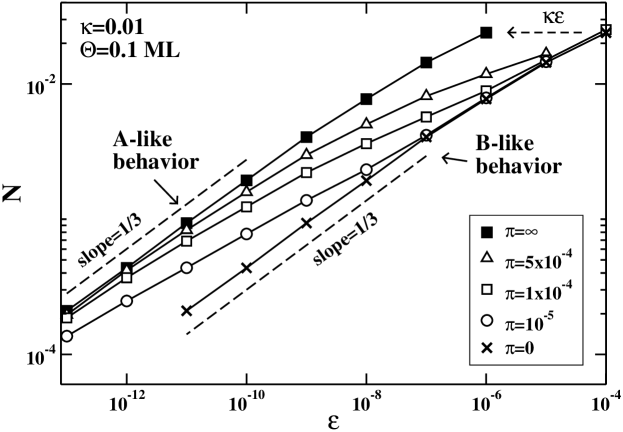
In this part, we analyze the island density as a function of model parameters. Surface composition will be addressed in section 3.2. At a given temperature , which determines the diffusion constants of atoms, the number of islands depends on , a measure of the relationship between deposition and diffusion of B atoms. As increases each diffusing atom performs a lower number of hops in the mean time between incoming particles. This leads to a higher density of monomers, and to a greater nucleation probability. Thus, the island density increases with . It is known that, at a fixed coverage, the average number of island per lattice site behaves as , for small enough. The exponent depends on the effective dimensionality of diffusion. For the two-dimensional case, [22, 23, 24, 25]. Examples of the behavior the island density, obtained numerically, as a function of the non-dimensional incoming flux are shown in figure 2 for , ML, and , and . The two-dimensional exponent is in agreement with these results for small enough.
To go beyond the slow deposition regime, in what follows we discuss the dependence of on , for intermediate values of . A simple situation corresponds to , when no intermixing takes place and the model reduces to the standard point islands model. Note that, with respect to island density, this condition is equivalent to (and any ), which means that all particles diffuse in the same manner, with diffusion constant (B-like behavior). Other simple situation occurs when . In this case, each entering B atom exchanges instantaneously with the first A atom it lays on. Thus, diffusing atoms all come from the substrate, and island dynamics are governed by the diffusion constant (A-like behavior). These limit behaviors are summarized in Table 1. Let us remark that the function for can be obtained from that for by rescaling . We return to this point in section 3.3.
-
Dynamics governed by any any large enough any any small enough any any
It is interesting to note that the A-like and B-like regimes can also be observed for other values of , by tuning the parameter . For instance, as increases, both the nucleation and aggregation mean times ( and , respectively) decrease. For large enough , they become much shorter than the intermixing mean time , and island dynamics are governed by diffusing B atoms, which have a little exchange probability. In contrast, for low enough , and are much longer than and most of the moving atoms are of kind A. The presence of atoms from the substrate forming part of islands has been observed in experiments carried out at high temperatures, which corresponds to the second situation. For instance, the growth of Nb on Fe(110) and Fe on Nb(110) form surface alloy at temperatures above K and a sufficient epitaxial quality of layer by layer can be obtained without intermixing of Nb and Fe, at room temperature [26], the growth of Au on Fe(001) exhibits alloy at temperatures higher than K [27]. Estimations of the characteristic times and are given in section 3.4, where a scaling form of island density is obtained using mean-field approximations.
3.2 Surface composition
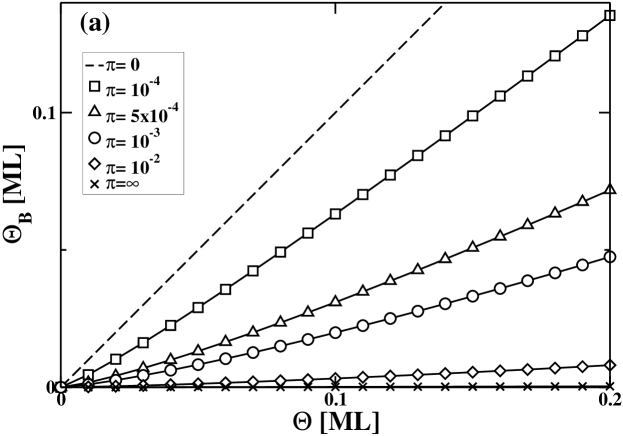
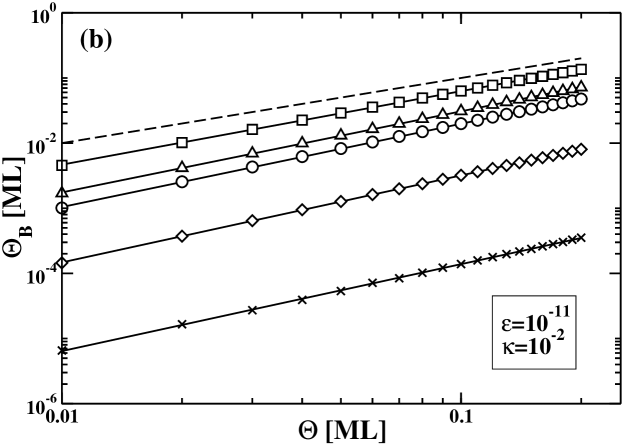
The amount of B atoms incorporated to islands per site should decrease with the increasing of the intermixing rate. This is clearly observed in figure 3(a), where we show the behavior of as a function of for , , and and . Every set of data points fits with a curve concave upward, i., e., its derivative is monotonically increasing, which originates in the fact that, as the island density is a growing function of , the larger the coverage, the higher the aggregation probability for diffusing B atoms before they intermix with A atoms. Note that, at a given coverage, the concavity increases with , due to the increasing of the intermixing/aggregation ratio. In figure 3(b) we show the same plots in log-log scale, and the measured effective exponents (greater than 1) for the each value of .
The upward concavity of as a function of , has been observed in experiments at low coverages. This is, for example, the case of epitaxial growth of Ir on Cu and Cr on Fe [8, 28]. For Ir (Cr) atoms, it seems energetically more favorable to be embedded via place exchange in the Cu (Fe) substrate rather than staying atop, which redounds in intermixing. Experimental data of the amount of Ir (Cr) atoms that stays on the surface as a function of coverage (extracted from [8, 28]) are shown in figure 4(a). At low enough coverage, the experimental data fit to curves conclaves upward. Thus, effective exponents greater than one are measured for versus , at low coverage (see figure 4(b)). Similar behaviors were observed for Fe on GaAs [29] and Cu on Ir [30].
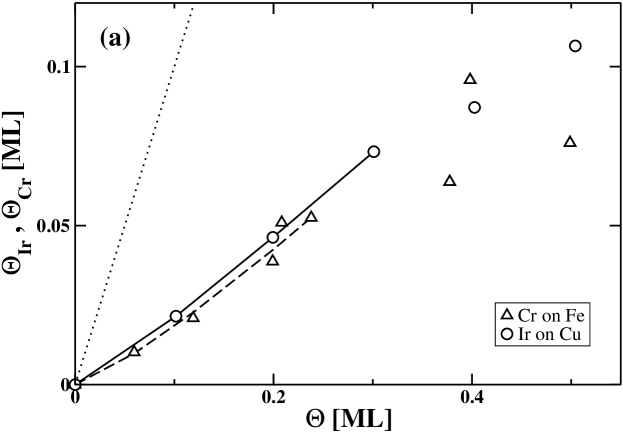
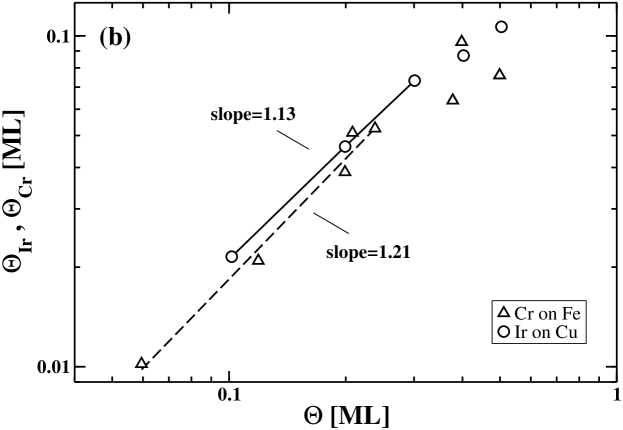
The change of concavity detected in experiments at intermediate values of ( in figure 4) can be explained by the onset of 3D island growth or by an intermixing rate growing with [30, 31, 32]. According to the model studied in this work, this effect cannot be attributed to intermixing, if its rate does not depend on the coverage; even for large values of . As discussed above, and shown in figure 3(b) ( with for ), the derivative of always increases with . In the way to minimize the free energy, the atomic structures can reduce their surface by assembling 3D islands, and the deposited B atoms can intermix with substrate A atoms. At low enough coverages, the latter is the most relevant process. As coverage increases, the configuration that minimizes the surface free energy most likely involves 3D islands. The crossover between both behaviors will depend on the particular reactants. Although interesting, the study of this crossover is beyond the scope of our model.
3.3 Mean-field evolution
From the rules described in section 2, the rate evolution equations for the total monomer and island densities, at low enough coverages, and using mean-field arguments are
| (1) | |||||
| (2) |
where () is the A (B) monomer density and () governs the A (B) monomer attachment rate (it is known that and , for point islands [25]).
The first term in the right-hand side of (1) corresponds to the increase of monomers due to the deposition of B atoms. The second and the last, to its decrease, due to nucleation and aggregation to islands, respectively. Note that the parameter does not appear in (1). This equation refers to total monomer density variation, which is no affected by the intermixing. In the right-hand side of (2), both terms stand for nucleation. The first, that which occurs when a B atom is deposited on a diffusing monomer, the second corresponds to nucleation by diffusion. As islands cannot break, they always increase in number with time.
We can rewrite the rate equations in terms of the coverage (rather than time ) as
| (3) | |||||
| (4) |
For small enough , a quasi-stationary regime exists, in which , and . In addition, in this regime , provided that . Thus, by retaining only the leading terms in (3) and (4), we get and , which lead to
| (5) |
This expression holds, for and , at small enough , as confirmed by the results of simulations in figure 2.
Regarding the quantity as a function of , it is easy to obtain the exponents related to its power-law behavior in the limits and . In the first case, for small enough, B atoms stay atop only if they are deposited directly on islands, and then , which, using (5), gives
| (6) |
In contrast, when , all diffusing atoms are B and . These limit behaviors are confirmed by simulations, as shown in figure 3. We can observe in the same figure (part (b)) that, for intermediate values of , and in the range , ; with an effective exponent that decreases from to , when moves from to .
3.4 Scaling of the island density
As discussed in section 3.1, for low coverage, and fixed ( or ) and (), island dynamics are governed by the diffusion of A (B) atoms for small (large) enough (see Table I). The extensions of the A-like and B-like regimes in the parameter space depends on the involved characteristic times and . The nucleation time of an island composed of a pair of B atoms can be estimated by considering that, in an average time , a B atom is deposited in one of the mean number of distinct sites visited by a diffusing B atom , i., e., . As, for two-dimensional diffusion, [33], we arrive to the expression
| (7) |
To estimate the aggregation time of a diffusing B atom, we assume that the mean number of distinct sites visited by a B atom in this time is proportional to the average number of empty sites per island, i., e., . Then, taking into account (5), and the above mentioned behavior of , the estimates results
| (8) |
Note that , for small enough.
When both and are much longer than the intermixing time, i., e., , most of the deposited B atoms intermix with the substrate, and the diffusing atoms are predominantly A. According to (7), the A-like behavior occurs for , where
| (9) |
In contrast, most of diffusing atoms are B when . Thus, from (7), the B-like regime occurs when , where
| (10) |
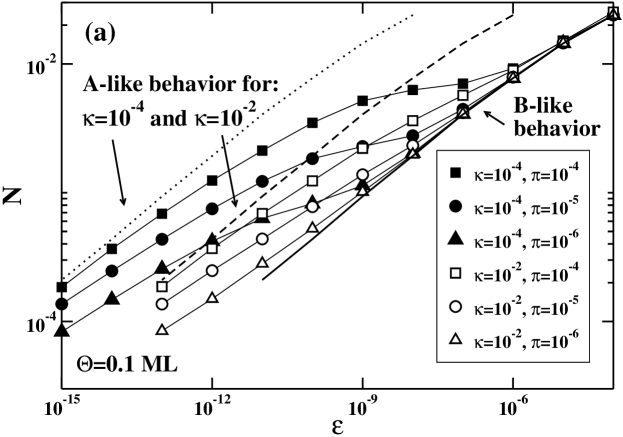
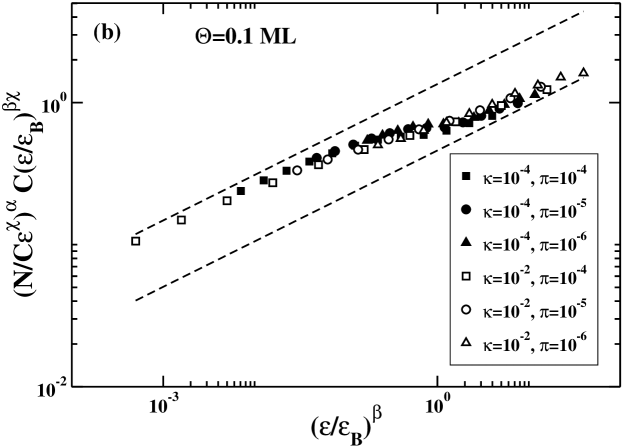
The crossover scales given by (9) and (10) allow to collapse the curves corresponding to as a function of , for different values of and , provided that is small enough. In figure 5(a) we have plotted this function using the results of numerical simulations for ML, and , and and . Note that the behavior of (for fixed , and ) can be expressed as . In this equation, stands for the B-like behavior, while the function takes a constant value for , and for ; decreasing monotonically between and . Since two different crossover exist, at a given the data collapse is achieved in two steps. First, every curve corresponding to in figure 5(a) is rigidly translated to move the second crossover point to the origin, by plotting as a function of . Then, the axis is rescaled by and the axis by . A last transformation (a backwards rotation ) is included in order to recover the overall behavior of . The finally resulting plot, for the data in figure 5(a), is shown in the part (b) of the same figure. The very good collapse on a single curve is apparent, and gives support to the idea of universality, according to which, at low coverages, the island density satisfies
| (11) |
where is a universal scaling function.
3.5 Dynamic scaling of the island-size distribution
An important quantity in the description of island growth, is the size distribution function , which gives the number per site of islands of size (composed of atoms), at a coverage . It is well established [22, 34, 35, 36, 37] that, in the case of the standard irreversible aggregation model, where all particles diffuse with same constant of diffusion , for low enough values of the ratio , the low-coverage dynamics are self-similar and the island size distribution is described by
| (12) |
where the form of the scaling function is universal, in the sense that it does not depend upon the details of the model, such as the lattice type and the coordination number, but rather depends on more global variables.
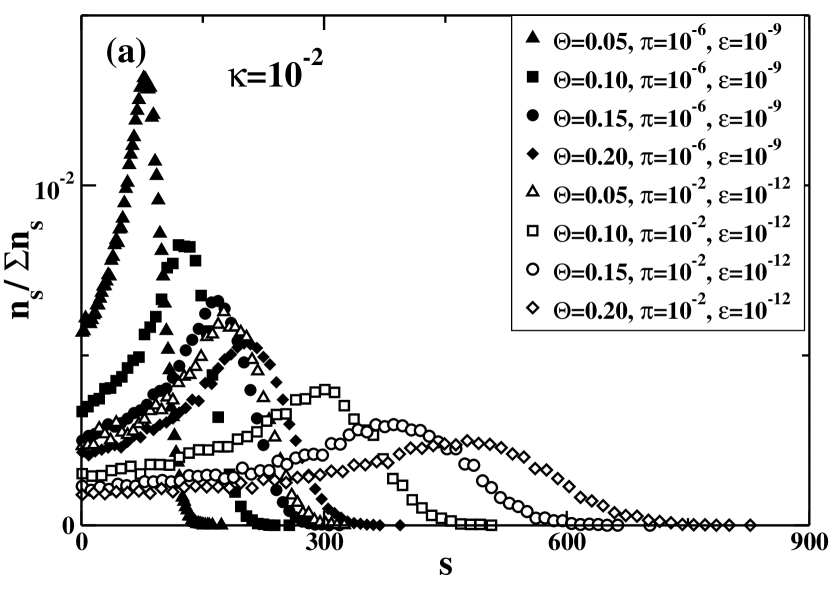
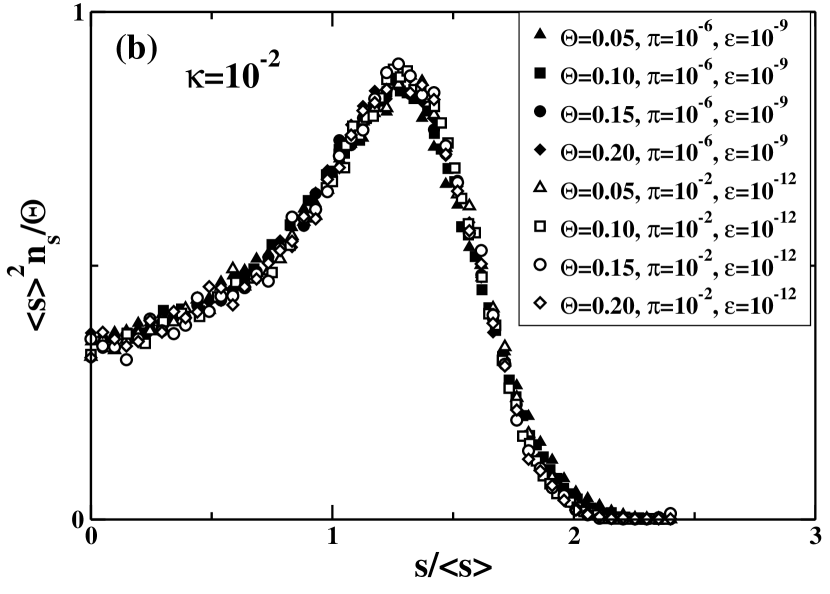
As our model becomes the standard irreversible aggregation model when or , the island size distribution should satisfy the scaling hypothesis (12) in these asymptotic regimes. To check this, we have performed Monte Carlo simulations, for the B-like case, with , , and , which leads to . For the A-like case, we have chosen , , and , which results in . In figure 6(a), we have plotted with solid symbols the numerical island size distributions which correspond to the first group, and with open symbols those which correspond to second; at the coverages indicated in the figure key. The plots of , as a function of , for the same data, are shown in figure 6(b). The good collapse of the data points on a single curve is apparent, and gives support to the scaling law (12) when only one diffusion constant is relevant to the dynamics.
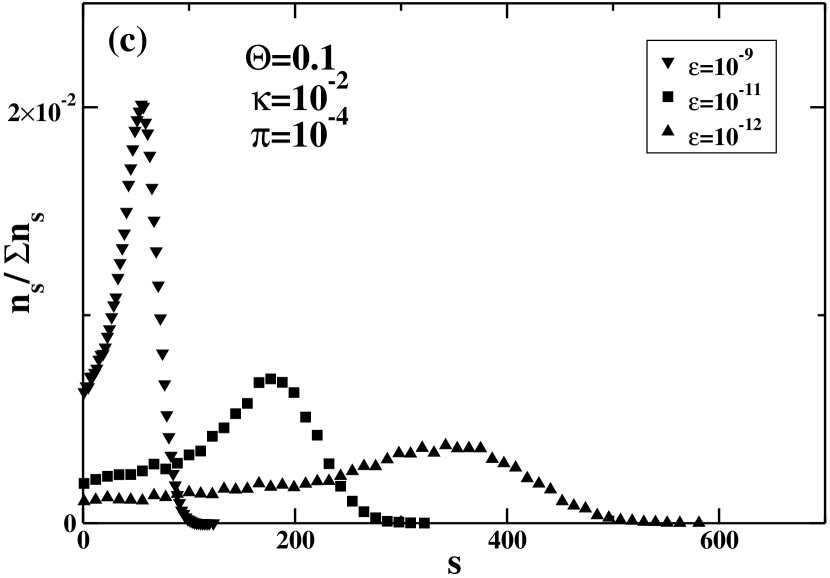
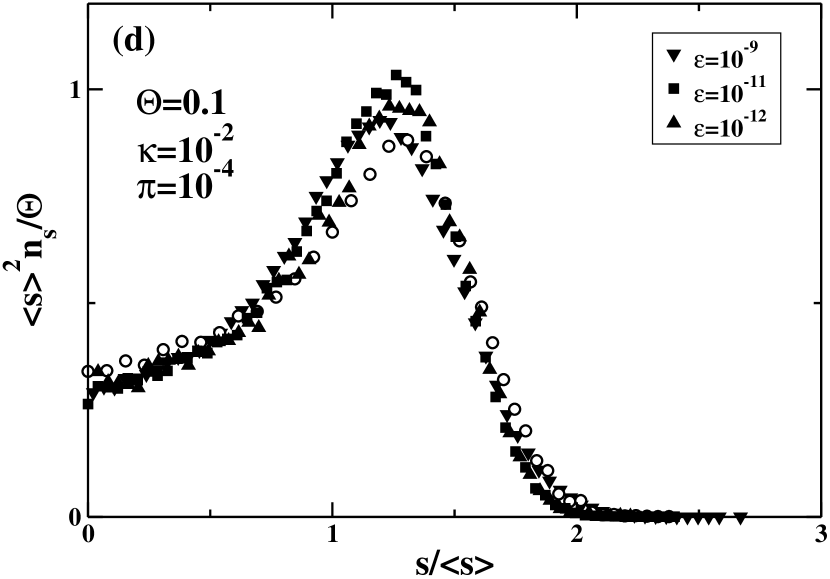
For intermediate values of , it is expected that the presence of a new rate, introduced with a second constant of diffusion, invalidates the scaling form (12); in analogy to the case of detachment, when is affected because of the rate related to this process [38]. In figure 6(c) we shown three numerical island size distributions for between and , for which . The corresponding scaled functions are plotted in figure 6(d); we have also included the scaling function from panel (b), for comparison. Clear differences among all these functions are easily observed, which indicates that the scaling behavior of the island size distribution is indeed affected by the presence of two species of atoms moving on the substrate according to different diffusion constants.
4 Conclusions
Despite the complexity and variety in reached morphologies of heteroepitaxial growths with intermixing, certain aspects of island growth appear to be common to many different systems. In the interest of archiving a complete and predictive model for the earliest stages of thin-film morphology that exhibit exchange between deposited and substrate atoms, it is clearly desirable to have an approach that is as free as possible from arbitrary parameters or assumptions. In this work, with an aim toward this ideal approach, we have presented a simple model to study the influence of intermixing and the different diffusion constants of the species moving on the surface, in island formation at low coverage. The model, only controlled by three parameters: the ratio between diffusion constants of the species, the non-dimensional incoming flux of particles and the non-dimensional intermixed probability of these particles with of substrate, can explain the behavior of density island and the variation of surface composition with time, for different values of these parameters. We found that the island dynamics are governed by the diffusion of the deposited atoms, at low temperature and by the diffusion of emerging particles from the substrate at high temperature regardless their diffusion constants.
We show that intermixing phenomenon is the predominant mechanism that can explain the island composition profile at low coverage. Then, other mechanisms interfere in this kind of thin film growths at higher coverage, such as the interactions between diffusing atoms. Our model allows to study the effect of intermixing separated of the interactions between atoms tending to form 3D islands when the exposed surface of islands increases [13, 14, 15, 16, 17, 18].
Mean-field evolution equations for island and monomer density have been written and resolved in simple situations, such as strong intermixing and high working temperatures and/or low deposition rates of atoms on the substrate. We found through these equations, a collapse of the island density for different values of the parameters of the model.
Finally, we study the island-size distribution. The scaling behavior of this quantity is observed to be the same that for the standard irreversible aggregation model, in the asymptotic regimes where or . In contrast, this scaling law fails at intermediate values of , because of the two species of atoms moving with different diffusion constants.
References
References
- [1] T. Michely and J. Krug. Islands, Mounds and Atoms Patterns and Processes in Crystal Growth Far from Equilibrium. Springer, 2004
- [2] J. W. Evans, P. A. Thiel, M. C. Bartelt. Surf. Sci. Rep., 61:1 (2006).
- [3] B.-S. Kang, S.-K. Oh, J.-S. Chung, and K.-S. Sohn. Physica B, 304:67, 2001.
- [4] J. H. Kim, K. H. Lee, G. Yang, A. R. Koymen, and A. H. Weiss. Appl. Surf. Sci., 173:203, 2001.
- [5] F. Nouvertné, U. May, M. Bamming, A. Rampe, U. Korte, G. Guntherodt, and Scheffler M. Pentcheva, R. Phys. Rev. B, 60:14382, 1999.
- [6] B.-S. Kang, J.-S. Chung, S.-K. Oh, H.-J. Kang, and J. Magn. Mater, 241:415, 2002.
- [7] B.-S. Kang and S.-K. Oh. Physica B, 349:260, 2004.
- [8] G. Gilarowski and H. Niehus. Surf. Sci., 436:107, 1999.
- [9] P. Srivastava, F. Wilhelm, A. Ney, M. Farle, H. Wende, N. Haack, G. Ceballos, and K. Baberschke. Phys. Rev. B, 58(9):5701, 1998.
- [10] D. D. Chambliss, R. J. Wilson, and S. Chiang. IBM J.Res. Develop., 39(6):639, 1995.
- [11] T. B. Massalski, editor. Binary Alloy Phase Diagrams. ASM International, Ohio, 1990.
- [12] H. L. Skriver and N. M. Roseengard. Phys. Rev. B, 46:7157, 1992.
- [13] J. de la Figuera, J. E. Prieto, and R. Miranda. Surf. Sci., 307-309:538, 1994.
- [14] A. Rabe, N. Memmel, A. Steltenpohl, and Th. Fauster. Phys. Rev. Lett., 73:2728, 1994.
- [15] A. Brodde and H. Neddermeyer. Surf. Sci., 287-288:988, 1993.
- [16] Th. Detzel, N. Memmel, and Th. Fauster. Surf. Sci., 293:227, 1993.
- [17] S. L. Chang, J. M. Wen, P. A. Thiel, S. Gunther, J. A. Meyer, and R. J. Behm. Phys. Rev. B, 53:13747, 1996.
- [18] P. J. Schmitz, W. Y. Leung, G. W. Graham, and P. A. Thiel. Phys. Rev. B, 40:11477, 1989.
- [19] D. D. Chambliss, K. E. Johnson. Phys. Rev. B, 50:5012 (1994).
- [20] A. Zangwill, E. Kaxiras. Surf. Sci, 326:L483 (1995).
- [21] B. Bierwald, M. von den Driesch, Z. Farkas, S. B. Lee, D. E. Wolf. Phys. Rev. E, 70:021604 (2004).
- [22] M. C. Bartelt and J. W. Evans. Phys. Rev. B, 46:12675, 1992.
- [23] M. C. Bartelt and J. W. Evans. Europhys. Lett., 21:99, 1993.
- [24] J. G. Amar, F. Family, and P.-M. Lam. Phys. Rev. B, 50:8781, 1994.
- [25] F. Family and J. G. Amar. Mater. Sci. Eng., B 30:149, 1995.
- [26] C. Wolf and U. Khler. Mater. Sci. Eng., 500:347, 2006.
- [27] M. M. J. Bischoff, T. Yamada, A. J. Quinn, R. G. P. van der Kraan, and H. van Kempen. Phys. Rev. Lett., 87(24):246102, 2001.
- [28] A. Davies, J. A. Stroscio, D. T. Pierce, and R. J. Celotta. Phys. Rev. Lett., 76(22):4175, 1996.
- [29] A. Ionescu, M. Tselepi, D. M. Gillingham, G. Wastbauer, S. J. Steinmiller, H. E. Beere, D. A. Ritchie, and J. A. C. Bland. Phys. Rev. B., 72:125404, 2005.
- [30] G. Gilarowski, J. Méndez, and H. Niehus. Surf. Sci., 448:290, 2000.
- [31] R. Pfandzelter, T. Igel, and H. Winter. Phys. Rev. B, 54(7):4496, 1996.
- [32] R. Pfandzelter, T. Igel, and H. Winter. Surf. Sci., 377-379:963, 1997.
- [33] H. Larralde, P. Trunfio, S. Havlin, H. E. Stanley, and G. H. Weiss. Phys. Rev. A, 45(10):7128, 1992.
- [34] T. Vicsek and F. Family. Phys. Rev. Lett., 52(19):1669, 1984.
- [35] J. G. Amar, F. Family, and P. M. Lam. Phys. Rev. B, 50(12):8781, 1994.
- [36] F. Family and P. Meakin. Phys. Rev. Lett., 61(4):428, 1988.
- [37] M. Zinke-Allmang, L. C. Feldman, and M. H. Grabow. Surf. Sci. Rep., 16(8):377, 1992.
- [38] D. D. Vvedensky. Phys. Rev. B, 62:15435, 2000