Global temperatures and sunspot numbers. Are they related? Yes, but non linearly. A reply to Gil-Alana et al. (2014)
Abstract
Recently Gil-Alana et al. (Physica A: Statistical Mechanics and its
Applications 396, 42-50, 2014) compared the sunspot number record
and the temperature record and found that they differ: the sunspot
number record is characterized by a dominant 11-year cycle while the
temperature record appears to be characterized by a “singularity”
or “pole” in the spectral density function at the “zero”
frequency. Consequently, they claimed that the two records are characterized
by substantially different statistical fractional models and rejected
the hypothesis that sun influences significantly global temperatures.
I will show that: (1) the “singularity” or “pole” in the spectral
density function of the global surface temperature at the “zero”
frequency does not exist - the observed pattern derives from the post
1880 warming trend of the temperature signal and is a typical misinterpretation
that discrete power spectra of non-stationary signals can suggest;
(2) appropriate continuous periodograms clarify the issue and also
show a signature of the 11-year solar cycle (amplitude
), which since 1850 has an average period of about 10.4 year,
and of many other natural oscillations; (3) the solar signature in
the surface temperature record can be recognized only using specific
techniques of analysis that take into account non-linearity and filtering
of the multiple climate change contributions; (4) the post 1880-year
temperature warming trend cannot be compared or studied against the
sunspot record and its 11-year cycle, but requires solar proxy models
showing short and long scale oscillations plus the contribution of
anthropogenic forcings, as done in the literature. Multiple evidences
suggest that global temperatures and sunspot numbers are quite related
to each other at multiple time scales. Thus, they are characterized
by cyclical fractional models. However, solar and climatic indexes
are related to each other through complex and non-linear processes.
Finally, I show that the prediction of a semi-empirical model for
the global temperature based on astronomical oscillations and anthropogenic
forcing proposed by Scafetta since 2009 has up to date been successful.
-
Cite as: Scafetta, N., 2014. Global temperatures and sunspot numbers. Are they related? Yes, but non linearly. A reply to Gil-Alana et al. (2014). Physica A: Statistical Mechanics and its Applications 413, 329-342. DOI: 10.1016/j.physa.2014.06.047
1Active Cavity Radiometer Irradiance Monitor (ACRIM) Lab, Coronado, CA 92118, USA
2Duke University, Durham, NC 27708, USA
1 Introduction
Gil-Alana et al. [1] (herein referred to as GYS2014) compared patterns between a global surface temperature record and the sunspot number record. The aim was to determined whether the two records could be statistically related and could be described by a common fractional model. GYS2014 could not find a clear relationship between the two records. Consequently, GYS2014 questioned the hypothesis of a sun–climate complex coupling proposed in several papers authored by Scafetta and collaborators (GYS2014 references Scafetta et al. [6], Scafetta and West [7, 8, 9, 10, 11, 12], Scafetta [13, 14, 15]) and by numerous other authors (GYS2014 references Douglass and Clader [16], Eddy [17], Eichler et al. [18], Friis-Christensen and Lassen [19], Hoyt and Schatten [20], Kirkby [21], Lean and Rind [22], van Loon and Labitzke [23], Shaviv [24], Soon [25], White et al. [26]). Herein I will show that GYS2014’s interpretation is incorrect because it is based on a misunderstanding of the critiqued studies and also on mathematical and physical misinterpretations.
The topic addressed by GYS2014 is important because it refers to the problem of whether the temperature signal presents a complex signature of astronomical forcings that are mostly regulated by harmonics or, alternatively, the temperature signal is essentially an autocorrelation fractional signal (for example a AR(1) process) regulated by internal chaotic dynamics alone.
To do this, GYS2014 analyzed and compared the stochastic memory (self-similarity) of the annual sunspot number and the land-ocean temperature record using a auto-covariance like-function and the spectral density function looking for spectral peaks at some common frequencies. They assumed for the two time series two different fractional process-models because, while the sunspot numbers show a strong cyclical pattern at about the 11-year periodicity, global temperatures mainly show an increase across the sample (period 1880-2010) with superposed some "apparently" minor modulations. They concluded: “Due fundamentally to the different stochastic nature of the two series we reject the hypothesis of a long term equilibrium relationship between the two variables. Finally, using sunspot numbers exogenously, our results reject the hypothesis that they affect global temperatures.”
However, the fact that temperature variations and sunspot numbers may show different stochastic behaviors according to a specific stochastic measure is not a novelty. The finding simply means that these two records correspond to different physical processes, as well known. Temperatures are the result of the action, or the reaction, of a complex combination of terrestrial factors that can be forced by numerous factors including specific solar-astronomical components. Sunspot numbers depend, but not linearly, on the magnetic activity of the Sun, on the changing geometry of its magnetic field and other things. The two observables may be related, but for evident physical considerations the relation is unlikely linear nor simple.
Thus, simply showing that a specific statistical analysis (namely GYS2014’s testing of the univariate statistical properties of the two series) is unable to clearly highlight the existence of a relationship between two physical processes does not imply that the two processes are physically or statistically unrelated. In fact, the existence of a statistical relationship between solar and climate records has been established in numerous studies using alternative and advanced pattern recognition methodologies (direct filtering comparisons, nonlinear process comparisons, physical modeling, etc.). Thus, GYS2014 should have demonstrated that their analysis methodology is more appropriate than those used in the literature. However, they do not discuss this issue leaving open the possibility that it is GYS2014’s statistical methodology and/or their interpretation that are inappropriate or defective in some way.
I will show that GYS2014’s argument is based on some misunderstandings. In fact, none of the studies supporting the existence of a significant link between solar-astronomical factors and climate, have claimed that the sunspot number record mirrors the global surface temperature record in the way GYS2014 used these records. Indeed, any direct linear comparison between the two records could only highlight the evident fact that the two records present substantially different patterns, as also GYS2014 show in their figure 2. On the contrary, the sun–climate link has been often defined as “complex” because involves multiple subtle mathematical and physical issues not discussed in GYS2014, but taken into account in the scientific literature that they have referenced.
In the following I will try to clarify the main misunderstandings encountered in GYS2014.
2 Understanding the periodogram of the global surface temperature record: discrete versus continuous algorithms
Here I will comment on the Fourier analysis proposed in GYS2014 and on their claim that a “singularity” or “pole” exists in the temperature spectral density function at the “zero” frequency that, being not found in the cyclical sunspot number record, would question the existence of a significant relationship between the two records.
Figure 1 reproduces the sunspot number record (labeled as SN in GYS2014) and the GISS global surface temperature (labeled as GT in GYS2014) and their periodogram panels depicted in figure 1 of GYS2014. My additions and comments are reported in red. In particular, I had to guess and add the labels that were missing. GYS2014 used annually sampled records. The temperature units are expressed in hundredth of degree Kelvin from 1880 to 2009. In the caption of their figure 1 GYG2014 write: “In the periodograms, the horizontal axis refers to the discrete Fourier frequencies , .” However, from the reported numbers it can only be inferred that the index is not the frequency but the Fourier frequency number that, for a 130-year sequence, is made to vary from 1 to 65.
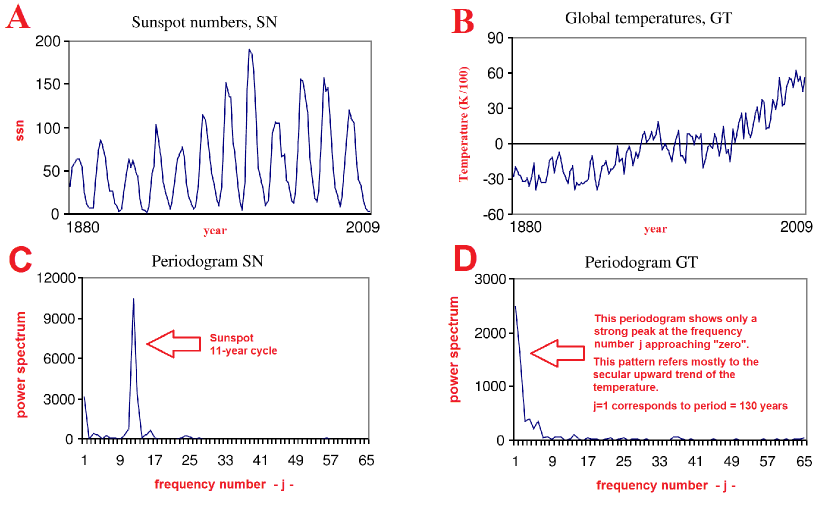
GYS2014 found that the sunspot number presents a spectral peak at about 11-year period (frequency number ), while for the temperature it is stated that “the highest value in the periodogram takes place at the smallest (zero) frequency.” From this evidence they concluded that while the sunspot number record could be described by a cyclical fractional model, the global temperature record could be described by a fractionally integrated or model. Because the two stochastic models are substantially different, GYS2014 rejected the hypothesis of a relationship between the two variables in the long run.
A spectral pole at the “zero” frequency is, however, questionable given the fact that frequency numbers correspond to periods larger than the length of the record, where spectral analysis is not reliable any more. GYS2014 inferred a pole in the temperature spectral density function ( as ) because Figure 1D shows a strong spectral maximum of about 2500 units at the Fourier frequency number . However, this maximum has a very simple explanation exposed in Figure 2 and cannot be extrapolated to imply an infinite pole as and, therefore, a fractionally integrated or model does nor describe the temperature signal.
Figure 2A shows the GISS temperature studied in GYS2014. Figure 2B shows a high resolution continuous periodogram of the GISS temperature plotted against the continuous frequency expressed in the Fourier frequency number in log-scale from to . The limit , which corresponds to the lowest frequency in the discrete Fourier transform, is highlighted with a green vertical line.
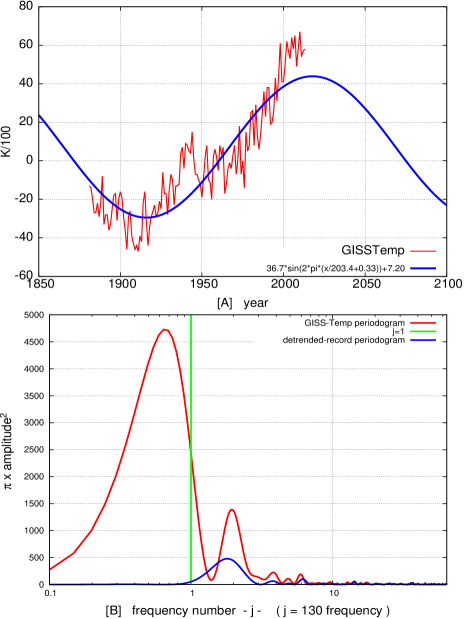
Figure 2B shows that the temperature continuous periodogram (red curve) intersects the limit at a power value of about 2500 in agreement with GYS2014 finding of Figure 1D. However, as decreases the power spectrum reaches a maximum at and then it converges to zero for . In fact, as the frequency approaches zero the periodogram fit curve approaches an horizontal straight line in the sequence interval . The spurious harmonic at can be calculate by regression and is given by:
| (1) |
Eq. 1 is shown in Figure 2A in the blue curve and clearly suggests that it represents a spurious oscillation that the periodogram models in its attempt of interpreting the temperature warming trend using harmonics. If this spurious harmonic is removed from the data, the spectral peak found in the interval vanishes as the periodogram of the detrended temperature shows: see the blue periodogram curve in Figure 2B. The periodogram for the sunspot record depicted in Figure 1C presents an equivalent artifact at but it is strongly attenuated simply because in the 1880-2010 interval this record is more stationary than the temperature record.
In addition, the red curve of Figure 2B presents a spectral peak at about , which corresponds to a period of about 60 years. This spectral peak appears to be missing in GYS2014’s figure 1D because there a discrete Fourier power spectrum is depicted at the integer values and the discrete points were connected with lines. This gave the misleading impression that the power spectrum of the temperature strongly increases as which gives the impression of a “pole” at the “zero” frequency. Therefore, GYS2014 interpretation is illusive because it derives (1) from the discrete nature of the Fourier Analysis, (2) from improperly connecting the spectral discrete points with lines and (3) from extrapolating the trend of the apparent resulting curve for .
Therefore, GYS2014’s “singularity” or “pole” in the spectral density function at the “zero” frequency does not exist. The observed pattern emerges as an artifact that discrete periodogram algorithms produce in their attempt of interpreting a record that within a given interval is non-stationary, that is, presents a trend.
Thus, GYS2014’s periodogram comparison is somehow misleading because it compares the 11-year sunspot cycle against the secular warming trend of the temperature. The latter, however, is not directly related with the sunspot number cycle but has several physical contributions such as the anthropogenic component plus long solar and astronomical cycles. These cycles cannot be linearly deduced from the sunspot number record, which shows just a dominant 11-year cycle and a small secular modulation, but need to be evaluated using appropriate solar models [15, 19, 20, 21, 28, 30, 33, 36, 38, 39, 47, 48].
To detect the 11-year solar cycle signature in the temperature record, appropriate filtering methodologies [8, 9, 13, 15, 16, 22, 26, 41] or high resolution spectral techniques need to be used. Periodograms may need to be plot in the log-log-scale, as shown below. Removing the upward secular trend of the temperature would also be useful because spectral techniques work better for stationary records, while a strong upward trend introduces a significant nonstationarity that can disrupt the spectral analysis of the signal.
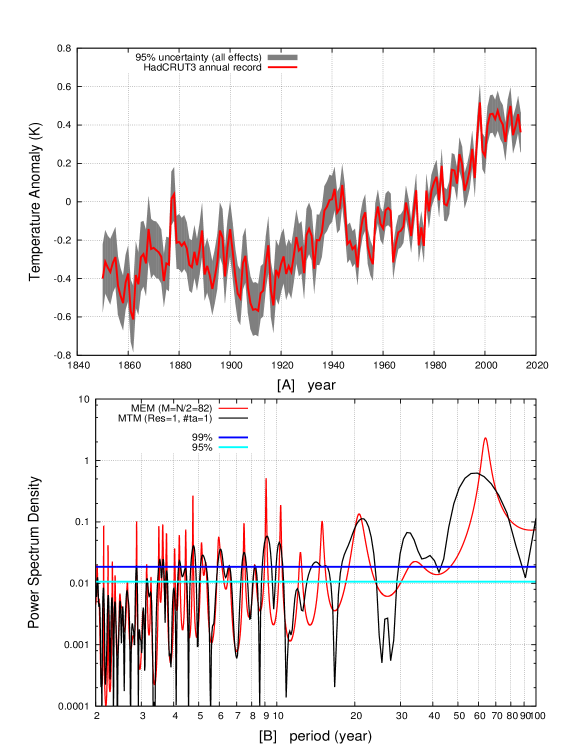
Scafetta [3, 4, 14] used advanced spectral methodologies and showed that global surface temperature records, including the GISS temperature used in GYS2014, present numerous specific spectral peaks. For the benefit of the reader, Figure 3A shows the HadCRUT3 global surface temperature annual record [49], which was used by Scafetta in several publications where it was preferred to the GISS temperature record used in GYS2014 because it starts in 1850. Figure 3B shows the Multi Taper Method (MTM) periodogram and the Maximum Entropy Method (MEM) spectrum (using a pole number M=N/2, where N=164 samples). Numerous highly confident spectral peaks are found, and correspond to several solar, lunar and astronomical oscillations as explained in the literature (e.g.: Scafetta [3, 4, 14, 33]). The statistical confidence levels (95% and 99%) are deduced from the combined effects of all known physical temperature uncertainties. The annual average range of the statistical error ( ) varies in time and is shown in A by the gray area. (http://www.metoffice.gov.uk/hadobs/hadcrut3/diagnostics/time-series.html): these are given by (for the 95% confidence) and (for the 99% confidence).
The most prominent temperature spectral peaks shown in Figure 3B are found at these periods: 9.1 years, 10-12 years, 20 years and 60 years. The variable 10-12 year temperature oscillation corresponds to the 11-year solar cycle that during most of the 20th century was usually short and bounded between 10 and 11 years; its amplitude was estimated to be just a few hundredths of degree Kelvin up to a maximum of K during specific periods. Therefore, power spectra of global surface temperature records represent the sunspot cycle as a main spectral peak at about 10.4 year period [2, 3, 14]. The 9.1-year cycles appears to be related to lunar tidal cycles because it is between the 8.85-year lunar apside rotation cycle and the second harmonic of the 18.6 lunar nodal cycle and inclination cycle. The other spectral peaks correspond to other solar and astronomical oscillations of the Heliosphere (e.g: Scafetta [3, 4, 14, 53]). Note that the quasi 20-year cycle may be made of three close astronomical harmonics (see discussion in Scafetta [3, appendix]): the 18.6-year lunar cycle, the quasi 20-year oscillation induced in the Heliosphere by Jupiter and Saturn and the quasi 22-year Hale solar magnetic cycle that may have a high relevance for the Earth’s climate, because the Earth is imbedded in the Heliosphere.
Thus, the evidence emerging from the periodogram is that the temperature signal is regulated by oscillations like the sunspot number record and, therefore, belongs to the same statistical family: a cyclical fractional model plus, eventually, a non-cyclical anthropogenic component during the last decades.
3 Evidences from the scientific literature on short and long scale correlations between solar and climatic records
About the sunspot number and the temperature records GYS2014 claimed that “no relationship between the two variables in the long run” exists. In this section I will show that part of the misunderstandings were due to the fact that GYS2014 used as solar index the sunspot number record. GYS2014’s methodology implicitly assumes that the sunspot number record is linearly related to the other solar observables. They also claimed that the total solar irradiance increases with the number of sunspots because “more sunspots release energy into the atmosphere.” However, these arguments are physically inaccurate.
It is well-known that sunspots release less energy than the surrounding solar surface. During solar maxima, the total solar irradiance (TSI) does not increase because of the energy released by the sunspots, which is less, but mostly because of the energy released by the solar faculae, which are hot-spots forming on the solar surface. During solar maxima, the faculae number and area increase and their strong brightness overcomes the sunspot darkness. In addition to the irradiance contributions from faculae and sunspots, which mostly regulate the TSI high frequency component, most of the TSI contribution comes from the quieter extended solar regions. The emission from the quiet regions can gradually evolve in time and regulate the TSI low frequency component. Numerous other solar phenomena occur such as variations of solar magnetic fields and of solar wind fluxes (http://www.solarviews.com/eng/sun.htm). The intrinsic complexity of the solar dynamics and of its multiple coupled phenomena demonstrates that the sunspot number record is not linearly related to other solar observables. Thus, the sunspot number record cannot be used as a representative of the global solar influence on the Earth’s climate. Moreover, the climate of the Earth is regulated by several anthropogenic and natural factors, which need to be factorized to properly identify the solar contribution.
Let us summarize how the scientific literature cited in GYS2014 have addressed the above issues that are necessary to understand the solar contribution to climate change and show how closely solar and global surface temperature records appear to be related to each other at short and long time scales once the appropriate methodologies and solar models are adopted.
3.1 The sunspot number record is only a partial proxy of solar activity
The sunspot number record is used in solar physics only as one of the several ingredients adopted to make proxy models of solar activity. It is these solar proxy models that are then compared in various ways against the temperature records and/or used as external forcing of climate models. The scientific works that GYS2014 referenced did not base their argument using directly the sunspot number record. Those authors noted that specific solar proxy models correlate quite well with the temperature patters at multiple scales. It is those results that have suggested the existence of a significant link between solar activity and climate. Let us clarify some of the case addressed in GYG2014.
(1) GYS2014 claimed that Friis-Christensen and Lassen [19] “show that sunspot numbers between 1861 and 1989 display a significant relationship with the Northern Hemisphere (NH) mean temperatures”. However, those authors did something quite different. Friis-Christensen and Lassen [19] found that NH land temperatures have some similarity with the 11 year smoothed sunspot record, but the land temperature record leads the sunspot record during some periods (e.g. the temperature peaks in the 1940s while the sunspot record peaks around 1960), and then the latter cannot be an usable index for the solar forcing. They then went on to investigate the relation using the length of the solar cycle as a proxy model for solar activity, and found good correlation with the temperature record when the solar cycle length record is smoothed over 5 cycles (low pass filter 1-2-2-2-1). Because of this smoothing they really investigated only longer periods of the order of several decadades (e.g. the Gleissberg solar spectral range of 50-90 years). Thus, Friis-Christensen and Lassen [19] used a solar proxy model based on the temporal duration of the solar cycle length and its smooths. Although, the latter was deduced from the sunspot number record, the record is characterized by multidecadal patterns that well correlate with the temperature record (both peak in the 1940s) but poorly correlate with the sunspot number record itself. GYS2014 correctly highlighted that the original model proposed by Friis-Christensen and Lassen [19] had a problem, which was actually a border artifact due to the smoothing that could not well model the last two decades. However, GYS2014 did not acknowledge that the solar cycle length model was later updated [27, 28, 29] and only since around 1990 the type of solar forcing that is described by the solar cycle length model no longer appears to dominate the long-term variation of the Northern hemisphere land air temperature. The finding implies that at least 50% of the the post 1850 global warming could be still associated to solar variability, which is a finding consistent with other recent studies [cf.: 3, 4].
(2) The good multisecular solar-climate correlation found by other authors (Eichler et al. [18], Hoyt and Schatten [20, 30], Soon [25]) focused on multidecadal and secular patterns and were based on advanced multi-proxy solar models, not on the sunspot number record alone.
(3) Some of the preliminary results of Scafetta and West [7] and Scafetta et al. [6] were based on a proxy solar model made of the time intervals between major solar flares: they did not use the sunspot number record. In this case GYS2014 referenced a critical study by Rypdal [31]. However, GYS2014 did not acknowledge the rebuttal by Scafetta and West [32] that demonstrated the numerous severe misconceptions of their work made in Rypdal [31] who confused the time interval between flares, which was the variable used in Scafetta and West [32], for the solar flare index that is an energy intensity record.
(4) Kirkby [21] does not use the sunspot number record but cosmic ray records and their proxy models. The latter models are based on cosmogenic nuclides such as and , whose production on the Earth is related to the solar electromagnetic activity. These solar proxy models present an 11-year cycle similar but not identical to the 11-year sunspot number oscillation. In addition, while the sunspot number is characterized by similar minima close to zero with a relatively small low frequency component, the used proxy models present a more significant low frequency modulation because they are not physically bounded at zero as the sunspot number record, and well correlate with a number of climatic indexes at multiple scales.
(6) Scafetta and West [8] based their analysis on the ACRIM composite of total solar irradiance satellite measurement that, contrary to the sunspot number record, presents an upward trend from 1980 to 2000, and better correlates with the observed temperature warming during the same period. See also Scafetta and Willson [42, 43] to better understand the issues related to the TSI records and why they differ from the sunspot number record.
(7) Scafetta and West [10], Scafetta [13, 15] used multi-scale thermal models of several total solar irradiance proxy records based also on total solar irradiance satellite measurements. Again, they did not use the sunspot number record.
(8) Finally, Scafetta [3, 4, 14, 33] used alternative and more advanced empirical models for interpreting climate changes. These new models are based on solar and astronomical oscillations assumed to be regulating solar activity and, directly or indirectly, the Earth’s climate plus the anthropogenic and volcano contributions. Again, the proposed solar-astronomical proxy models present patterns that differ from the sunspot number record.
Of course there are numerous other works showing a significant correlation between specific solar indexes and climate records (e.g.: Mufti and Shah [34], Soon [25, 35], Soon and Legates [36] and many others). All solar proxy models adopted in the above studies can present some similarity with the sunspot number record but also strong dissimilarities, in particular in the multi-decadal and secular scales, which are necessary to properly interpreting the low-frequency component of the temperature record.
3.2 Climate change is not determined by solar forcing alone
The global surface temperature patters are not determined exclusively by solar inputs and even less by sunspots alone. On a time scale up to the millennial one, global climate averages are mostly regulated by volcano eruptions, anthropogenic forcings and numerous natural oscillations, which include solar, astronomical and lunar tidal oscillations. To avoid misleading conclusions, the various physical attributions need to be taken into account.
In fact, while GYG2014 simplistically compared the sunspot number against the temperature record, many authors that they reference used multi-attribution analysis methodologies. For example, Douglass and Clader [16], Lean and Rind [22], van Loon and Labitzke [23], Scafetta [13, 15] evaluated the signature of the 11-year solar cycle on the temperature by simultaneously filtering off the volcano signature, the anthropogenic signature and the ENSO oscillations. These authors found that during the period from 1980 to 2000, which experienced very large 11-year solar oscillations, the 11-year solar cycle signature on the global surface temperature had an amplitude (from min to max) of about 0.1 K. Indeed, the amplitude of the 11-year solar cycle signature is very small in the global surface temperature record. However, it increases with the altitude. For example, in the higher troposphere the amplitude of the 11-year solar signature can be as large as 0.4 K, as demonstrated in several studies [e.g.: 15, 23, 41].
On longer time scales the solar influence becomes clearer once appropriate solar proxy models are used. This has been demonstrated by numerous authors such as Eddy [17], Hoyt and Schatten [20], Kirkby [21], Scafetta [15, 33]. More recently, Steinhilber et al. [44] found an excellent correlation between a 9,400-year cosmic ray proxy model of solar activity from ice cores and tree rings and the Holocene Asian climate as determined from stalagmites in the Dongge cave, China. Scafetta [3, 33] also highlighted a multi-secular and millennial correlation between climate records and specific solar models. See also Scafetta [13, 3, 4] where the multiple contributions to climate changes are empirically analyzed. About the strong millennial oscillation common to both solar and temperature records see also Humlum et al. [37], Bond et al. [38], Kerr [39], where it was argued that the millennial natural oscillation contributed significantly to the warming observed since 1850. In fact, the temperature experienced significant warm periods during the Roman Optimum (100 B.C. - 300 A.D.), and during the Medieval Warm Period (900-1400 A.D.) and significant cool periods during the Dark Age (400-800 A.D.) and the Little Ice Age (1400-1800 A.D.) [40]. Therefore, following this millennial cycle since 1800 the temperature had to increase naturally until the 21th century.
On the contrary, using the sunspot number record as the privileged solar index to be compared against the temperature record GYG2014 could not take into account that: (1) the solar effect on climate is frequency related and the effects usually get greater at lower frequencies; (2) some climatic patterns are not related to solar variations but have a different physical origin (e.g. the post 1850 warming can be partially attributed to anthropogenic emissions); and (3) that in any case in the relevant solar-climate scientific literature only specific solar proxy models are used and these present patterns more complex than those shown just by the sunspot number record.
After having noted that not even and other greenhouse gases, either of natural or of anthropogenic origin, could be the cause, let alone the primary cause, of global climate changes, Quinn [45] wrote: “Evidence indicates that global warming is closely related to a wide range of solar-terrestrial phenomenon, from the sun’s magnetic storms and fluctuating solar wind all the way to the Earth’s core motions. Changes in the Solar and Earth magnetic fields, changes in the Earth’s orientation and rotation rate, as well as the gravitational effects associated with the relative barycenter motions of the Earth, Sun, Moon, and other planets, all play key roles. Clear one-to-one correspondence exists among these parameters and the Global Temperature Anomaly on three separate time scales.” Many of these issues are discussed for example in the Scafetta’s papers and in other references.
Indeed, in the last paragraph of their conclusion GYG2014 acknowledged some limits of their analysis such as the fact that “anthropogenic factors and other climatologic variables may be included in the model, thus avoiding the problem that may be caused by the potential omission of relevant variables.” However, as explained above, several of the studies that GYG2014 referenced have already done what GYG2014 proposed at the end of their paper, and showed that a clear solar signature in the climate records emerges at both the short and the long scales once that all contributions are taken into account.
3.3 Empirical studies versus climate model studies
It is important to clarify an issue that was only briefly addressed in GYS2014 who correctly highlighted that there is no consensus on the solar contribution to climate change. While empirical studies, as those briefly summarize above, have found a strong but complex solar signature in the climate system at multiple timescales and have claimed that the sun contributed at least of the post 1850 global warming, analytical climate models, such as the general circulation models (GCMs), have predicted only a 5% or lower solar contribution to the warming observed during the same period (e.g. see the IPCC [46]). It is important to realize that the apparent incompatibility between the two sets of studies is due to (1) the different philosophical approaches used to address the problem and (2) to the current lack of scientific understanding of microscopic physical mechanisms regulating climate change.
In the empirical studies, researchers focus on the macroscopic characteristics revealed by the data and provide attribution interpretations using various forms of detailed cross-correlation pattern recognition methodologies. The empirical/holistic approach does not require the microscopic identification of all physical mechanisms to recognize macroscopic patterns such as cycles, which can be directly modeled.
On the contrary, the analytical GCM approach focuses on the microscopic modeling of the individual physical mechanisms: it uses Navier-Stokes equations, thermodynamics of phase changes of atmospheric water, detailed radiation budget of the Earth and atmosphere and ocean dynamics, specific radiative forcing functions as inputs of the model, etc. The GCMs depend on very numerous internal variables and are characterized by serious uncertainties such as those related to the cloud formation [46], which regulate the important albedo index.
It is evident that the analytical models need to be physically complete to be meaningful. On the contrary, there are several reasons suggesting that the current analytical climate models are incomplete. This explains why there is no consensus between the empirical and analytical studies about the solar contribution to climate change. Let us briefly summarize some of the arguments proposed in the referenced literature.
(1) The analytical models such as the CMIP5 GCMs adopted by the IPCC [46] have used a solar forcing function deduced from a total solar irradiance proxy record that shows only a very small secular variability (e.g. Wang et al. [47]), while alternative total solar irradiance proxy models showing a far greater secular variability and different details in the patters also exist [20, 48]. These alternative solar models better correlate with the temperature patterns on multiple scales and reconstruct a large fraction of the warming observed since 1850 [3, 20, 25, 35, 36].
(2) The analytical models still assume that solar-climate interaction is limited to TSI forcing alone. However, other solar-climate mechanisms likely exist although still poorly understood. For example, the climate system may be particularly sensitive to specific radiations (e.g. ultraviolet light) and to cosmic ray or solar wind that could significantly modulate the cloud cover system [21].
(3) The climatic records are characterized by numerous natural oscillations from the decadal to the millennial timescales that have been demonstrated to be not reproduced by the analytical models, but are present in specific solar, lunar and astronomical records [2, 3, 4, 14, 33]. These oscillations, including the millennial cycle, stress the importance of solar and astronomical effects on the Earth’s climate [3, 44].
In general, analytical models may theoretically be considered the best way to exploit the confirmatory analysis. However, the exploratory analysis - which is needed in order to envisage the primary physical drivers of phenomena - is a completely different gnoseologic concern. One cannot substitute the crucial stage of the exploratory analysis with any kind of complex confirmatory mathematics. Both stages are needed and, in general, to describe a complex system usually empirical/holistic approaches may be more satisfactory than an analytical ones. For example, in the analytical modeling, mistakes can be easily made when the original set of primary drivers is speculated.
3.4 A few examples showing a significant correlation between solar-astronomical records and temperature records in the short and long scales
As discussed above, the scientists who studied the solar-climate relation and reached the conclusion of a significant solar contribution to climatic changes did not use the sunspot record because it is substantially different from the temperature record. To properly acknowledge the scientific efforts and the results made by numerous specialists, I think that it is important to briefly summarize here some of their results for the benefit of the readers.
These few examples are useful also for responding some of the issues addressed in GYS2014, namely that the solar signature on climatic records can be extracted and properly recognize only using appropriate solar proxy models, appropriate filtering and multi-forcing analysis and, for properly interpreting the low frequency component of the signal, long sequences should be used to avoid misinterpretations.
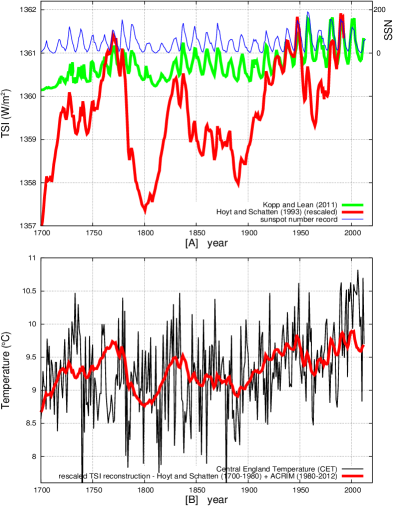
Figure 4A compares the sunspot number record since 1700 (blue curve) versus two alternative total solar irradiance reconstructions [47, 20]. The figure highlights that while the sunspot number is relatively flat, solar proxy models present a more significant secular variability, which depends greatly on the specific proxy used. Figure 4B simply compares the Central England Temperature record [52] and the solar reconstruction proposed by Hoyt and Schatten [20]. A good correlation is noted for 300 years, which includes a significant portion of the warming observed since 1900, which gives origin to GYS2014 putative “zero” frequency “pole”, as explained in Section 2.
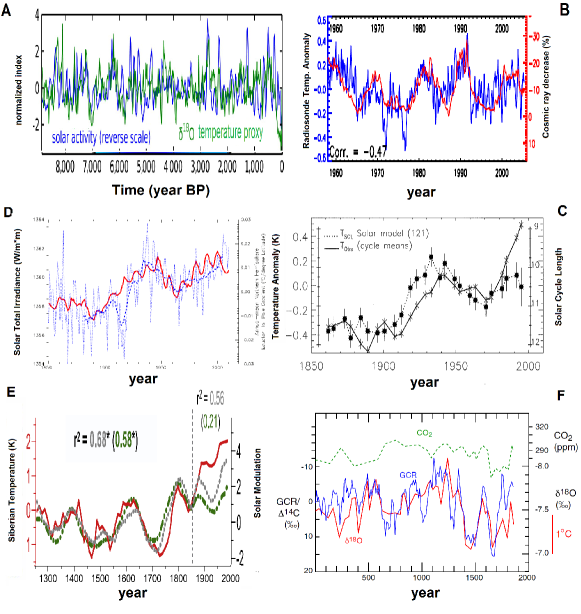
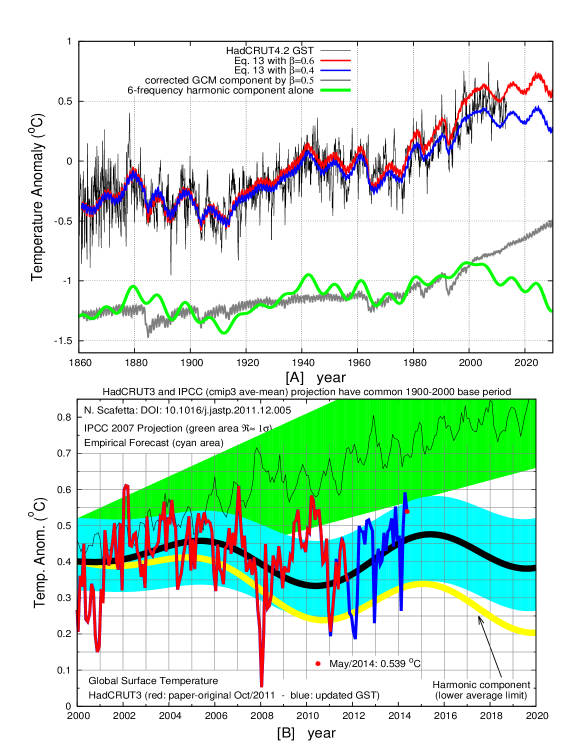
Figure 5 shows examples of solar-climate correlations taken from Steinhilber et al. [44], Svensmark and Friis-Christensen [41], Soon and Legates [36], Thejll and Lassen [27], Eichler et al. [18] and Kirkby [21]. Here the correlation between solar-astronomical records and climate records is evident at short and long time scales. Figure 5A compares a reconstruction of solar activity and a reconstruction of Asian climate during the Holocene (last 9000 years) [44]. Figure 5B shows that the radiosonde temperature anomalies, after an appropriate filtering of other climatic factors, reveals a clear signature of the 11-year solar cycle reconstructed by the cosmic ray record [41]. Figure 5C compares the instrumental global surface temperature record versus a SCL121 solar cycle length model [27]. Figure 5D compares the annual-mean equator-to-pole gradient over the entire Northern Hemisphere versus the estimated total solar irradiance record (red) of Hoyt and Schatten [20] (red, with updates by Scafetta and Willson [43]) from 1850 to 2010 [36]. Figure 5E compare a Siberian temperature reconstruction with solar activity proxies for 750 years [18]. Figure 5F depicts a temperature reconstruction for the Central Alps over the last two millennia, obtained from a based temperature proxy model versus the variations of cosmic rays and over the same period [21]. All these figures suggest a strong cross-correlation between solar proxy models and temperature patterns, which again also include a significant fraction of the warming observed since 1850. These empirical results indicate that the Sun has a significant influence on the climate system, but it is not the sole contributor.
Figure 6A shows the good performance of an empirical model for the global surface temperature proposed by Scafetta [3], which was made of 6 specific solar-astronomical cycles (periods 9.1, 10.4, 20, 60, 115, 983 yr) modeling the natural decadal-to-millennial natural climatic oscillations plus an estimate of the anthropogenic and volcano components made by properly attenuating the CMIP5 general circulation model ensemble mean simulation by a factor . Scafetta [3] showed that his model outperforms all CMIP5 general circulation models in reconstructing the global surface temperature record. Figure 6B shows a detail with an update of the semi-empirical astronomical model proposed by Scafetta [2] in 2011. The red curve shows the original global surface temperature record published in Scafetta [2], which ended in October 2011. The blue curve shows the global surface temperature updated to the most current available month, which is March 2014. The back curve within the cyan 1- error area is the semi-empirical astronomical model forecast (which was modeled to start in 2000). The figure clearly shows that the proposed semi empirical model outperforms the IPCC 2007 CMIP3 general circulation model projections (green area) and has successfully forecast the temperature trend from October 2011 to March 2014. Similar results are found against the CMIP5 models [3, 4]. Note that a simplified version of the same model was proposed by Scafetta since 2009 [5, 14] and the proposed model has correctly predicted the observed continued standstill of the global surface temperature while the CMIP3 and CMIP5 general circulation models adopted by the IPCC [46] predicted for the period 2000-2014 a strong warming of about 2 , which has not been observed.
Figures 4, 5 and 6 provide a strictly alternative message than figure 2 in GYS2014 that depicted directly the sunspot number versus the temperature record in such a way to give a reader the impression that no relationship exists between the two records.
4 Conclusion
GYS2014 claimed that the temperature record is characterized by a “singularity” or “pole” at the “zero” frequency while the sunspot number record presents a dominant 11-year cyclical pattern. From there they inferred that the two systems are characterized by two fundamentally different stochastic natures: the temperature signal would be a fractional integrated or I(d) model, while the sunspot number record would be a cyclical fractional model. Therefore, the two records were claimed to be not related.
I have demonstrated that the presumed temperature singularity at the “zero” frequency does not exist. GYS2014’s observed pattern (a strongly increasing power in the temperature spectrum as the frequency number ) is an artifact that discrete periodogram algorithms can suggest when processing non-stationary sequences. On the contrary, a continuous periodogram (see Figure 2B) reveals that as the frequency approaches zero (Fourier frequency number ) the power spectrum reaches a maximum and then it converges to zero, not to infinity, as suggested in GYS2014. Continuous periodograms (Figure 2B and 3B) also reveal a number of highly significant spectral peaks suggesting that the temperature record is made of numerous oscillations that were hidden in GYS2014 discrete periodogram.
From the continuous temperature spectra depicted in Figure 2B and 3B the only possible conclusion is that the temperature too can be described by a cyclical fractional model like the sunspot number record, although to properly identify the temperature harmonics proper solar/astronomical models need to be used. This result corrects GYS2014’s claim that “Due fundamentally to the different stochastic nature of the two series we reject the hypothesis of a long term equilibrium relationship between the two variables.” As confirmed by my analysis and explained in the literature, the temperature is likely made of a natural harmonic components with a likely solar/astronomical origin, plus a non-harmonic anthropogenic component particularly active during the last decades [3, 4, 33].
The good correlation between solar/astronomical models and the climate system is obscured in GYS2014 because they used the sunspot number record as the privileged solar index. However, the works claiming the existence of a significant link between the sunspot and the climate records at both the short and long time scale did not base their argument directly on the sunspot number record. They used solar proxy models that significantly differ from the sunspot number record in particular in the multidecadal and multisecular modulation, in other patterns and also for physical construction. Moreover, the referenced literature already acknowledges and takes into account that multiple factors, both anthropogenic and natural, modulate climatic records. These factors need to be simultaneously factorized out to clearly reveal the solar-astronomical component of climate changes.
In particular, the global surface temperature record contains an 11-year solar cycle signature but, as well known, it is relatively small, just a few hundredths of degree Kelvin, and beats with the year soli-lunar tidal cycle. This small solar signature can be hardly noticed without an appropriate analysis as those proposed for example in Scafetta [2, 3, 4, 14, 33] and by numerous other authors [16, 20, 22, 23, 41]. Numerous other natural oscillations linked to solar variations exist such as cycles at 20, 60, 115, 1000 year etc. [3, 4, 18, 17, 21, 29, 33, 38, 39, 40, 44]. Empirical models based on these signatures have been proposed and demonstrated to reconstruct the temperature patterns since 1850 better than the CMIP3 and CMIP5 general circulation models adopted by the IPCC [46]. In particular the solar-astronomical semi-empirical models have correctly predicted the temperature standstill observed since 2000 while the CMIP3 and CMIP5 general circulation models have predicted a strong warming that has not been observed [3, 4, 53].
In conclusion, the claim that the global surface temperature record is a fractional random signal fundamentally different from the harmonic nature of the astronomical signals is not supported by the data and careful analysis. The global surface temperature record appears to be made of natural specific oscillations with a likely solar/astronomical origin plus a non-cyclical anthropogenic contribution during the last decades. Indeed, because the boundary condition of the climate system is regulated also by astronomical harmonic forcings, these frequencies need to be part of the climate signal in the same way the tidal oscillations are regulated by soli-lunar harmonics.
Appendix
Both MEM and the periodogram are used in Figure 3 because, as Press et al. [51, pp. 574] wrote, "Some experts recommend the use of this algorithm in conjunction with more conservative methods, like the periodogram, to help choose the correct model order, and to avoid getting too fooled by spurious spectral features." Essentially, the two methodologies should be applied in the following way: first the periodogram is used to find the spectral peaks with their statistical confidence, then MEM is used to sharp the results. MEM spectral peaks that are not confirmed by the periodogram should be rejected. For sharpness the MEM order M should be chosen in function of the spectral band that needs to be analyze: M needs to be very high up to the maximum N/2 (N is the number of data points in the sequence) to efficiently analyze the low frequency range [2, supplement]. Figure 2B uses MEM with and does not show spurious peaks because each MEM peak is confirmed by a correspondent peak in the MTM periodogram, and most peaks for 4-year and larger periods have a 95% and more statistical confidence relative to the physical noise of the signal.
Power spectra are also affected by a specific resolution related to the length of the record, which is given by . Taking into account the specific spectral resolution is important to separate close harmonics. For example, two frequencies and can be separated only if . In spectral analysis, a spectral peak at frequency has an error of ; the correspondent period is . Thus, if is larger than the temporal interval of the sequence, the spectral analysis becomes highly unstable. Moreover, to properly separate the harmonic constituents of the temperature, if they have an astronomical origin as suggested in Scafetta [14], spectral analysis requires a resolution of , which corresponds to a segment length of years. In fact, astronomical frequencies are harmonics of a 178.4 year period [cf. 53, figure 4]. Temperature segments longer than 100 years would be necessary to separate at least the major expected constituent harmonics and recognize an astronomical influence on the climate at the decadal-secular scales. Thus, using temperature segments of 20 to 60 years as proposed by Holm [54] is inefficient to highlight a spectral coherence between astronomical and temperature harmonics.
References
- Gil-Alana et al. [2014] L. A. Gil-Alana, O. S. Yaya, O. I. Shittu. Global temperatures and sunspot numbers. Are they related? Physica A: Statistical Mechanics and its Applications 396 (2014) 42-50.
- Scafetta [2012b] N. Scafetta. Testing an astronomically based decadal-scale empirical harmonic climate model versus the IPCC (2007) general circulation climate models. J. Atmos. Sol. Terr. Phys. 80 (2012) 124–137.
- Scafetta [2013] N. Scafetta. Discussion on climate oscillations: CMIP5 general circulation models versus a semi-empirical harmonic model based on astronomical cycles. Earth-Science Reviews 126 (2013) 321-357.
- Scafetta [2013] N. Scafetta. Solar and planetary oscillation control on climate change: hind-cast, forecast and a comparison with the CMIP5 GCMs. Energy & Environment 24(3-4) (2013) 455–496.
- Lorenzetto [2009] Newspaper interview of N. Scafetta by S. . "Se la Terra si surriscalda colpa del Sole: l’uomo non c’entra". Il Giornale, October 25, 2009. http://www.ilgiornale.it/news/se-terra-si-surriscalda-colpa-sole-l-uomo-non-c-entra.html
- Scafetta et al. [2004] N. Scafetta, P. Grigolini, T. Imholt, J. A. Roberts, B. J. West. Solar turbulence in Earth’s global and regional temperature anomalies. Physical Review E 69 (2004) 026303.
- Scafetta and West [2003] N. Scafetta, B. J. West. Solar flare intermittency and the Earths temperature anomalies. Physical Review Letters 90 (2003) 248701.
- Scafetta and West [2005] N. Scafetta, B. J. West. Estimated solar contribution to the global surface warming using the ACRIM TSI satellite composite. Geophysical Research Letters 32 (2005) L18713.
- Scafetta and West [2006a] N. Scafetta, B. J. West. Reply to comments by J. Lean on estimated solar contribution to the global surface warming using the ACRIM TSI satellite composite. Geophysical Research Letters 33 (2006) 15.
- Scafetta and West [2006b] N. Scafetta, B. J. West. Phenomenological solar signature in 400 years of reconstructed Northern Hemisphere temperature record. Geophysical Research Letters 33 (2006) 17.
- Scafetta and West [2007] N. Scafetta, B. J. West. Phenomenological reconstruction of the solar signature in the NH surface temperature records since 1600. Journal of Geophysical Research 112 (2007) D24S03.
- Scafetta and West [2008] N. Scafetta, B. J. West. Is climate sensitive to solar variability. Physics Today 3 (2008) 50–51.
- Scafetta [2009] N. Scafetta. Empirical analysis of the solar contribution to global mean air surface temperature change. Journal of Atmospheric and Solar-Terrestrial Physics 71 (2009) 1916–1923.
- Scafetta [2010] N. Scafetta. Empirical evidence for a celestial origin of the climate oscillations and its implications. Journal of Atmospheric and Solar-Terrestrial Physics 72 (2010) 951–970.
- Scafetta [2013] N. Scafetta. Discussion on common errors in analyzing sea level accelerations, Solar Trends and Global Warming. Pattern Recogn. Phys. 1 (2013) 37-57. http://dx.doi.org/10.5194/prp-1-37-2013
- Douglass and Clader [2002] D. H. Douglass, B. D. Clader. Climate sensitivity of the Earth to solar irradiance. Geophysical Research Letters 29 (16) (2002) 331–334.
- Eddy [1976] J. A. Eddy. The Maunder minimum. Science 192 (1976) 1189–1202.
- Eichler et al. [2009] A. Eichler, S. Olivier, K. Heenderson, A. Laube, J. Beer, T. Papina, H.W. Gaggeler, M. Schwikowski. Temperature response in the Altai region lags solar forcing. Geophysical Research Letters 36 (2009) L01808.
- Friis-Christensen and Lassen [1991] E. Friis-Christensen, K. Lassen. Length of the solar cycle, an indication of solar activity closely associated with climate. Science 254 (1991) 698–700.
- Hoyt and Schatten [1997] D. V. Hoyt, K. H. Schatten. The Role of the Sun in the Climate Change. Oxford University Press, New York (1997).
- Kirkby [2007] J. Kirkby. Cosmic rays and climate. Surveys in Geophysics 28 (2007) 333–375.
- Lean and Rind [2009] J. L. Lean, D. H. Rind. How will Earth’s surface temperature change in future decades? Geophysical Research Letters 36 (2009) L15708.
- van Loon and Labitzke [2000] H. van Loon, K. Labitzke. The influence of the 11-year solar cycle on the stratosphere below 30 km. A review. Space Science Reviews 94 (2000) 259–278.
- Shaviv [2008] N. J. Shaviv. Using the oceans as a calorimeter to quantify the solar radiative forcing. Journal of Geophysical Research 113 (2008) A11101.
- Soon [2009] W.-H. Soon. Solar arctic mediated climate variation on multidecadal to centennial timescales: empirical evidence, mechanistic explanation and testable consequences. Physical Geography 30 (2) (2009) 144–148.
- White et al. [1997] W. B. White, J. Lean, D. R. Cayan, M. D. Dettinger. Response of global upper ocean temperature to changing solar irradiance. Journal of Geophysical Research 102 (1997) 3255–3266.
- Thejll and Lassen [2000] P. Thejll, K. Lassen. Solar forcing of the northern hemisphere land air temperature: new data. J. Atmos. Solar-Terrest. Phys. 62 (2000) 1207-1213.
- Thejll [2009] Thejll, P., 2009. Update of the Solar Cycle Length Curve, and the Relationship to the Global Mean Temperature. Danish Climate Centre Report 09-01.
- Loehle and Scafetta [2011] C. Loehle, N. Scafetta, Climate Change Attribution Using Empirical Decomposition of Climatic Data. The Open Atmospheric Science Journal 5 (2011) 74-86.
- Hoyt and Schatten [1993] D. V. Hoyt, K. H. Schatten. A discussion of plausible solar irradiance variations, 1700–1992. J. Geophys. Res. 98 (1993) 18895–18906.
- Rypdal [2010] M. Rypdal, K. Rypdal, Testing hypotheses about sun-climate complexity linking. Physical Review Letters 104 (12) (2010) 128501.
- Scafetta and West [2010] N. Scafetta, B. J. West. Comment on ‘Testing hypotheses about Sun-climate complexity linking’. Physical Review Letters 105 (2010) 219801.
- Scafetta [2012] N. Scafetta. Multi-scale harmonic model for solar and climate cyclical variation throughout the Holocene based on Jupiter-Saturn tidal frequencies plus the 11-year solar dynamo cycle. Journal of Atmospheric and Solar-Terrestrial Physics 80 (2012) 296-311.
- Mufti and Shah [2011] S. Mufti, G. N. Shah: Solar-geomagnetic activity influence on Earth’s climate. J. Atmos. Sol. Terr. Phys. 73(13), (2011) 1607–1615.
- Soon [2005] W.-H. Soon: Variable solar irradiance as a plausible agent for multidecadal variations in the Arctic-wide surface air temperature record of the past 130 years. Geophysical Research Letters 32 (2005) L16712.
- Soon and Legates [2013] W.-H. Soon, D. L. Legates: Solar irradiance modulation of Equator-to Pole (Arctic) temperature gradients: Empirical evidence for climate variation on multi-decadal timescales. J. Atmos. Sol. Terr. Phys. 93 (2013) 45-56.
- Humlum et al. [2011] O. Humlum, K. Stordahl, J.-E. Solheim: Identifying natural contributions to late Holocene climate change. Global and Planetary Change 79 (2011) 145-156.
- Bond et al. [2001] G. Bond, B. Kromer, J. Beer, R. Muscheler, M. N. Evans, W. Showers, S. Hoffmann, R. Lotti- Bond, I. Hajdas, G. Bonani: Persistent solar influence on North Atlantic climate during the Holocene. Science 294 (2001) 2130–2136.
- Kerr [2001] R. A. Kerr: A variable sun paces millennial climate. Science 294 (2001) 1431-1433.
- Christiansen and Ljungqvist [2012] Christiansen, B., Ljungqvist, F.C., 2012. The extra-tropical Northern Hemisphere temperature in the last two millennia: reconstructions of low-frequency variability. Clim. Past 8, 765–786.
- Svensmark and Friis-Christensen [2007] H. Svensmark, E. Friis-Christensen. Reply to Lockwood and Fröhlich - The persistent role of the Sun in climate forcing. Danish National Space Center Scientific Report 3/2007. Available at http://www.space.dtu.dk/english/research/reports/scientific_reports
- Scafetta and Willson [2009] N. Scafetta, R. Willson, 2009. ACRIM-gap and Total Solar Irradiance (TSI) trend issue resolved using a surface magnetic flux TSI proxy model. Geophysical Research Letter 36, L05701. DOI: 10.1029/2008GL036307.
- Scafetta and Willson [2014] N. Scafetta, R. C. Willson. ACRIM total solar irradiance satellite composite validation versus TSI proxy models. Astrophysics and Space Science (2014). DOI: 10.1007/s10509-013-1775-9.
- Steinhilber et al. [2012] F. Steinhilber, J. A. Abreu, J. Beer, I. Brunner, M. Christl, H. Fischer, U. Heikkilä, P. W. Kubik, M. Mann, K. G. McCracken, H. Miller, H. Miyahara, H. Oerter, F. Wilhelms: 9,400 years of cosmic radiation and solar activity from ice cores and tree rings. PNAS 109 (16) (2012) 5967–5971.
- Quinn [2010] J. M. Quinn: Global warming. Geophysical counterpoints to the enhanced greenhouse theory. Dorrance Publishing Co., Inc., Pittsburgh, USA (2010).
- IPCC [2013] Intergovernmental Panel on Climate Change (IPCC). Climate Change 2013: The Physical Science Basis: Fifth Assessment Report (2013). Available at http://www.ipcc.ch/
- Wang et al. [2005] Y.-M. Wang, J. L. Lean, N. R. Sheeley Jr. Modeling the sun’s magnetic field and irradiance since 1713. Astrophys. J. 625 (2005) 522–538.
- Shapiro et al. [2011] A. I. Shapiro, W. Schmutz, E. Rozanov, M. Schoell, M. Haberreiter, A. V. Shapiro, S. Nyeki. A new approach to the long-termreconstruction of the solar irradiance leads to large historical solar forcing. Astron. Astrophys. 529 (2011) A67.
- Brohan [2006] Brohan, P., Kennedy, J.J., Harris, I., Tett, S.F.B., Jones, P.D., 2006. Uncertainty estimates in regional and global observed temperature changes: a new dataset from 1850. Journal of Geophysical Research 111, D12106. doi:10.1029/ 2005JD006548.
- Ghil et al. [2002] Ghil, M., Allen, R. M., Dettinger, M. D., Ide, K., Kondrashov, D., Mann, M. E., Robertson, A., Saunders, A., Tian, Y., Varadi, F., Yiou, P., 2002. Advanced spectral methods for climatic time series. Reviews of Geophysics 40, 3.1–3.41 (SSA-MTM tool kit for spectral analysis).
- Press et al. [1997] Press,W. H., Teukolsky, S. A., Vetterling, W. T., and Flannery, B. P.: Numerical Recipes in C, 2nd Edn., Cambridge University Press, 1997.
- Parker et al. [1992] Parker, D.E., T.P. Legg, and C.K. Folland. 1992. A new daily Central England Temperature Series, 1772-1991. Int. J. Clim. 12, 317-342.
- Scafetta [2014] N. Scafetta: The complex planetary synchronization structure of the solar system. Pattern Recognition in Physics 2 (2014) 1-19. DOI: 10.5194/prp-2-1-2014.
- Holm [2014] Holm, S., 2014. On the alleged coherence between the global temperature and the Sun’s movement. J. Atmos. Solar-Terrestr. Phys. 110–111, 23–27.