Deep Chandra Observations of HCG 16 — II. The Development of the Intra-group Medium in a Spiral-Rich Group
Abstract
We use a combination of deep Chandra X-ray observations and radio continuum imaging to investigate the origin and current state of the intra-group medium in the spiral-rich compact group HCG 16. We confirm the presence of a faint (=1.871041), low temperature (0.30 keV) intra-group medium (IGM) extending throughout the ACIS-S3 field of view, with a ridge linking the four original group members and extending to the southeast, as suggested by previous ROSAT and XMM-Newton observations. This ridge contains 6.6109 of hot gas and is at least partly coincident with a large-scale tidal filament, indicating that the IGM in the inner part of the group is highly multi-phase. We present evidence that the group is not yet virialised, and show that gas has probably been transported from the starburst winds of NGC 838 and NGC 839 into the surrounding IGM. Considering the possible origin of the IGM, we argue that material ejected by galactic winds may have played a significant role, contributing 20-40% of the observed hot gas in the system.
Subject headings:
galaxies: groups: individual (HCG 16) — galaxies: individual (NGC 838, NGC 839) — galaxies: clusters: intracluster medium — galaxies: starburst — X-rays: galaxies1. Introduction
The majority of galaxies in the local universe reside in small, gravitationally bound groups (Eke et al., 2004), whose low velocity dispersions (500) and small galaxy separations are conducive to tidal interactions and mergers between group members. X-ray observations have shown that many groups host extended halos of hot gas, but that the existence of a hot intra-group medium (IGM) appears to be linked to the presence of early-type galaxies. X-ray luminous groups are sometimes described as miniature galaxy clusters; their IGM is highly enriched, particularly in the group core, they host significant early-type galaxy populations, are often dominated by a single, centrally-located giant elliptical, and follow morphology-density and morphology-radius relations similar to (but offset from) those seen in clusters (Helsdon & Ponman, 2003). However, they are typically poor in cold gas, with neutral hydrogen restricted to spiral galaxies in the group outskirts (Kilborn et al., 2009).
Conversely, spiral-rich groups are typically poor in hot gas, and consequently X-ray faint. Mulchaey et al. (2003) find that spiral-rich groups tend to be less X-ray luminous than their elliptical-dominated cohorts, and detect none of the twelve spiral-only groups in their ROSAT atlas of 109 systems. Osmond & Ponman (2004) detect only galaxy-scale emission in the ten spiral-only groups in the GEMS sample; the only possible exception, the NGC 3783 group, appears to be biased by the exceptionally luminous Seyfert nucleus of the dominant spiral. However, spiral-rich groups usually contain significant quantities of cold gas in and around their galaxies. Examination of X-ray faint, spiral-rich compact groups has led to the suggestion of an evolutionary sequence, with galaxy interactions stripping the from spiral galaxies to form intergalactic clouds and filaments or even a diffuse cold IGM (Verdes-Montenegro et al., 2001; Johnson et al., 2007; Konstantopoulos et al., 2010). The redistribution of the component is accompanied by the transformation of some member galaxies from late to early-type, and in some cases by star formation.
While the role of tidal interactions in driving the evolution of the galaxy population and component is clear, the origin of the hot IGM and its link to the development of the group is not. Infall and gravitational shock heating is believed to be the primary source of the hot gas which makes up the dominant baryonic component of massive clusters, and the same mechanism probably provides most of the IGM in the most massive groups. However, the connection between galaxy evolution and the presence of a hot IGM in low mass groups suggests a link. One possibility is that star-formation-driven galactic winds could contribute to the formation of the IGM. Another is that intergalactic could be shock heated by collisions within the group. The latter process is observed in one system, Stephan’s Quintet (HCG 92), in which an infalling spiral galaxy has collided with a tidal filament, heating it to a temperature of 0.6 keV (van der Hulst & Rots, 1981; Sulentic et al., 2001; Trinchieri et al., 2003; O’Sullivan et al., 2009).
Understanding the development of the hot IGM is clearly central to any study of galaxy evolution in groups, or of structure formation involving groups. However, relatively few suitable systems have been examined in detail, and their X-ray faintness makes such examination challenging. Only two groups at an earlier evolutionary stage than Stephan’s Quintet have been shown to possess a hot IGM using modern high-spatial-resolution X-ray instruments. Trinchieri et al. (2008) confirmed the presence of diffuse hot gas in SCG0018-4854, a spiral-only southern compact group of four galaxies, but the short XMM observation provided only limited information on the state and origin of the IGM and its relation to the galaxy population. The other example is the well known spiral-dominated group HCG 16, which we have chosen to study in this paper. HCG 16 appears to contain significant quantities of diffuse hot and cold gas (), and its galaxy members include starburst systems with outflowing winds which may be enriching their surroundings. The group therefore appears to be at the start of the process of galaxy merger, hot gas build-up and enrichment which will eventually produce an X-ray bright, metal-rich IGM and an elliptical-dominated group.
In order to examine the process of IGM development in HCG 16, we have obtained deep Chandra X-ray observations of the group, as well as new Giant Metrewave Radio Telescope (GMRT) 610 MHz radio data. In this paper we combining these observations with archival Chandra and Very Large Array (VLA) 1.4 GHz data, with the goal of determining the physical properties and origin of the diffuse gas component, and its relationship to the galaxy population. We describe the observations, data reduction and analysis techniques in detail in O’Sullivan et al. (2014, hereafter Paper I). All five of the major galaxies in the group show evidence of star formation and/or nuclear activity, with two of the galaxies hosting galactic superwinds. A full discussion of the properties of the galaxies and their point source populations can be found in Paper I, and we summarise the results relevant to the current paper in Section 4.1.
Throughout this paper we adopt a redshift of =0.0132 for the group (Hickson et al., 1992) and a Galactic hydrogen column density of =2.561020 for the four original group member galaxies and the surrounding diffuse emission (taken from the Leiden/Argentine/Bonn survey, Kalberla et al., 2005). For NGC 848 we adopt a hydrogen column of =2.751020. All fluxes and luminosities are corrected for Galactic absorption. A redshift-independent distance measurement is available for one of the five major galaxies, a Tully-Fisher distance of 56.5 Mpc for NGC 848 (Theureau et al., 2007). This is consistent, within errors, with redshift-based estimates for all five of the galaxies, correcting for infall toward the Virgo cluster, great attractor and Shapley Supercluster, for a cosmology with =70. We therefore adopt this distance estimate for the group as a whole, which gives an angular scale of 1′′=273 pc.
2. HCG 16
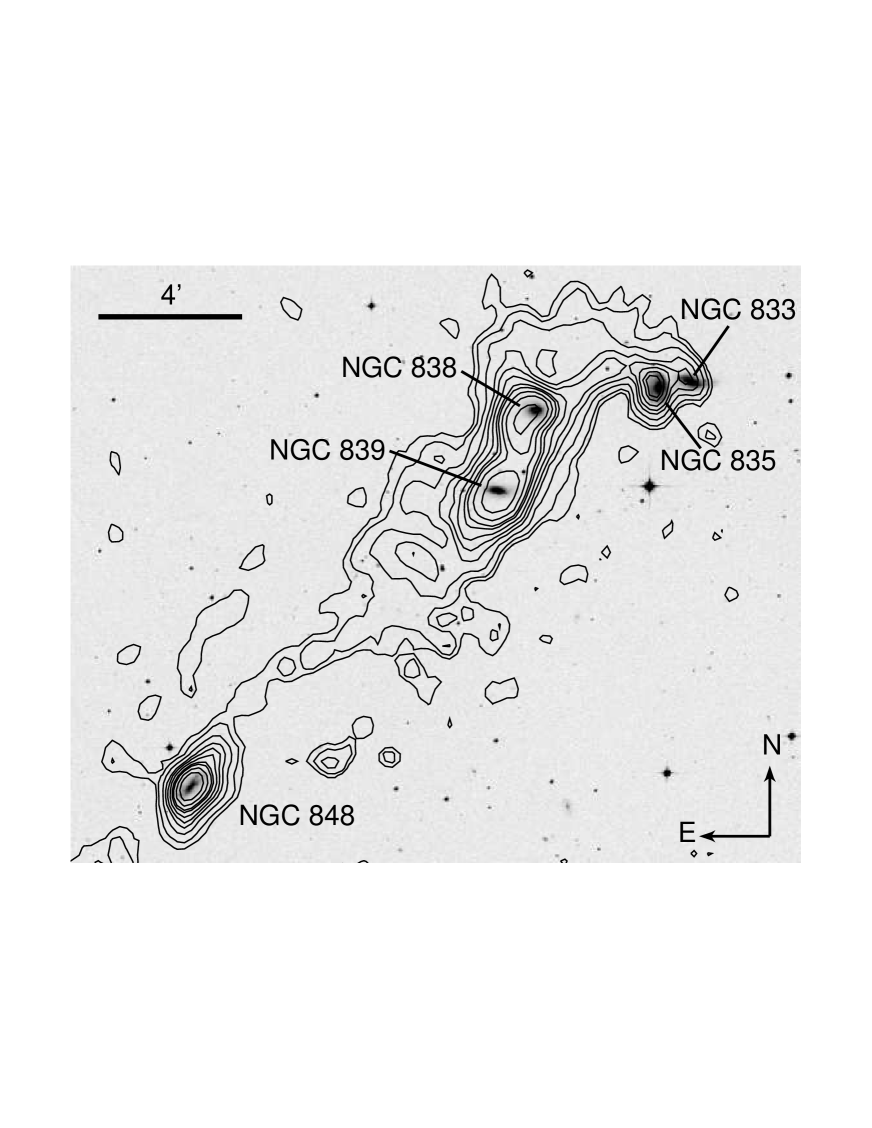
HCG 16, also known as Arp 318, was originally identified (Hickson, 1982) as a compact group of four spiral galaxies, NGC 833 (HCG 16B), NGC 835 (A), NGC 838 (C) and NGC 839 (D), with later studies identifying a fifth large spiral galaxy member (NGC 848) and a surrounding halo of dwarf galaxies (e.g., Ribeiro et al., 1998). Figure 1 includes a Digitized Sky Survey image showing the relative positions of the group members. All five major galaxies host AGN and/or starbursts (e.g., Martínez et al., 2010; de Carvalho & Coziol, 1999; Contini et al., 1998), and tidal structures suggest an an ongoing or recent interaction between NGC 833 and NGC 835 (Konstantopoulos et al., 2013).
Neutral hydrogen mapping of the group revealed a 20′ long complex filament of cold gas surrounding the four original members of the group and linking them to NGC 848 (Verdes-Montenegro et al., 2001), almost certainly as the result of tidal interactions between group members. The total mass of in the group is 2.631010, and Verdes-Montenegro et al. estimate that the group is 30% -deficient. The four original member galaxies are 50-80% deficient, while NGC 848 is only 7% deficient. This suggests that the majority of the intergalactic originated in the four main galaxies, perhaps being transported out into the IGM by interactions among them, and then drawn into its current morphology by a close passage of NGC 848. Borthakur et al. (2010) show that the velocity distribution covers the range 3650-4100, confirming its association with the major member galaxies.
ROSAT studies of HCG 16 in the X-ray band were able to separate emission from the galaxies and diffuse inter-galactic gas, finding a gas temperature 0.3 keV and tracing emission out to 8′ (Ponman et al., 1996; Dos Santos & Mamon, 1999). ROSAT imaging found the gas distribution to be irregular, with the brightest emission around the four original member galaxies and to the southeast of NGC 839, with fainter extension west or southwest of NGC 833 (Dos Santos & Mamon, 1999).
First light data from XMM-Newton were used to investigate further the gas distribution, but this was hampered by a combination of uncertain calibration and scattered light from a bright background source close to the edge of the field of view. Nonetheless Belsole et al. (2003) reported a highly elliptical diffuse emission component surrounding the four main galaxies, with a temperature of 0.5 keV and abundance 0.07. A short (12.5 ks) Chandra observation in cycle 1 provided no additional evidence of group-scale emission (Jeltema et al., 2008).
Optical spectroscopic studies of the starburst galaxies NGC 838 and NGC 839 have provided a detailed characterization of their stellar structures and outflowing galactic winds. In NGC 839 the wind has formed a biconical polar outflow (Rich et al., 2010), while in NGC 838 wind outflows have inflated bubbles north and south of the galaxy, above and below the galactic disk (Vogt et al., 2013). These bubbles are likely confined by the surrounding IGM and , although there is some indication that material is leaking from the southern bubble. Examination of optical spectra of the stellar populations suggests that star formation peaked in NGC 838 and NGC 839 500 and 400 Myr ago respectively (Vogt et al., 2013; Rich et al., 2010) and still continues in the core of each galaxy. Our own stellar population modelling confirms that star formation is ongoing in NGC 838, but shows that star formation in AGN-dominated NGC 833 has been minimal (3) over the past few hundred Myr.
3. Observations and Data Reduction
Paper I describes our observations and reduction techniques in detail. We used the five available Chandra observations of HCG 16, all of which were made with the ACIS-S3 CCD at the focal point. Three of the observations (ObsIDs 15181 (catalog ADS/Sa.CXO#obs/15181), 15666 (catalog ADS/Sa.CXO#obs/15666) and 15667 (catalog ADS/Sa.CXO#obs/15667)) totaling 75.7 ks, were made in 2013 July, using the full CCD and the same roll angle. The earliest observation, ObsID 923 (catalog ADS/Sa.CXO#obs/923), was made in 2000 Nov, for 12.5 ks. In 2008 Nov (ObsID 10394 (catalog ADS/Sa.CXO#obs/10394)) the group was observed in 1/2 subarray for 13.8 ks. ObsID 923 and the 2013 observations all cover the four original member galaxies, but ObsID 10394 only covers NGC 835, NGC 838 and part of NGC 833.
All five pointings were reduced using CIAO 4.6.1 (Fruscione et al., 2006) and CALDB 4.5.9 following techniques similar to those described in O’Sullivan et al. (2007) and the Chandra analysis threads111http://asc.harvard.edu/ciao/threads/index.html. Point sources were identified using the ciao task wavdetect, and excluded. Spectra were extracted from each dataset using the specextract task. Abundances were measured relative to the abundance ratios of Grevesse & Sauval (1998). 1 errors are reported for all fitted values.
Reduction and analysis of the GMRT and VLA data was performed in the NRAO Astronomical Image Processing System (aips) package following the standard procedure (Fourier transform, clean and restore). Phase-only self-calibration was applied to remove residual phase variations and improve the quality of the images. The final VLA (GMRT) image has an angular resolution of 2518.1′′ (5.65.4′′) and an rms noise level (1) of 0.2 (0.06) mJy beam-1.
4. Results
We initially examined X-ray images of the group to determine the basic structures associated with the galaxies and whether any large scale emission was visible. Heavily smoothed or binned images showed evidence of emission between the four galaxies on the ACIS-S3 CCD, located in a ridge connecting the galaxies. Brighter diffuse emission was also visible in the disks of several of the galaxies, between NGC 833 and NGC 835, and in regions north and south of the disks of NGC 838 and NGC 839.
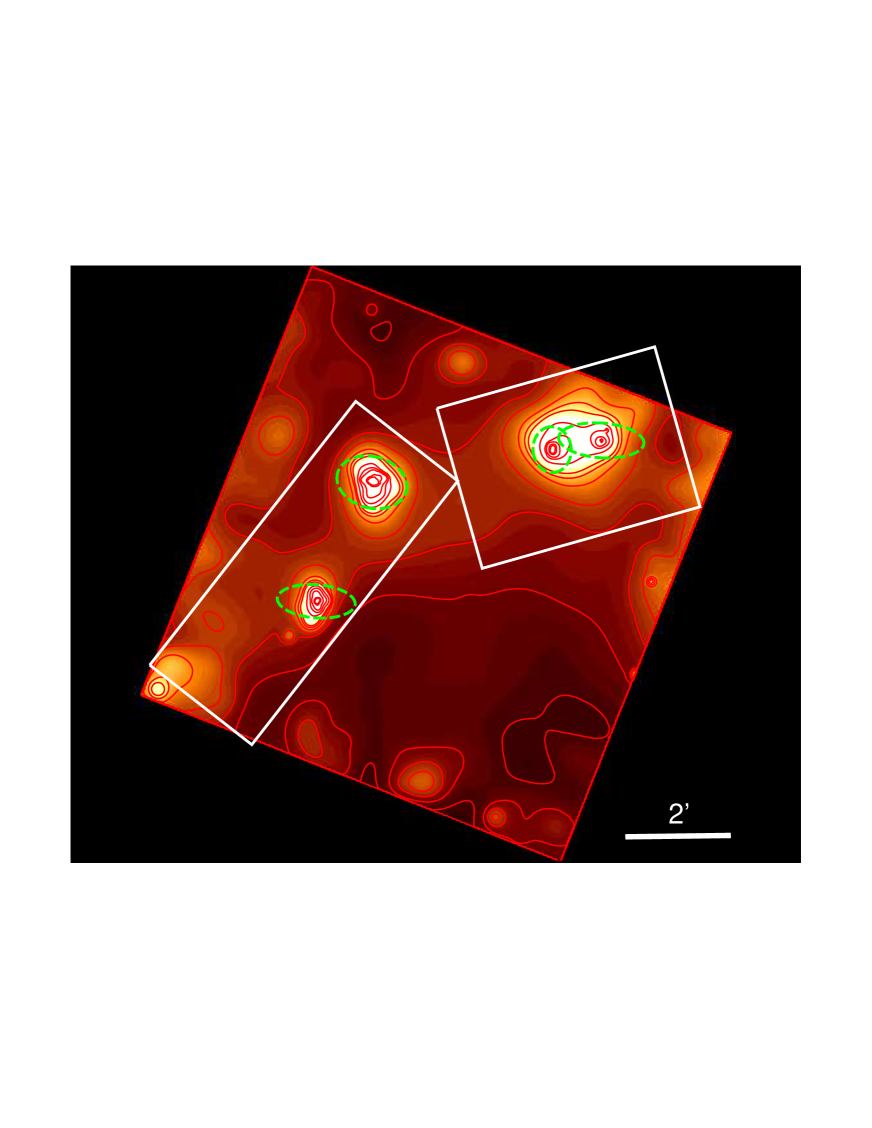
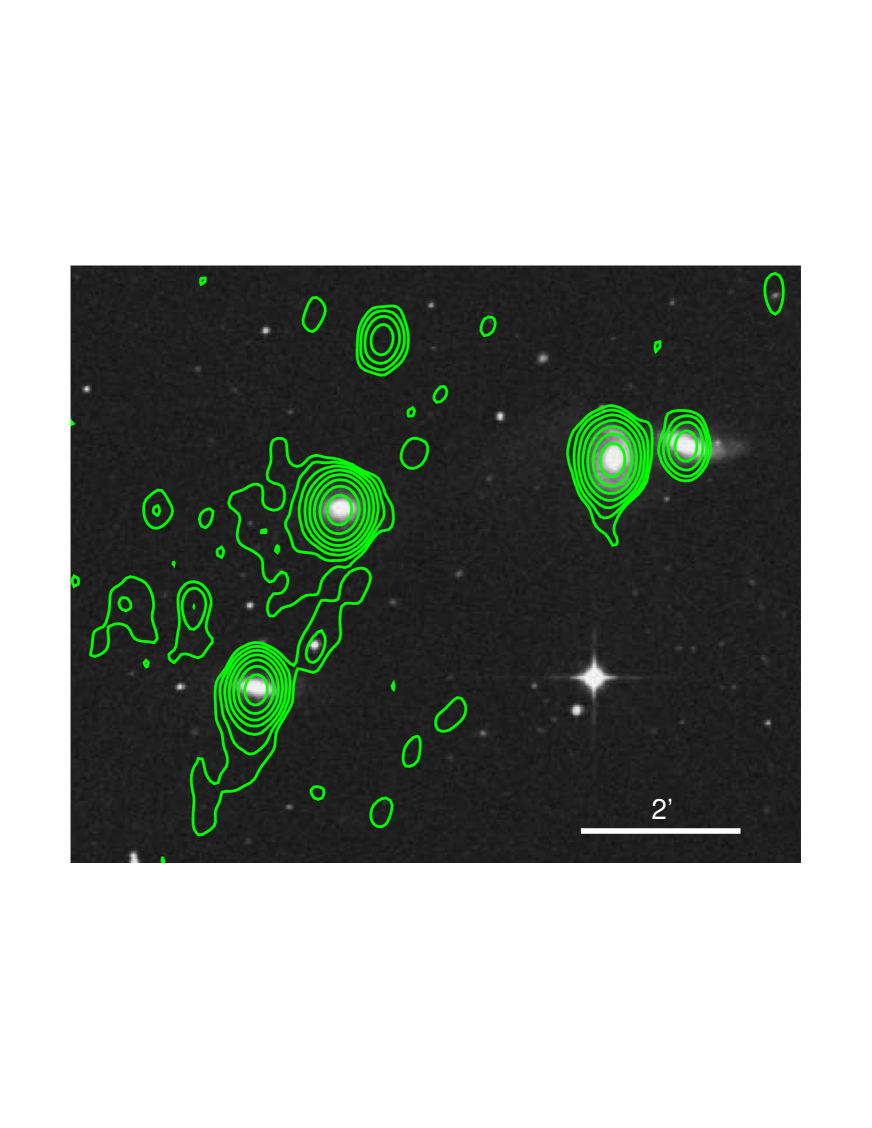
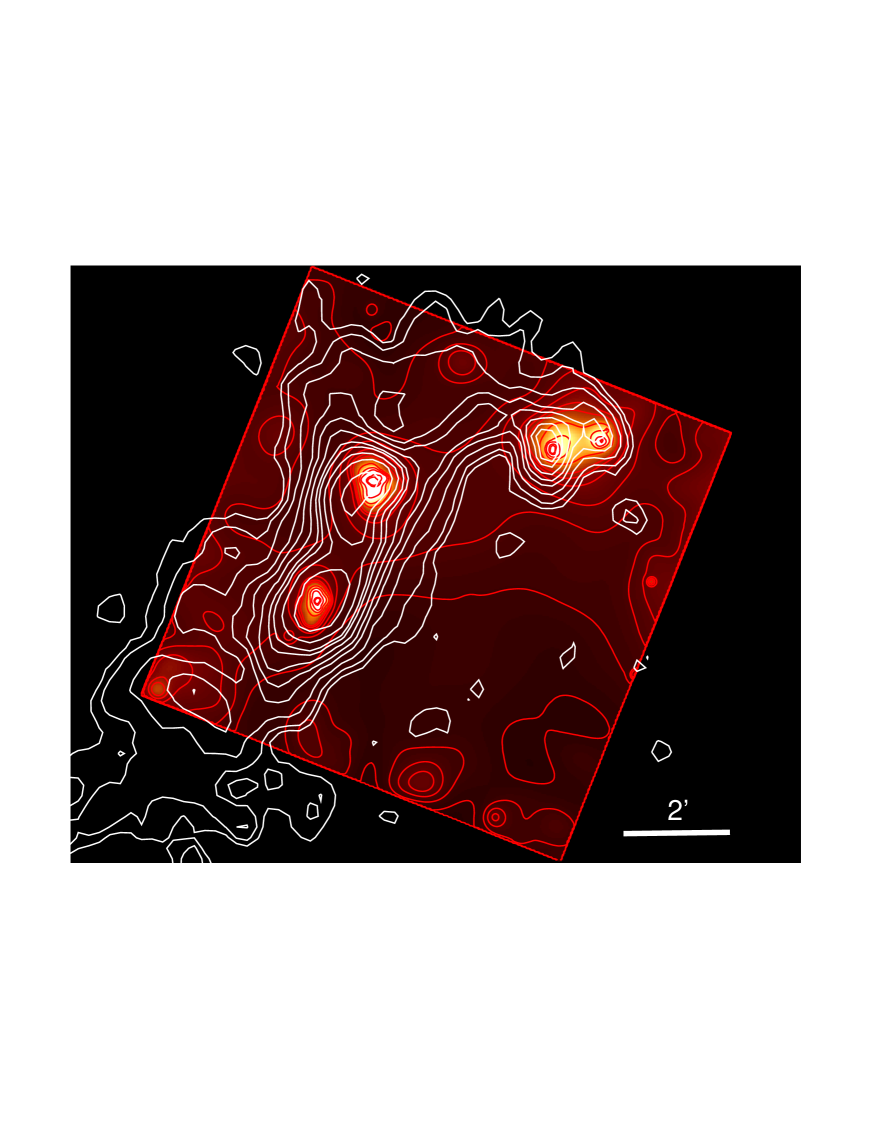
Figure 1 shows the core of the group, imaged in the optical, , 1.4 GHz radio continuum, and soft (0.5-2 keV) X-ray bands. The X-ray image has been processed to remove point sources outside the galaxy cores and refill the resulting holes using the dmfilth tool. The image has then been adaptively smoothed using the csmooth task with signal-to-noise limits of 3-5, and exposure corrected using a 0.91 keV exposure map smoothed to the same scales. The energy of the exposure map was chosen to match the modal event energy in the observations.
The ridge of faint diffuse emission linking the galaxies is clear, and appears to extend past NGC 839 to the southeast, while surface brightness declines to the southwest and northeast. The apparent brightness of features close to the edges of the field may be affected by the exposure correction and adaptive smoothing processes, and the surface brightness of the diffuse emission is low. However, as mentioned above, heavily binned images show the same basic ridge structure.
Comparison with the map shows that the hot and cold gas structures are similar, with the filament overlapping the X-ray ridge over most of its length. This is most obvious around NGC 838 and NGC839, the brightest diffuse X-ray sources in the group, which appear to be embedded in some of the highest density gas. The extension of the X-ray ridge southeast of NGC 839 also overlaps the section of the filament extending toward NGC 848. The and X-ray emission agree less well between NGC838 and NGC 835, with the X-ray ridge directly linking the two galaxies, while the filament curls to the north through a region of lower X-ray surface brightness.
4.1. Radio and X-ray imaging of the galactic superwinds
We examined the galactic superwinds of NGC 838 and NGC 839 in detail in Paper I, but as their outflows are possible contributors of hot gas to the intra-group medium, we summarise the relevant results below, and then discuss the wind morphology in more detail.
Our spectroscopic analysis of the X-ray and radio properties of the galaxies confirms that NGC 833 and NGC 835 are dominated by emission from absorbed AGN, while NGC 838 and NGC 839 are primarily starburst systems, with only minimal AGN contribution to their X-ray luminosity. We estimate the star-formation rate in NGC 838 (NGC 839) to be 7-17 (8-20), with the lower, infra-red derived values probably more representative of the current rate. The galactic winds have temperatures 0.8 keV, with some evidence of a temperature decline in the outer part of the southern bubble of NGC 838. We estimate the rate of outflow in the winds to be 2.5 in NGC 839 and 17 in NGC 838. However, since the NGC 838 wind appears to be largely confined, it is unclear how much of this material escapes into the surrounding IGM.
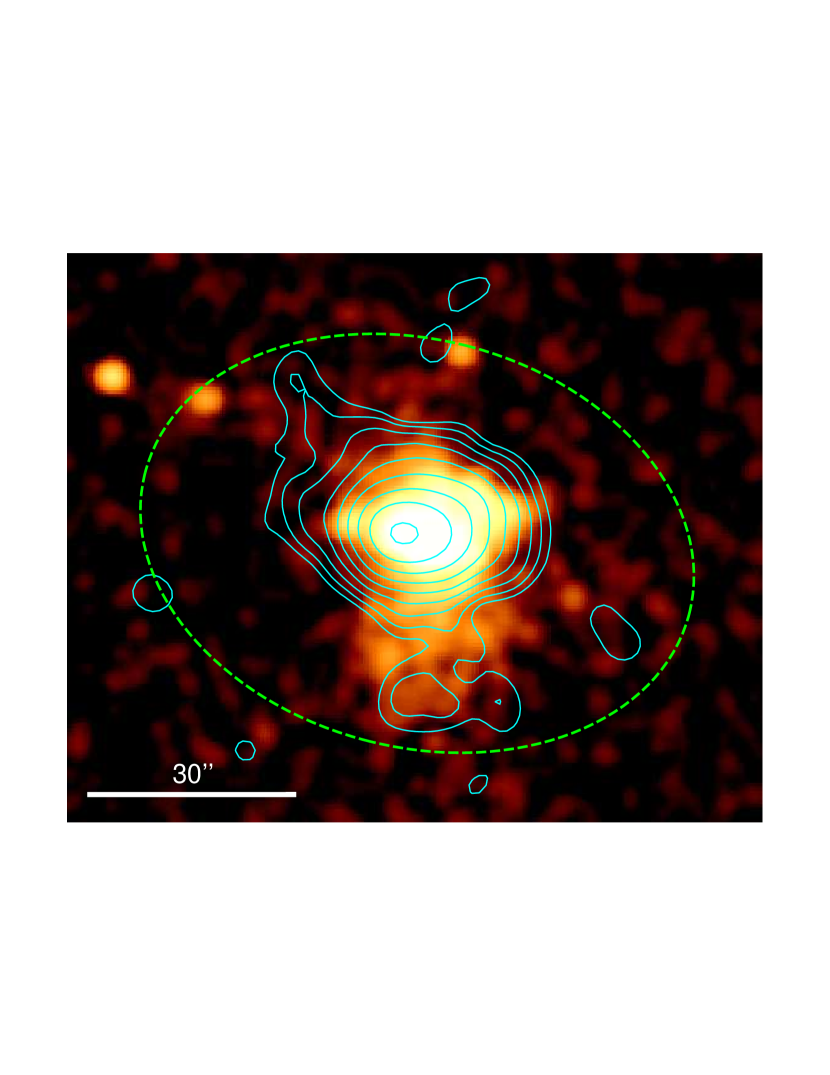
Figures 2 and 3 show X-ray images of the two galaxies. In both cases, a central area of X-ray emission, corresponding to the galaxy core, is visible. In the case of NGC 838 this is extended to the east and west in an ellipse. This includes emission from the northern wind bubble, and as the northern side of the galaxy disk is tilted toward the viewer, the galaxy centre is partly screened by this bubble and by gas and dust in the disk. More diffuse emission is clearly visible to the south, extending 25′′ with a morphology suggestive of a bubble. Comparison with the H imaging of the galaxy wind by Vogt et al. (2013) confirms that the X-ray and optical morphology is similar, and that the southern bubble is viewed through the disk of the galaxy. Although the 610 MHz emission is dominated by the galaxy core, it is clearly extended to the south, coincident with the X-ray/optical bubble. Fainter diffuse X-ray and radio emission is visible north of the galaxy core, although interestingly both bands suggest that material outside the northern bubble is extended toward the northeast, rather than continuing the north-south axis of the bubbles.
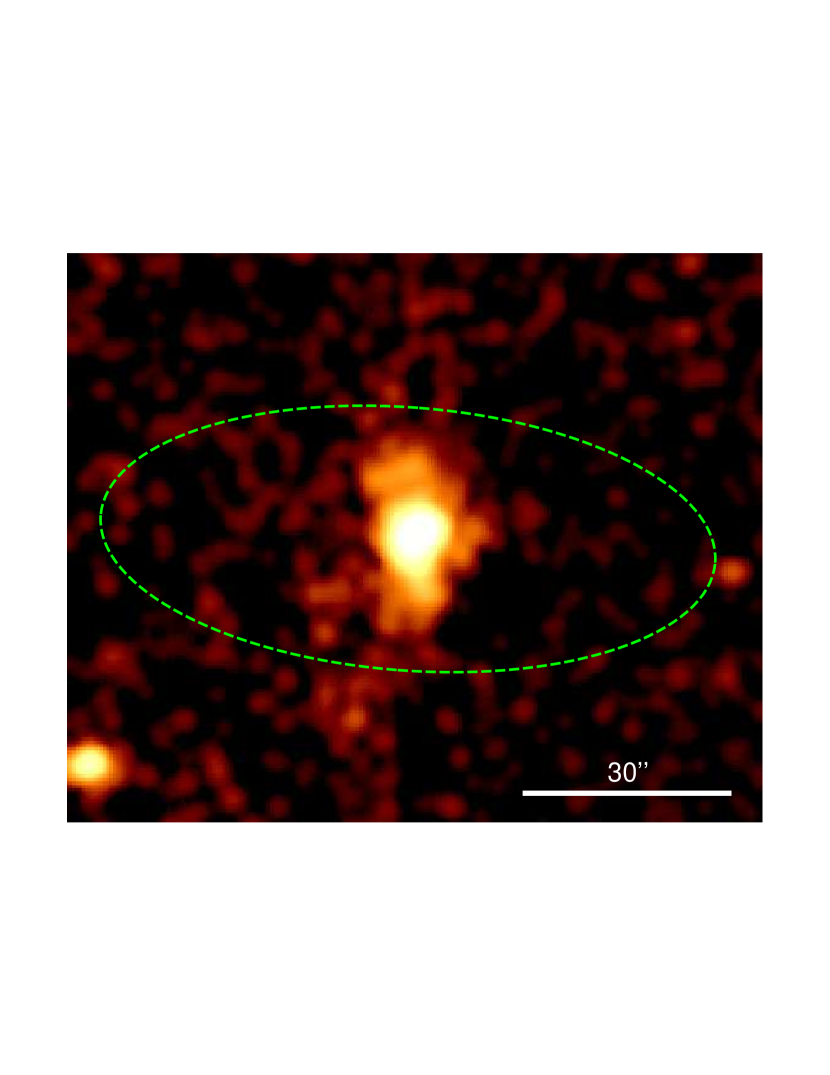
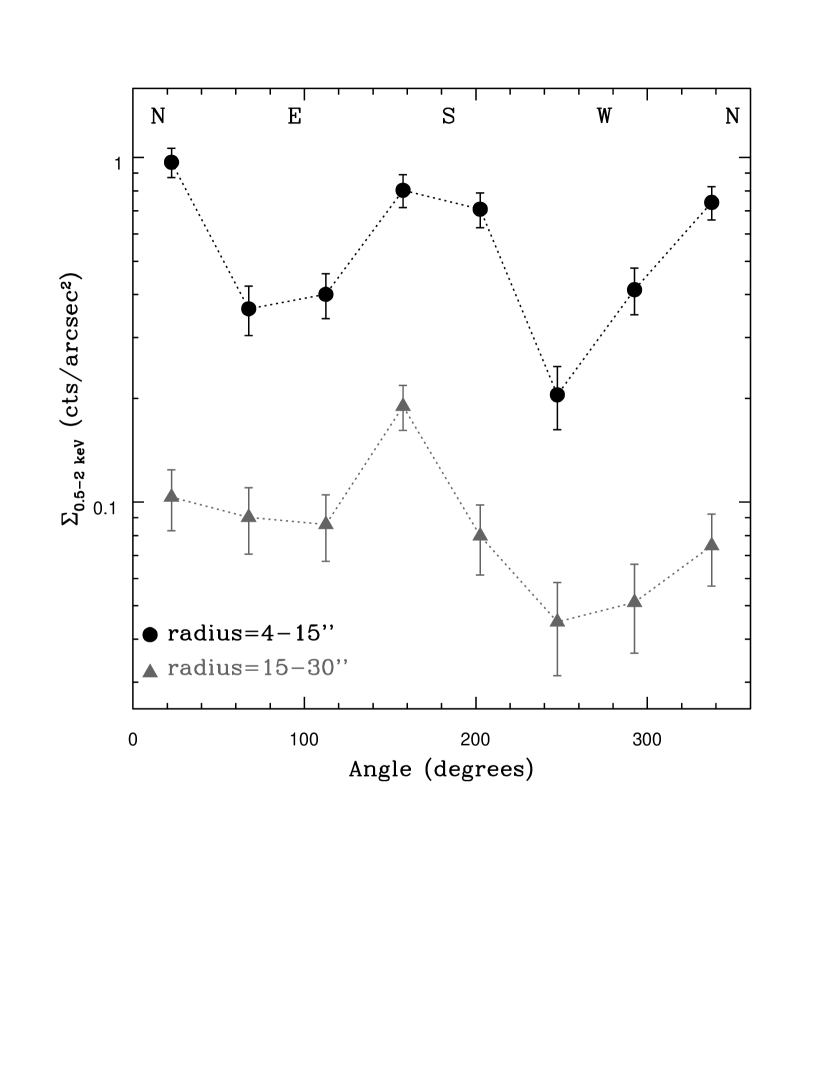
NGC 839 is a point source at 610 MHz, dominated by the emission from its dense star-forming core. This is also bright in the X-ray band, but it is clear that gas emission extends north and south of the core, with a morphology comparable to the biconical outflow observed in H (Rich et al., 2010). However, there is also an indication of fainter X-ray emission extending to the southeast. To test whether this apparent extension is real, we measure the number of 0.5-2 keV counts in two annuli, one with radius 4-15′′ (1-4 kpc) corresponding to the brighter conical wind regions, one with radius 15-30′′ (4-8 kpc) corresponding to the possible fainter emission. We break each annulus into 45∘ sectors, starting from north and proceeding anti-clockwise. Figure 4 shows the resulting azimuthal surface brightness measurements. It is clear that in the inner annulus, emission is brightest in the 90∘ sectors centred on north and south, and faintest in the west-southwest. In the outer annulus most of the sectors have comparable surface brightness (though the western sectors are marginally fainter) but the south-southeast sector is a factor 2 brighter than its neighbours (at 3 significance), confirming our identification of excess emission in this direction in the image. Since the structure appears to be diffuse, it seems likely that it is a more extended component of the galactic wind.
The 1.4 GHz radio continuum map (Figure 1) shows unresolved sources at the positions of NGC 838 and NGC 839, with low-surface brightness diffuse emission to their south and east, extending 75′′ (20 kpc) from NGC 838 and 110′′ (30 kpc) south of NGC 839. There is no obvious source for this emission except relativistic plasma ejected by the galactic superwinds of these two starburst galaxies, or potentially by their AGN. Combined with the the X-ray and 610 MHz imaging indicating that the winds bend to the east on scales of a few kpc, this diffuse emission suggests that wind material transported out of the galaxies is either driven eastward by the motion of the surrounding or IGM, or is left behind as the galaxies move westward. We will return to the question of interaction between the winds and the surrounding environment in Section 5.1.
4.2. Group-scale diffuse X-ray emission
To investigate the properties of the diffuse intergalactic emission, we first exclude regions around the galaxies to avoid contamination. For NGC 838 and NGC 839 we used 25′′ radius circular regions, based on a curve-of-growth analysis designed to ensure that 95% of the 0.5-2 keV flux from the galaxies is excluded. Since NGC 833 and NGC 835 are interacting, with much of their gas content between the two galaxies, and some emission from a tidal arm extending east from NGC 835, we used a polygonal region approximating the extent of the stellar component of the galaxies. These regions are described in more detail in Paper I. Having excluded the galaxies, we divided the remainder of the ACIS-S3 field of view into several large regions, based on the adaptively smoothed contours. The upper right panel of figure 1 shows the rectangular North and South Ridge regions. We defined the remainder of the S3 field of view as the Outer region.
The emission in all these regions is spectrally soft and extremely faint, and probably fills the field of view. Since blank-sky fields scaled to match the particle flux of our data may over- or under-subtract the soft galactic foreground emission, we chose to model the background for these regions following a method similar to that used by Snowden et al. (2004) for XMM data. We fit the regions simultaneously to provide the maximum constraint on the background model. Since the observations prior to 2013 are relatively short and have different fields of view, we only use spectra from ObsIDs 15181, 15666 and 15667, so as to simplify the model and avoid any uncertainties associated with changes in effective sensitivity over the life of the ACIS instrument.
| Region | Background | kT | Abund. | Surface Brightness | red. /d.o.f. | |
|---|---|---|---|---|---|---|
| (keV) | () | (1038) | (1038 arcmin-2) | |||
| North Ridge | Model | 0.270.03 | 0.05 | 94.72 | 8.63 | 1.31/2584† |
| Outer | 0.240.03 | 0.3∗ | 58.061.15 | 5.270.12 | 1.07/253 | |
| Outer | 0.24 | 0.15 | 53.86 | 2.72 | 1.08/252 | |
| South Ridge | Model | 0.34 | 0.05 | 190.21 | 13.18 | 1.31/2584† |
| Outer | 0.45 | 0.3∗ | 77.541.15 | 5.350.12 | 1.11/345 | |
| Outer | 0.50 | 0.04 | 92.81±1.15 | 6.450.12 | 1.10/344 | |
| Outer | Model | 0.30 | 0.05 | 301.36 | 6.38 | 1.31/2584† |
Note. — ∗ Parameter fixed during fitting.
† Fit statistic for simultaneous fit to all regions including background model.
Our spectral model consists of several components: 1) A broken power law representing high-energy particles, which is convolved with the instrument Response Matrix File (RMF) but not the Auxiliary Response File (ARF) since the particles are to first order unaffected by the X-ray mirrors; 2) Gaussians representing fluorescent emission lines within the detector, the Si K and Au M in the case of the S3 CCD; 3) A powerlaw with =1.46 and initial normalization 8.8810-7 per square arcminute, representing the cosmic hard X–ray background; 4) Three thermal models representing emission from the local hot bubble and the Galactic halo, two with temperature 0.1 keV (one with Galactic absorption and one without) and the third with an initial temperature of 0.25 keV; 5) A source component consisting of an APEC thermal plasma model at the systemic redshift (=0.0132) with fixed Galactic absorption. The normalisations of components 1, 2 and 5 are allowed to fit independently for each region, but normalisations for components 3 and 4 are linked across the regions, scaling for area.
In addition to the Chandra spectra we also fit components 3 and 4 (the X-ray foreground and background emission) to a ROSAT All-Sky Survey spectrum extracted from an annulus between 0.5-0.75∘ from the group centroid (490-740 kpc at our adopted distance). This provides additional constraints on the soft emission, particularly useful given the low temperature of the group emission. Fits are carried out in the 0.5-10 keV band, the inclusion of 7-10 keV emission helping to constrain the particle background component in the Chandra data.
Table 1 shows our results. Our fits suggest the presence of weak thermal emission throughout the S3 field of view. For the set of three regions (North and South Ridge plus Outer) we experimented with thawing the normalization of the cosmic hard background component and the temperature of the 0.25 keV Galactic soft foreground. The former falls 22% below its initial value, which we consider acceptable as we have excluded a number of bright background point sources. The latter is poorly constrained when fitted, and we therefore fix it at 0.25 keV in our final fit, which has reduced =1.31 for 2584 degrees of freedom.
As a test of the reliability of the background modelling approach, we also fitted the spectra of the north and south ridge regions using the spectrum of the outer region as the background. We fit each region with a simple absorbed APEC model, and tried fits with abundance free to vary or fixed at 0.3. The results are listed in Table 1. In the north ridge the temperatures agree within the 1 errors with our background modelling fit. The agreement in the south ridge is poorer, but still at the 2 level. As expected, the fluxes are systematically lower than those found from the background modelling approach, suggesting that the background is over-subtracted owing to the presence of source flux in the outer region. For the north ridge the abundance is poorly constrained when fitted, owing to the small number of net counts in the spectrum after background subtraction. In the south ridge abundance is constrained to 0.01-0.09, but fixing it at 0.3 only makes the fit slightly poorer. In general, these fits confirm the accuracy of our background modelling approach.
To search for evidence of any more extended emission, we extracted spectra from the S2 CCD for all three 2013 observations. The S4 CCD was not active during the 2013 observations. S2 covers the area immediately south-southeast of the group, but it is a front illuminated CCD and therefore less sensitive to spectrally soft emission than S3. After examining a heavily smoothed image, we elected to use a 5.88′ region excluding strips of the CCD close to the edge of the ACIS-S array. These regions include most of the point sources most strongly blurred by the point spread function (PSF), and could be affected by any imperfections in the calibration of absorption by the contaminant which has built up on the ACIS optical filters.
We excluded point sources and used the same fitting approach described above, with additional Gaussian components to fit the Ni K and Au L fluorescent emission lines which are visible on this CCD. We found that the background model did a good job of describing the spectrum, with no residual features indicative of source emission. When we added a thermal model (with abundance fixed at 0.3) to represent diffuse IGM emission, we found that with temperature free to vary, the best fit had kT0.11 (1 limit) and an extremely poorly constrained normalization. Fixing kT at 0.3 keV we found that the normalization was consistent with zero, with a 1 upper limit on surface brightness of 1.361038 arcmin-2. These are very weak constraints, and would not rule out emission consistent with the extended IGM detected in the “Outer” region on S3. They do however suggest that the bright ridge seen around the galaxies does not extend any significant distance into the region covered by S2.
5. Discussion
Smoothed images of the group show extended low surface-brightness emission linking the four main galaxies and probably extending southeast beyond NGC 839. Our spectral fitting suggests that this gas has a low abundance and temperature 0.3 keV, in agreement with previous ROSAT observations (Ponman et al., 1996; Dos Santos & Mamon, 1999). This temperature is somewhat lower than that reported from XMM-Newton (Belsole et al., 2003) except in the south ridge, where the two are comparable within errors, but this is unsurprising given the uncertain calibration of that dataset. Our low abundance of Z=0.05 agrees well with the ROSAT and XMM-Newton measurements (Dos Santos & Mamon, 1999; Belsole et al., 2003).
Our Chandra observations seem to agree better with the ROSAT than XMM-Newton in terms of the morphology of the diffuse gas. Dos Santos & Mamon (1999) found the diffuse emission to be clumpy and filamentary, while Belsole et al. (2003) were able to model the diffuse emission as a smooth, if highly elliptical, -model. Belsole et al. argued that the superior collecting area and smaller PSF of XMM allowed them to better resolve and excise point sources, and that part of the clumpiness of the ROSAT image arose from point source contamination. The specific example they raised, the C4 region identified by Dos Santos & Mamon southwest of NGC 833, is outside the Chandra field of view, so a direct comparison is not possible. However, we find that the distribution of diffuse emission in the S3 field of view is not consistent with a -model. Even if extreme ellipticities are allowed, the model overestimates the flux in the region between NGC 835 and NGC 838, while underestimating the flux at the ends of the ridge, particularly in the southeast corner of the field. The curve of the ridge and the lack of a clear decline in surface brightness southeast of NGC 839 both suggest that the gas distribution is not a simple ellipsoid. The disagreement with the Belsole et al. model is perhaps unsurprising, since imaging analysis of the relatively shallow first light XMM data presented a number of difficulties, including high electronic noise, the uncertain calibration of the EPIC-MOS cameras and the need to exclude the then-uncalibrated EPIC-pn, scattered light from bright sources in the field, and the difficulty of modelling the various components of the background. We are fortunate in having deep observations from a mature, well-calibrated instrument with superb spatial resolution.
5.1. Physical properties of the hot intra-group medium
We can estimate the properties of the gas in the northern and southern parts of the ridge from the results of our spectral fits, assuming a cylindrical geometry. We approximate the north ridge as a cylinder of length 4.3′ (70.4 kpc) and radius 1.6′ (25.9 kpc), and for the south ridge use a length of 6.35′ (104 kpc) and radius 1.2′ (20.1 kpc). Based on the normalization of our background modelling fits to the diffuse emission, we find that the electron number density of the diffuse gas is 1.1610-3 and 1.1610-3 for the north and south ridge regions respectively, neglecting any uncertainties in volume. The bolometric luminosities for the two regions are =1.681040 (north ridge) and =3.081040 (south). The gas pressure in these regions is 5-6.510-13 dyne cm-2 (equivalent to ), entropy is 25-30 keV and the isobaric cooling times are 7-10 Gyr. While the low gas entropy is comparable to that found in the cool cores of relaxed, X-ray bright groups (Sun et al., 2009), the cooling times are long, suggesting that radiative cooling will probably play only a minor role in the future development of the gas.
The mass of gas in the two regions, excluding the denser material in and around the galaxies, is 3.5109 for the north ridge and 3.1109 for the south ridge. This is a significant mass of gas, comparable to the overall deficiency estimated for the group, 1010 (Verdes-Montenegro et al., 2001). However, the spectral fits show that IGM emission extends outside these regions, and probably outside the field of view. Estimating the total gas mass in the system requires a model of surface brightness. Since a 2-dimensional -model is a poor fit to the diffuse emission, we modelled the 1-dimensional surface-brightness profile across the ridge. We measured the 0.5-2 keV surface brightness using 20600′′ boxes aligned at an angle of 30∘ (measured anti-clockwise from west) with their long axes along the ridge. Again, the regions used to extract spectra for the galaxies were excluded, as were point sources outside the galaxies.The resulting profile extend from the southwest (lower right) corner of the S3 CCD to the NE (upper right) corner, and is shown in Figure 5.

We modelled the exposure corrected profile with a constant background component plus a -model. The best-fitting model is extremely flat, with core radius =12.03′′ (3.28 kpc) and =0.181. This is probably unphysical; the 1 upper limit on is more comparable to other cool groups (e.g., Mulchaey et al., 2003). We therefore emphasize that, while we have used this model to estimate the gas mass and luminosity of the group at large radius, the results cannot be considered as reliable measurements.
To determine how far to extrapolate this model, we must make some assumptions about the structure of the gas, based on its likely origin. If the gas is a virialized IGM, bound within the gravitational well of the group, we can estimate a typical scale size for a system of this temperature from measured scaling relations. We use the mass-temperature relation of Sun et al. (2009), which was derived from a collection of groups and clusters observed with Chandra.
For a group with kT=0.3 keV we estimate that M500=4.01012and =240 kpc (14.6′). Taking a mean radius of 80′′ for the two cylinders used to model the north and south ridges, we find that extrapolating to 14.6′ would increase the gas mass by a factor 33.9 for =0.181 or a factor 6.2 if is at the 1 upper limit value of 0.45. These values assume a cylindrical geometry with length 10′, so an additional factor 2 should be added if the IGM is ellipsoidal. This gives a hot gas mass of (R)0.8-4.51011.
If the hot gas is associated with, and has an extent similar to, the filament that links the group galaxies, it is likely to be considerably smaller, with a minor axis radius of only 4-5′ and a major axis 20′. In this case we expect an extrapolation factor of 8-14, for a total hot gas mass of 5.2-9.41010, 2-3.5 times the total mass in the system.
A similar process of extrapolation is required to estimate the total luminosity of the IGM. Assuming emission to be proportional to density squared (i.e., neglecting any temperature or abundance variation) we find that the uncertainties in the surface brightness model lead to very large uncertainties in the total luminosity for the case of an ellipsoidal virialized IGM, (R¡)1.1-8.61041. For a filamentary distribution similar to that of the , 2.5-6.11041. The lower end of these estimates are comparable to the measured luminosity in the S3 field of view without any extrapolation, =1.871041.
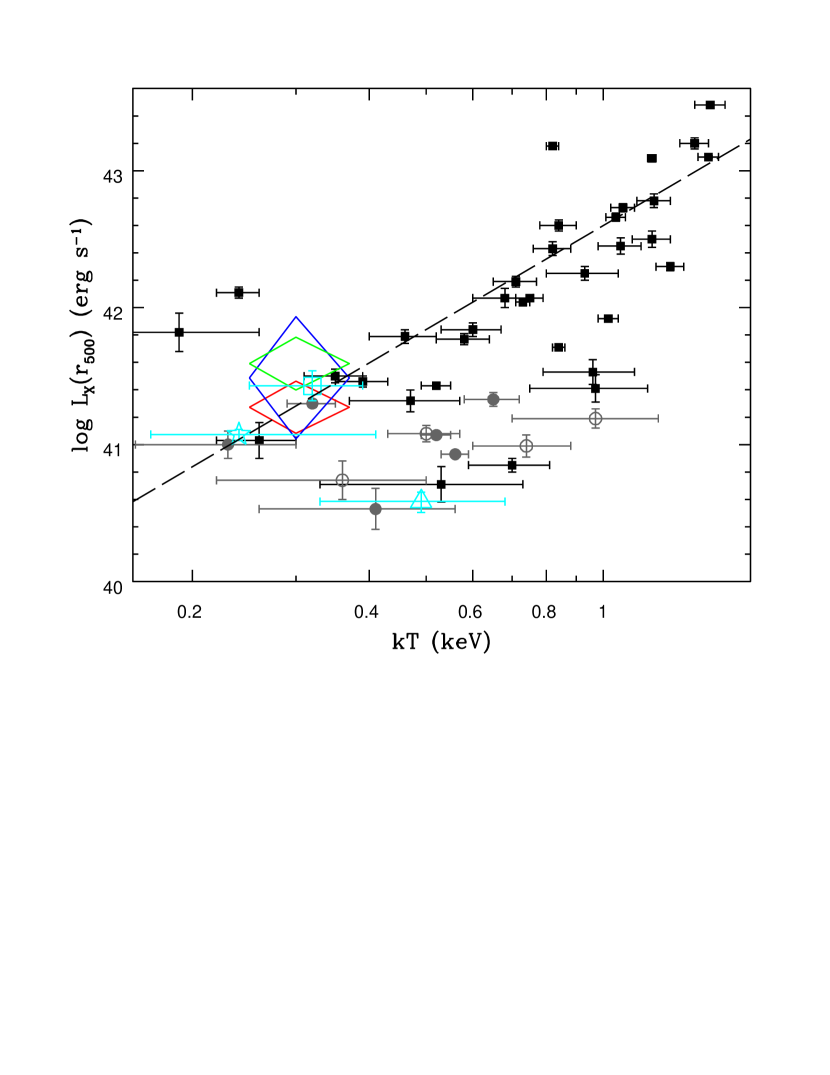
Figure 6 shows a comparison of our luminosity estimates with the luminosity-temperature distribution of a sample of X-ray bright groups from Osmond & Ponman (2004). Their sample was divided into confirmed groups with diffuse X-ray emission extending 65 kpc (their G subsample, black squares) and less luminous systems which only host galaxy-scale extended emission (H sample, grey circle). Apart from HCG 16, none of their G groups were spiral-only systems. The H sample did include four spiral-only systems, which fall on the lower edge of the luminosity-temperature (L-T) distribution. All three of our estimates fall within the scatter of the distribution, which is large at low temperatures, though the upper bound of our luminosity estimate assuming a fully virialized halo is at the upper edge.
For comparison, we also show previous estimates of the luminosity and temperature of HCG 16, corrected to our adopted distance. However, we note that these values are not truly comparable, owing to the different apertures used and different approaches to exclusion of galaxy emission and point sources. The XMM estimate of Belsole et al. (2003) differs from ours by the largest factor, with a marginally higher temperature and significantly lower luminosity. The ROSAT estimate of Dos Santos & Mamon (1999), using their fit with abundance fixed at 0.1, is in agreement with our unextrapolated luminosity estimate, while the Osmond & Ponman estimate is comparable to all three of our luminosity estimates. In summary, our Chandra measurements are consistent with the measured luminosity-temperature relation for groups, within the large observed scatter.
5.2. The origin of the hot IGM
Three possible sources of the hot gas in the intra-group medium of HCG 16 can be suggested: 1) Primordial gas which has fallen into the group potential and been shock heated to the virial temperature; 2) Shock-heated from the large-scale filament, heated by a high-speed collision as in Stephan’s Quintet; 3) Material ejected from the member galaxies by galactic winds during phases of intense star formation. Perhaps the most notable feature of the IGM is the partial correlation between the positions of the hot and cold gas in the group, with the X-ray and emission co-located around the starburst galaxies NGC 838 and NGC 839. This, combined with the ridge morphology of the hot gas, strongly suggests a connection between the two different gas phases, at least in the group core.
In most relaxed, X-ray bright groups, the IGM produces an elliptical or circular surface brightness distribution (see e.g., Mulchaey et al., 2003). Ridge-like structures linking galaxies and superimposed on an underlying ellipsoidal structure are not unknown (e.g., the NGC 5171 group, Osmond et al., 2004) but are uncommon. The only other spiral-only group detected in the X-ray band, SCG0018-4854, is too X-ray faint to allow a detailed morphological study (Trinchieri et al., 2008), but Stephan’s Quintet, whose galaxy population is only slightly more evolved than HCG 16, has an apparently relaxed large-scale IGM outside the complex group core (Trinchieri et al., 2005; O’Sullivan et al., 2009). The S3 field of view is too small to allow us to determine whether the large-scale X-ray emission outside the ridge is relaxed or not, but the failure to fit a -model to the ridge rules out a simple ellipsoidal model such as that used by Belsole et al. (2003). Certainly the ridge is the dominant component of the IGM in the Chandra field of view, and the distribution of emission outside the ridge is very flat.
We can consider the stability and likely lifespan of the ridge structure as a constraint on its likely origin. Taking a radius of 25 kpc and a typical temperature of 0.3 keV, the sound crossing time of the ridge is 112 Myr. The ridge has a higher density (and therefore pressure) than the surrounding IGM, and should therefore expand and disperse over the course of a few hundred Myr, unless it is somehow confined. An extended filamentary structure like the ridge could not be formed by the relaxed gravitational potential of a virialized group, but might be temporarily formed by the close association of the group member galaxies, with their individual dark matter halos helping to retain some of the gas around the galaxies. The lifetime of the southern ridge might be extended by the ongoing starburst winds from NGC 838 and NGC 839, which could inject new higher-density gas as older material expands outward. The southern ridge has a surface brightness a factor 1.5 greater than the northern ridge, and starburst winds may explain this difference. The north ridge has only marginally higher surface brightness than its surroundings (8.631038 arcmin-2 compared to 6.381038 arcmin-2 for the IGM) and this may be related to the lack of recent star formation in NGC 833 and NGC 835.
Another possibility is that our spectral fits to the diffuse X-ray emission are misleading, and that the ridge is actually a region of enhanced abundance rather than enhanced density. Galaxy winds could have enriched the IGM around the galaxies, producing higher surface brightness through enhanced line emission. Quite small increases in abundance can significantly increase surface brightness at the low temperatures observed in the group, and doubling the observed 0.05 abundance could explain the factor 1.3 change in mean surface brightness across the ridge. This scenario is again consistent with a higher surface brightness in the southern ridge, since its enrichment is ongoing. However, it is difficult to see how the ridge can be a product of enrichment alone; the same galaxy winds which transport heavy elements out into the ridge also bring higher density gas. It seems likely that all of these possibilities contribute, and that the ridge is a temporary structure formed by the gravitational interaction of the major group members, with starburst winds helping to boost its surface brightness, extent and lifetime.
5.2.1 A virialized halo
The estimated gas mass in the IGM for a fully virialized 0.3 keV system implies a (hot) gas mass fraction within of =0.02-0.11, a stellar fraction of =0.08, and a baryon fraction of 0.11-0.20, taking =41012 from the M:T relation of Arnaud et al. (2005) and neglecting the contribution of dwarf galaxies and any intergalactic stellar component. The lower bound of this range is just comparable with the upper limit of scatter seen in the lowest mass groups and poor clusters for which accurate measurements have been made (e.g., Sanderson et al., 2013; Gonzalez et al., 2013), while the upper bound exceeds the universal baryon fraction. We also note that the Sanderson et al. and Gonzalez et al. baryon fraction measurements include a significant contribution from intra-cluster stars, which our estimate neglects. Including this component in HCG 16 would increase the baryon fraction, making the agreement with other groups even poorer. Our alternative estimate, assuming the hot gas distribution is comparable to that of the , would give a somewhat more reasonable 0.12-0.13, again neglecting intra-cluster stars.
Similarly, the stellar fraction is 50% of the universal baryon fraction, considerably higher than observed in more massive groups and clusters (Sanderson et al., 2013; Gonzalez et al., 2013). Stellar fraction is expected to peak in systems with mass M1012 (Leauthaud et al., 2012), but 0.5 would place HCG 16 at the extreme upper edge of the likely range.
It therefore seems unlikely that the IGM of HCG 16 (or at least that part of it we can observe) is relaxed, or that it has formed entirely through gravitational infall. The Chandra results thus support the conclusions drawn from the ROSAT data by Ponman et al. (1996) and Dos Santos & Mamon (1999). This raises the question of why the group falls on or above the L-T relation. We might expect that the IGM in a virialised group would be hotter than in one that has yet to virialize, since the fully collapsed system is denser and better able to compress the gas. However, if a large fraction of the gas is heated by non-gravitational processes such as star formation or shocks, its temperature will depend on the balance between those heating processes and losses from radiative cooling and gas mixing.
5.2.2 Shock heating
Shock heating of the , as observed in Stephan’s Quintet, would require a high velocity collision. The line-of-sight velocities of the five major galaxies in HCG 16 cover a range of only 227, with the largest difference, between NGC 833 and NGC 835, probably arising from their interaction. However, if we consider that the age of the starbursts in NGC 838 and NGC 839 are likely to correspond to tidal encounters with NGC 848, we can estimate the velocity of NGC 848 in the plane of the sky to be 455-475. A collision at this velocity would produce a strong shock in a 100K cloud; a head-on collision would raise the temperature of the to 0.42 keV (5106K). This is quite similar to the observed temperature of the IGM, suggesting that if shock heating is the primary source of gas, cooling must have had little impact since the shock occurred.
NGC 848 would also have caused a weak shock in any hot gas it encountered while passing through the group core. A temperature of 0.3 keV implies a sound speed of 220 in the IGM, so NGC 848 would have produced a Mach2.1 shock, a temperature increase of factor 2.2 and a density increase of factor 2.4. A weak shock would therefore produce a large increase, of a factor 10, in the bolometric X-ray luminosity of any hot gas in the system. The current data are not capable of differentiating between a ridge primarily formed from shocked , and one with a significant contribution from shocked hot gas, but the effects of such shocks in compact groups would make an interesting subject for investigation with future numerical simulations.
Only the S1 CCD of ObsID 923 covers NGC 848, where any shock front would currently be located, and the short exposure of the observation and large off-axis angle mean that it lacks the depth and spatial resolution to detect such a feature. None of the other indicators of a shock observed in Stephan’s Quintet (optical and infra-red line emission, radio continuum emission, star formation outside the major galaxies) are present in HCG 16, though most of them are short lived and would likely have faded over the 500 Myr since NGC 848 passed the other galaxies. The large mass of observed in NGC 848 and in the large-scale filament strongly suggests that shock heating can only have affected a small fraction of the gas. We can place a limit on the mass of that could have been shock heated of 1.11010, based on the deficiency of the group (Verdes-Montenegro et al., 2001). At best, shock heated may therefore account for 20% of the IGM.
5.2.3 Galaxy winds
The third possible source of gas is the star formation driven galactic winds in the member galaxies. Our observations of NGC 838 and NGC 839 show that the winds of these starburst galaxies have temperatures of 0.8-0.9 keV, with some indication of a temperature decline in their outer parts (see Paper I). Although the radiative cooling times of the hot gas in the winds are 1 Gyr, we might expect more rapid cooling to be caused by mixing with cold gas entrained in the winds or encountered as wind material interacts with the filament. This might explain the reduction in temperature by a factor of 3 from the galaxy winds to the IGM. It might also explain the marginally higher temperature of the diffuse gas in the south ridge (0.34 keV) where the two starburst galaxies reside, compared to the north ridge, which is occupied by AGN-dominated systems (0.27 keV).
Our estimate of the mass of gas which may have been ejected by NGC 838 and NGC 839 (9.5109) exceeds the mass of hot gas in the southern ridge by a factor 3, suggesting that it could be largely formed from ejected wind material. For the northern ridge to have formed in a similar way, the star formation rates of NGC 833 and NGC 835 would have to have been significantly greater in the past. Given the limits on recent star formation from our stellar population modelling of NGC 833 (see paper I) their starburst periods would need to be significantly older, perhaps triggered by an initial tidal encounter between the two galaxies. From the velocity estimated above, NGC 848 seems likely to have passed NGC 833/835 600 Myr ago, and a starburst triggered then would be clearly detected in the SDSS spectrum of NGC 833. If we assume that NGC 833 and NGC 835 did go through a superwind phase, then a total of 21010 of hot gas would have been produced by the four original group members, 20-40% of our estimated IGM mass. For a Salpeter initial mass function, stellar populations are expected to lose 30% of their mass over a Hubble time (White, 1991; David et al., 1991). For the four original members this puts a strong upper limit of 91010 of hot gas which could be produced from the galaxies, roughly five times the amount we expect to have been ejected by stellar winds.
If wind material does make up a significant fraction of the IGM, we might expect to see higher abundances. The abundance measured in NGC 838 is only 0.16, but is probably biased low because even the hot phase of the wind is multi-temperature and because of mass loading; as the enriched hot gas produced by stellar winds and supernovae flows out of the galaxy it entrains less enriched neutral hydrogen which effectively dilutes the metallicity. This is likely to be the case in the IGM as well since we observe , X-ray and radio continuum emission from the same regions, indicating that the IGM is multi-phase.
There is also the question of whether hot wind material can escape the immediate neighbourhood of the starburst galaxies and diffuse out through the surrounding . The diffuse radio continuum emission demonstrates that gas from the winds can reach distances of 20-30 kpc, and the X-ray and radio morphology of the winds suggests that while they may be affected by the motion of the relative to the galaxies, they are not completely confined by it. It seems likely that the large-scale filament is actually a complex of smaller structures, interspersed with hotter material. While some mixing must take place, resulting in heating of the and cooling of the hot X-ray emitting gas, the presence of the X-ray ridge demonstrates that this is not an efficient process. Hot gas clearly coexists with the over significant timescales. (Borthakur et al., 2010) have estimated that clouds of radius 200 pc (0.73′′) can survive for a few hundred Myr in a hot IGM, so this is not implausible.
We can question whether the energy available for star formation is sufficient to heat this mass of gas to its current temperature. The total energy of the gas in the north and south ridges is 41057 erg. The number of core collapse supernovae expected per unit star formation is 0.01-0.015 (Botticella et al., 2012), and we assume the standard value for the energy available from each supernova, 1051 erg. This suggests that over the 500 Myr (400 Myr) timescale of star formation in NGC 838 (NGC 839), a star formation rate of 0.25-0.35 (0.35-0.5) would be needed to heat the gas through supernovae, assuming perfect efficiency and no losses. Accounting for radiative losses from the hot gas, the much higher star formation rates for the two galaxies measured in paper I suggest that efficiencies of 2-4% would be sufficient to heat the gas in the ridge to its observed temperature.
However, the enrichment of the IGM by heavy elements in the galactic winds must also be considered. If the abundance of the ridge is truly 0.05, this implies that the ridge contains 10400 of Fe. Production of heavy elements is likely to be dominated by core collapse supernovae in the superwind galaxies, so adopting an Fe yield of 0.07 per supernova (Finoguenov et al., 2000), we would require only 1.5105 supernovae to produce the observed enrichment. This is insufficient to heat the ridge gas to the observed temperature. Even if the abundance were 0.3, we would still only require 9105 supernovae, between 1/5 and 1/7 of the number required to heat the gas in the ridge.
If we use our estimate of the number of supernovae required to heat the gas, we find that the expected Fe abundance is 1.3. However, we only expect galactic winds to have contributed 20-40% of the gas in the ridge. If the remaining 60-80% is low-abundance, unenriched gas heated by some other process (gravitational collapse and/or shocks) mixing will reduce the expected abundance to 0.25-0.5. The lower end of this range could be consistent with our abundance measurements, once the effect of biases arising from the multiphase nature of the IGM are taken in to account. We therefore conclude that it is plausible both energetically and in terms of mass, that galactic winds from the member galaxies have played a significant part in forming the IGM we observe in HCG 16, though they cannot be the only source of hot gas.
6. Conclusions
HCG 16 is one of only two spiral-only groups known to support an X-ray luminous hot IGM. As such, it provides a unique view of the early stages of group evolution, in which hot and cold gas phases coexist and tidal interactions have begun to reshape the galaxy population. The possibility that dynamical interactions and galaxy winds may play a significant role in the build up of the hot IGM is of obvious importance to our understanding of the development of galaxy groups and their member galaxies. We have analysed new deep Chandra observations of HCG 16 with the goal of determining the properties and likely origin of its hot gaseous halo. Our results can be summarised as follows:
-
1.
We confirm the presence of an extended hot IGM in HCG 16 with a temperature 0.3 keV and abundance 0.05. Hot gas is found to extend through the ACIS-S3 field of view, with the brightest emission forming a ridge linking the four original group members and extending to the southeast, in rough agreement with previous ROSAT and XMM-Newton results. The ridge partly overlaps the tidal filament that links the five major galaxies, particularly in the region around NGC 838 and NGC 839, suggesting that the two gas phases are intermingled. The ridge contains 6.6109 of gas with an entropy 25-30 keV cm2. This mass is similar to the deficiency of the group, while the entropy is comparable to the limit below which cooling is thought to fuel star formation and nuclear activity in the cooling flows of galaxy clusters (Voit et al., 2008). However, the cooling time of the gas is long, 7-10 Gyr, suggesting that radiative cooling is unlikely to be an important factor for the hot IGM.
-
2.
We consider three possible mechanisms which may have contributed to the formation of the IGM in HCG 16. The correlated X-ray and morphology suggests that in the group core neither the hot nor the cold gas component is relaxed, while the radio and X-ray morphologies of the galactic winds provide evidence that hot gas can escape the galaxies and mix into the IGM despite the surrounding cold . The assumption that the group is virialized with an IGM formed through gravitational accretion leads to unrealistically high gas and baryon fraction estimates. A more limited gas distribution similar to that of the implies a hot gas mass of 5.2-9.41010 and luminosity =2.5-6.11041. We consider the possibility that part of the hot IGM may have been formed through the shock heating of neutral hydrogen as NGC 848 passed through the group core, but while we find it likely that NGC 848 was supersonic during this passage, there is no direct evidence of such a shock. Taking our rates of outflow for hot gas in the winds of NGC 838 and NGC 839 from Paper I, we find that they may have ejected 21010 of gas since their starbursts began. If NGC 833 and NGC 835 underwent similar starburst phases at an earlier period, galactic winds could have contributed 20-40% of the hot gas observed in the IGM.
We therefore conclude that starburst winds have played a significant role in the development of the IGM in HCG 16, alongside gravitational infall and possibly collisional shock heating of . Given the very small numbers of low-mass, spiral-rich groups at this early evolutionary stage in which a hot diffuse IGM is known to exist, it is difficult to judge how widely applicable this result is to the general population. However, the importance of understanding the process by which the IGM is formed and its relationship to other aspects of group evolution and structure formation makes it clear that further studies of similar systems are required.
References
- Arnaud et al. (2005) Arnaud, M., Pointecouteau, E., & Pratt, G. W. 2005, A&A, 441, 893
- Belsole et al. (2003) Belsole, E., Sauvageot, J.-L., Ponman, T. J., & Bourdin, H. 2003, A&A, 398, 1
- Borthakur et al. (2010) Borthakur, S., Yun, M. S., & Verdes-Montenegro, L. 2010, ApJ, 710, 385
- Botticella et al. (2012) Botticella, M. T., Smartt, S. J., Kennicutt, R. C., Cappellaro, E., Sereno, M., & Lee, J. C. 2012, A&A, 537, A132
- Contini et al. (1998) Contini, T., Considere, S., & Davoust, E. 1998, A&AS, 130, 285
- David et al. (1991) David, L. P., Forman, W., & Jones, C. 1991, ApJ, 380, 39
- de Carvalho & Coziol (1999) de Carvalho, R. R., & Coziol, R. 1999, AJ, 117, 1657
- Dos Santos & Mamon (1999) Dos Santos, S., & Mamon, G. A. 1999, A&A, 352, 1
- Eckmiller et al. (2011) Eckmiller, H. J., Hudson, D. S., & Reiprich, T. H. 2011, A&A, 535, A105
- Eke et al. (2004) Eke, V. R., Frenk, C. S., Baugh, C. M., Cole, S., Norberg, P., Peacock, J. A., Baldry, I. K., Bland-Hawthorn, J., Bridges, T., Cannon, R., Colless, M., Collins, C., Couch, W., Dalton, G., de Propris, R., Driver, S. P., Efstathiou, G., Ellis, R. S., Glazebrook, K., Jackson, C. A., Lahav, O., Lewis, I., Lumsden, S., Maddox, S. J., Madgwick, D., Peterson, B. A., Sutherland, W., & Taylor, K. 2004, MNRAS, 355, 769
- Finoguenov et al. (2000) Finoguenov, A., David, L. P., & Ponman, T. J. 2000, ApJ, 544, 188
- Fruscione et al. (2006) Fruscione, A., McDowell, J. C., Allen, G. E., Brickhouse, N. S., Burke, D. J., Davis, J. E., Durham, N., Elvis, M., Galle, E. C., Harris, D. E., Huenemoerder, D. P., Houck, J. C., & et al. 2006, in Observatory Operations: Strategies, Processes, and Systems. Edited by Silva, David R.; Doxsey, Rodger E.. Proceedings of the SPIE, Volume 6270, pp. 62701V (2006). (Bellingham, WA, USA: International Society for Optical Enginerring)
- Gonzalez et al. (2013) Gonzalez, A. H., Sivanandam, S., Zabludoff, A. I., & Zaritsky, D. 2013, ApJ, 778, 14
- Grevesse & Sauval (1998) Grevesse, N., & Sauval, A. J. 1998, Space Sci. Rev., 85, 161
- Helsdon & Ponman (2003) Helsdon, S. F., & Ponman, T. J. 2003, MNRAS, 339, L29
- Hickson (1982) Hickson, P. 1982, ApJ, 255, 382
- Hickson et al. (1992) Hickson, P., Mendes de Oliveira, C., Huchra, J. P., & Palumbo, G. G. 1992, ApJ, 399, 353
- Jeltema et al. (2008) Jeltema, T. E., Binder, B., & Mulchaey, J. S. 2008, ApJ, 679, 1162
- Johnson et al. (2007) Johnson, K. E., Hibbard, J. E., Gallagher, S. C., Charlton, J. C., Hornschemeier, A. E., Jarrett, T. H., & Reines, A. E. 2007, AJ, 134, 1522
- Kalberla et al. (2005) Kalberla, P. M. W., Burton, W. B., Hartmann, D., Arnal, E. M., Bajaja, E., Morras, R., & Pöppel, W. G. L. 2005, A&A, 440, 775
- Kilborn et al. (2009) Kilborn, V. A., Forbes, D. A., Barnes, D. G., Koribalski, B. S., Brough, S., & Kern, K. 2009, MNRAS, 400, 1962
- Konstantopoulos et al. (2010) Konstantopoulos, I. S., Gallagher, S. C., Fedotov, K., Durrell, P. R., Heiderman, A., Elmegreen, D. M., Charlton, J. C., Hibbard, J. E., Tzanavaris, P., Chandar, R., Johnson, K. E., Maybhate, A., Zabludoff, A. E., Gronwall, C., Szathmary, D., Hornschemeier, A. E., English, J., Whitmore, B., Mendes de Oliveira, C., & Mulchaey, J. S. 2010, ApJ, 723, 197
- Konstantopoulos et al. (2013) Konstantopoulos, I. S., Maybhate, A., Charlton, J. C., Fedotov, K., Durrell, P. R., Mulchaey, J. S., English, J., Desjardins, T. D., Gallagher, S. C., Walker, L. M., Johnson, K. E., Tzanavaris, P., & Gronwall, C. 2013, ApJ, 770, 114
- Leauthaud et al. (2012) Leauthaud, A., George, M. R., Behroozi, P. S., Bundy, K., Tinker, J., Wechsler, R. H., Conroy, C., Finoguenov, A., & Tanaka, M. 2012, ApJ, 746, 95
- Martínez et al. (2010) Martínez, M. A., Del Olmo, A., Coziol, R., & Perea, J. 2010, AJ, 139, 1199
- Mulchaey et al. (2003) Mulchaey, J. S., Davis, D. S., Mushotzky, R. F., & Burstein, D. 2003, ApJS, 145, 39
- Osmond & Ponman (2004) Osmond, J. P. F., & Ponman, T. J. 2004, MNRAS, 350, 1511
- Osmond et al. (2004) Osmond, J. P. F., Ponman, T. J., & Finoguenov, A. 2004, MNRAS, 355, 11
- O’Sullivan et al. (2009) O’Sullivan, E., Giacintucci, S., Vrtilek, J. M., Raychaudhury, S., & David, L. P. 2009, ApJ, 701, 1560
- O’Sullivan et al. (2007) O’Sullivan, E., Vrtilek, J. M., Harris, D. E., & Ponman, T. J. 2007, ApJ, 658, 299
- O’Sullivan et al. (2014) O’Sullivan, E., Zezas, A., Vrtilek, J. M., Giacintucci, S., David, L. P., Mamon, G. A., Ponman, T. J., & Raychaudhury, S. 2014, ApJ, 793, 73, paper I
- Ponman et al. (1996) Ponman, T. J., Bourner, P. D. J., Ebeling, H., & Bohringer, H. 1996, MNRAS, 283, 690
- Ribeiro et al. (1998) Ribeiro, A. L. B., de Carvalho, R. R., Capelato, H. V., & Zepf, S. E. 1998, ApJ, 497, 72
- Rich et al. (2010) Rich, J. A., Dopita, M. A., Kewley, L. J., & Rupke, D. S. N. 2010, ApJ, 721, 505
- Sanderson et al. (2013) Sanderson, A. J. R., O’Sullivan, E., Ponman, T. J., Gonzalez, A. H., Sivanandam, S., Zabludoff, A. I., & Zaritsky, D. 2013, MNRAS, 429, 3288
- Snowden et al. (2004) Snowden, S. L., Collier, M. R., & Kuntz, K. D. 2004, ApJ, 610, 1182
- Sulentic et al. (2001) Sulentic, J. W., Rosado, M., Dultzin-Hacyan, D., Verdes-Montenegro, L., Trinchieri, G., Xu, C., & Pietsch, W. 2001, AJ, 122, 2993
- Sun et al. (2009) Sun, M., Voit, G. M., Donahue, M., Jones, C., Forman, W., & Vikhlinin, A. 2009, ApJ, 693, 1142
- Theureau et al. (2007) Theureau, G., Hanski, M. O., Coudreau, N., Hallet, N., & Martin, J.-M. 2007, A&A, 465, 71
- Trinchieri et al. (2008) Trinchieri, G., Iovino, A., Pompei, E., Dahlem, M., Reeves, J., Coziol, R., & Temporin, S. 2008, A&A, 484, 195
- Trinchieri et al. (2003) Trinchieri, G., Sulentic, J., Breitschwerdt, D., & Pietsch, W. 2003, A&A, 401, 173
- Trinchieri et al. (2005) Trinchieri, G., Sulentic, J., Pietsch, W., & Breitschwerdt, D. 2005, A&A, 444, 697
- van der Hulst & Rots (1981) van der Hulst, J. M., & Rots, A. H. 1981, AJ, 86, 1775
- Verdes-Montenegro et al. (2001) Verdes-Montenegro, L., Yun, M. S., Williams, B. A., Huchtmeier, W. K., Del Olmo, A., & Perea, J. 2001, A&A, 377, 812
- Vogt et al. (2013) Vogt, F. P. A., Dopita, M. A., & Kewley, L. J. 2013, ApJ, 768, 151
- Voit et al. (2008) Voit, G. M., Cavagnolo, K. W., Donahue, M., Rafferty, D. A., McNamara, B. R., & Nulsen, P. E. J. 2008, ApJ, 681, L5
- White (1991) White, III, R. E. 1991, ApJ, 367, 69