Quasifree Photoproduction of Mesons off Protons and Neutrons
Abstract
Differential and total cross sections for the quasifree reactions and have been determined at the MAMI-C electron accelerator using a liquid deuterium target. Photons were produced via bremsstrahlung from the 1.5 GeV incident electron beam and energy-tagged with the Glasgow photon tagger. Decay photons of the neutral decay modes and and coincident recoil nucleons were detected in a combined setup of the Crystal Ball and the TAPS calorimeters. The -production cross sections were measured in coincidence with recoil protons, recoil neutrons, and in an inclusive mode without a condition on recoil nucleons, which allowed a check of the internal consistency of the data. The effects from nuclear Fermi motion were removed by a kinematic reconstruction of the final-state invariant mass and possible nuclear effects on the quasifree cross section were investigated by a comparison of free and quasifree proton data. The results, which represent a significant improvement in statistical quality compared to previous measurements, agree with the known neutron-to-proton cross-section ratio in the peak of the (1535) resonance and confirm a peak in the neutron cross section, which is absent for the proton, at a center-of-mass energy MeV with an intrinsic width of MeV.
pacs:
13.60.Le, 14.20.Gk, 25.20.LjI Introduction
Photoproduction of mesons provides important information about the excitation spectrum of the nucleon that, despite various long-lasting experimental and theoretical efforts, is still not sufficiently understood. The number of predicted states (see Review of Quark Model in Ref. J. Beringer et al. (2012) (Particle Data Group) exceeds the experimentally observed number and the properties of some identified states are markedly different from those expected. The difficulty of identifying the relevant degrees of freedom of Quantum Chromodynamics (QCD) in the nonperturbative region using effective models can perhaps be solved in the future by lattice calculations. Nevertheless, further precise experimental input is needed since the majority of the available data comes from pion scattering experiments, which could leave states that couple only weakly to undiscovered. This situation is currently changing due to the world-wide effort to measure the photoproduction of mesons off nucleons with tagged photon beams. Not only angular distributions but also many different polarization observables from measurements with circularly and linearly polarized beams and longitudinally and transversely polarized targets are becoming available, e.g., from the CLAS experiment at the Thomas Jefferson National Accelerator Facility (JLab), the CBELSA/TAPS experiment at ELSA, and the Crystal Ball/TAPS experiment at MAMI. The first results of this program are summarized in the Baryon Particle Listings in the Review of Particle Physics J. Beringer et al. (2012) (Particle Data Group) by the Particle Data Group (PDG). The new results from photon-induced reactions are quite important, e.g., for the coupled-channel partial-wave analysis of the Bonn-Gatchina group (BnGn) Anisovich et al. (2012) or the partial-wave analysis of the SAID group Workmann et al. (2012).
The majority of these recent measurements investigated photoproduction off free protons. The complementary program for the neutron target is less advanced due to the complications arising from the use of quasifree neutrons bound in light nuclei as targets. However, this program is very important for the investigation of resonances because the helicity couplings are isospin dependent. In some cases it is even possible that the excitation of states is forbidden for the proton (or at least strongly suppressed) but allowed for the neutron (Moorehouse selection rules Moorehouse (1966)). Therefore, the isospin decomposition of the amplitudes requires measurements of photoproduction of mesons off neutrons. Light nuclei such as 3He and, in particular, the loosely bound deuteron are the best available targets. In comparison to measurements with free protons some complications arise. The first is of a technical nature. The classification of the final state requires the detection and identification of the recoil nucleon. This is challenging for all-neutral final states (neutron, decay-photons from neutral mesons like , ), which are produced in some of the most interesting reactions. At present, only almost covering electromagnetic calorimeters with good particle identification capabilities can efficiently measure such reactions. All excitation functions, angular distributions, and other observables will be smeared by the Fermi motion of the bound nucleons. This problem can in principle be overcome by a complete reconstruction of the final-state nucleon-meson kinematics, which reveals the ‘true’ (, : recoil nucleon and meson four-momenta) of the reaction. However, for tagged-photon experiments this means that the resolution of is no longer defined by the energy resolution of the incident tagged-photon beam but by the typical resolution of the reaction-product detector (which is usually much worse). The last problem is the possible modification of the experimental results due to nuclear effects, in particular final-state interactions (FSI) between the nucleons or between mesons and nucleons. Such effects can be investigated for proton photoreactions where the results for free protons can be compared with quasifree measurements on protons bound in the deuteron. This gives some indication of whether, for a specific reaction channel, FSI effects are important and can test FSI models before they are applied to quasifree neutron measurements.
I.1 Photoproduction of mesons
Photoproduction of mesons attracted much interest when this reaction became experimentally accessible with a precision comparable to pion photoproduction. Due to its isoscalar nature only isospin 1/2 resonances can decay to the nucleon ground state via emission. Furthermore, due to its relatively large mass (compared to pions) the number of relevant partial waves is still small at excitation energies where so far many predicted low-spin states are ‘missing’. This simplifies the interpretation of the data.
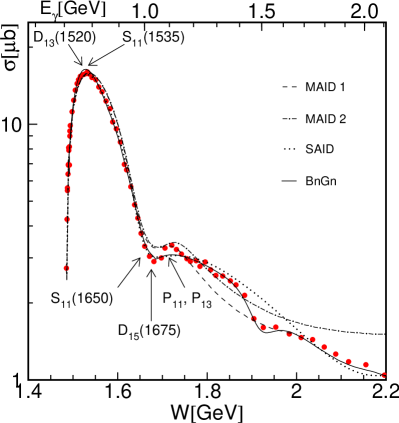
Experimental progress for measurements of the reaction with free protons was huge during the last decade, so that now photoproduction of mesons is probably the best studied final state apart from pion production. Total cross sections, angular distributions, and some polarization observables have been investigated at all major tagged photon facilities sometimes even with repeated and improved experiments Krusche et al. (1995a); Ajaka et al. (1998); Bock et al. (1998); Renard et al. (2002); Dugger et al. (2002); Crede et al. (2005); Nakabayashi et al. (2006); Bartalini et al. (2007); Bartholomy et al. (2007); Elsner et al. (2007); Crede et al. (2009); Williams et al. (2009); Sumihama et al. (2009); McNicoll et al. (2010). For the discussion of the gross features of production off the proton, Fig. 1 summarizes the results for the total cross section (averaged over all available data).
At threshold (= 708 MeV, 1486 MeV) the reaction is completely dominated by the excitation of the (1535) resonance Krusche et al. (1997). Contributions from the (1440) (Roper) resonance have never been directly identified. The Review of Particle Physics cites a branching ratio of (01)% J. Beringer et al. (2012) (Particle Data Group). The (1520) resonance makes a tiny contribution (branching ratio (0.230.04)% J. Beringer et al. (2012) (Particle Data Group)), which is negligible for the total cross section but was identified via an interference term in the angular distributions Krusche et al. (1995a); Weiss et al. (2003) and, even more significantly, in the photon beam asymmetry Ajaka et al. (1998); Elsner et al. (2007). At slightly higher energy the (1650) interferes (for the proton) destructively with the (1535). In the S11 region (see Krusche and Schadmand (2003) for a summary) contributions from non-resonant backgrounds seem to be small.
At slightly higher energies contributions from the (1675), (1700), (1710), and (1720) resonances can be expected. Branching ratio estimates given by PDG J. Beringer et al. (2012) (Particle Data Group) are 10–30% for the , (41)% for the , and (01)% for the two -wave states. The results differ between the available analyses. Total cross sections from some analyses (MAID 1: -MAID isobar model Chiang et al. (2002), MAID 2: -MAID reggeized isobar model Chiang et al. (2003), BnGn: Bonn-Gatchina coupled-channel analysis Anisovich et al. (2005), SAID partial-wave analysis McNicoll et al. (2010)) are compared in Fig. 1 to the average of all available data. In the region around photon energies of 1 GeV agreement between the model fits is not very good and, as discussed, e.g., in Elsner et al. (2007), the relative contributions of different resonances differ quite a bit in the models.
For the neutron, the range from threshold throughout the (1535) resonance has been studied intensively using the deuteron or helium isotopes as targets Krusche et al. (1995b); Hoffmann-Rothe et al. (1997); Weiss et al. (2003, 2001); Pfeiffer et al. (2004); Hejny et al. (1999, 2002). The experiments found consistently a neutron-to-proton cross-section ratio for quasifree production close to 2/3 and very small coherent contributions, which was interpreted as evidence for a dominant isovector excitation of the (1535) (the isoscalar admixture in the proton amplitude is only 9% Krusche and Schadmand (2003)).
Above this energy range many open questions exist. Most analyses (MAID, SAID) find a negative sign for the (in the following all values are in units of GeV-1/2) neutron helicity coupling of the four star (1650) resonance (PDG: 1521) and thus a destructive interference between the two states. A negative sign is also preferred by quark models (e.g., Capstick Capstick (1992): ; Burkert et al. Burkert et al. (2003): 313). However, the more recent analyses of the Bonn-Gatchina group Anisovich et al. (2013a) (2520) and Shresta and Manley Shrestha and Manley (2012) (112) found positive values corresponding to a constructive interference. The -MAID model Chiang et al. (2002) found a much larger -decay branching ratio than quoted in PDG for the (1675) state (17%). It thus predicted a significant contribution of this state to because it has much larger photon couplings for the neutron than for the proton. Furthermore, there were predictions that the non-strange -like member of the conjectured baryon antidecuplet Diakonov et al. (1997) should be electromagnetically excited more strongly on the neutron, should have a large decay branching ratio to , an invariant mass around 1.7 GeV, and a width of a few tens of MeV Diakonov et al. (1997); Polyakov and Rathke (2003); Arndt et al. (2004).
Motivated by these open problems several experiments have recently studied this reaction. Exclusive measurements of and on the deuteron in quasifree kinematics were performed by GRAAL Kuznetsov et al. (2007), at the Laboratory of Nuclear Science at Sendai (LNS-Sendai) Miyahara et al. (2007) and by the CBELSA/TAPS collaboration Jaegle et al. (2008, 2011). A prominent structure in the total cross section of at incident photon energies around 1 GeV was first found by the GRAAL experiment. This peak with a width of only 25 MeV appeared also in the CBELSA/TAPS data at GeV when the true center-of-mass energy was reconstructed from the final-state meson and the recoil neutron. Using the same analysis, the cross section for was determined and good agreement to previous direct measurements on the free proton was found, demonstrating that nuclear effects could be reliably controlled by this method. Moreover, it was found that around the same value of the total proton cross section shows a dip-like structure, which was confirmed by the latest high-statistics measurement on free protons at MAMI-C McNicoll et al. (2010). The origin of the dip in the proton cross section was recently discussed for various scenarios (narrow resonances, threshold effects from the reaction) in the framework of the BnGn model Anisovich et al. (2013b).
At the moment the nature of the peak in the neutron cross section and the dip in the proton cross section is not understood nor is it clear whether they are correlated. The only scenario that is ruled out in the case of the neutron is that the peak originates from an isolated conventional broad resonance. Various scenarios have been suggested in the literature. They range from different coupled-channel effects of known nucleon resonances Shklyar et al. (2007); Shyam and Scholten (2008), interference effects in the partial wave Anisovich et al. (2009, 2013a), effects from strangeness threshold openings Döring and Nakayama (2010), to intrinsically narrow states Arndt et al. (2004); Choi et al. (2006); Fix et al. (2007); Anisovich et al. (2009); Shrestha and Manley (2012). The available data are insufficient for an unambiguous analysis.
In this work we present in detail the results from a new high statistics measurement of the total cross section and angular distributions for the reactions and extracted from data taken with a liquid deuterium target at Mainz. The main experimental results have been summarized in a preceding Letter Werthmüller et al. (2013). Both the and the neutral decay modes were used for the reconstruction of the meson, leading to an unprecedented statistical quality of the results and to stringent limits for systematic uncertainties.
Measurements of further quantities, such as single and double polarization observables, are of course highly desirable and are already under way at MAMI.
II Experimental setup
The data were measured during three different beam times at the MAMI electron accelerator facility in Mainz Herminghaus et al. (1976); Kaiser et al. (2008) using the standard A2 setup for photon beam experiments. Details for the experimental parameters (targets, beams) are summarized in Oberle et al. (2013). The electron beam, having an energy of MeV (1558 MeV during part of the beam time) and a current ranging from 4.5 to 10 nA after the last accelerator stage of MAMI-C, was used to produce photons via bremsstrahlung in a 10 m copper radiator. The scattered electrons were momentum-analyzed up to 95% of the initial beam energy in the Glasgow photon tagger Anthony et al. (1991); Hall et al. (1996); McGeorge et al. (2008). The large magnetic dipole of the spectrometer and the 353 half-overlapping plastic scintillators installed in the focal plane allow an energy reconstruction of the bremsstrahlung photons via from the measured electron energy with a resolution of 2–5 MeV. Electrons corresponding to photon energies below 400 MeV were not recorded to increase the event rate and to prevent damage to the phototubes of the low energy tagger detectors.
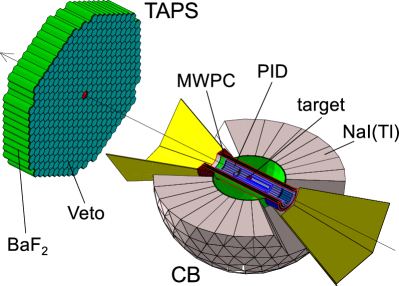
The photon beam was collimated using a 4 mm diameter lead collimator and impinged on the 4.72 cm long (3.0 cm for part of the beam time) Kapton target cylinder of 4 cm diameter. Outgoing particles were detected using the two calorimeters Crystal Ball (CB) Starostin et al. (2001) and TAPS Novotny (1991); Gabler et al. (1994). A schematic diagram of the detector setup is shown in Fig. 2. The CB consists of two hemispheres with in total 672 optically insulated NaI(Tl) crystals of 15.7 radiation length thickness, covering all azimuthal angles for the polar angle range . All crystals point towards the center of the sphere where the target is mounted. The distance from the center to the detector modules is 25 cm. The energy resolution for photons can be described as while typical angular resolutions are – and – Starostin et al. (2001).
The forward hole of the CB is covered by the hexagonal TAPS wall, which is made of 384 hexagonally shaped BaF2 crystals with a thickness of 12 radiation lengths. TAPS was installed 1.46 m downstream from the target covering polar angles from to . The photon energy resolution is parametrized as Gabler et al. (1994). The fine granularity of the detector elements leads to excellent resolution in the polar angle (better than ), while –.
Neutral and charged particles were discriminated by plastic scintillators in both detectors. A 50 cm long barrel of 24 strips with a width of 4 mm surrounded the target and acted as particle identification detector (PID) for the CB Watts (2005). In TAPS charged particles were identified with individual 5 mm thick plastic scintillators that were installed in front of every detector element. The multi-wire proportional chamber (MWPC) surrounding the PID in the CB was not active for the present experiment.
The experimental trigger was relatively open and consisted of a total energy sum threshold in the CB and a minimal total ‘hit’ multiplicity in the CB and TAPS. The energy sum was implemented as the analog sum of all signals from the CB and its threshold was adjusted to correspond to an energy of around 300 MeV, mainly to reject production events. The 672 crystals of the CB were grouped into 45 sectors each containing up to 16 neighboring crystals and TAPS was divided into 6 triangular sectors. If the signal from at least one crystal in a sector exceeded a threshold of about 30 MeV (35 MeV in TAPS) that sector contributed to the event multiplicity. A minimal total multiplicity in the CB and TAPS of two was set to accept events from the decay. For a part of the beam time a multiplicity of 3 was required to increase statistics for the decay and other multi-photon channels. This data set could not be used for the decay.
III Data analysis
III.1 Subtraction of tagger random coincidences
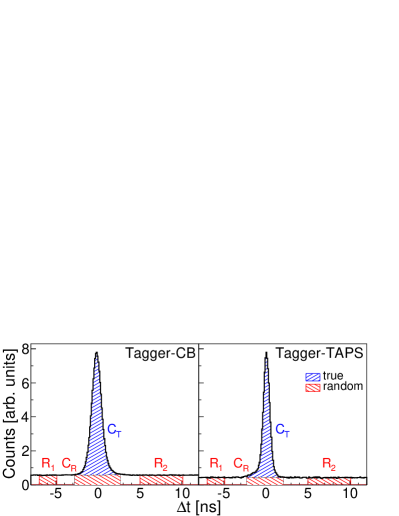
All electron hits in the photon tagger were recorded for each event triggered by the calorimeters. The tagger itself did not contribute to the trigger decision because for every CB/TAPS trigger there was almost always a hit in the tagger. The random coincidences were subtracted by a standard side-band analysis of the production-detector tagger coincidence. Fig. 3 shows the relative timing spectra between the tagger and both the CB and TAPS detectors. The time resolution with respect to TAPS was around 0.9 ns compared to the 1.5 ns that could be achieved with the CB. Hence, whenever possible, tagger coincidence time evaluation was performed with photons detected in TAPS. The true coincidences located in the peak () (hatched blue area in Fig. 3) were determined by a subtraction of the random coincidences (), which were analyzed with cuts on the random background in the time spectrum (regions , ) with proper normalization. This procedure was applied to all spectra. The random background windows in Fig. 3 are only a schematic representation. They were much wider in the actual analysis ( ns) so that statistical uncertainties from random background were negligible.
| decay | reaction | cluster selection criteria |
|---|---|---|
| (2n & 0c) or (2n & 1c) or (3n & 0c) | ||
| 2n & 1c | ||
| 3n & 0c | ||
| (6n & 0c) or (6n & 1c) or (7n & 0c) | ||
| 6n & 1c | ||
| 7n & 0c |
III.2 Particle reconstruction and reaction identification
Clusters in the calorimeters were built from adjacent crystals where the deposited energy in each single crystal exceeded a typical threshold of 2 MeV in the CB and 3–5 MeV in TAPS. If the total deposited energy in all crystals was below 20 MeV, the cluster was ignored in the analysis.
The reconstructed clusters in the CB and TAPS were first classified as neutral or charged. Clusters were marked as charged if a coincident hit in the corresponding PID (CB) or veto element (TAPS) was found, otherwise they were marked as neutral. Depending on the reaction to be measured, a condition on the number and type of clusters was set. An overview of these conditions is given in Table 1. To measure the reactions and exclusive measurements were performed, i.e., the detection of the recoil nucleons was required. In the inclusive measurement of the recoil nucleon could also be undetected. The meson was identified using the neutral decays and as described in the following.
The charged cluster was always assumed to originate from the recoil proton. In the analysis with proton coincidence the meson four-momentum was then immediately reconstructed from the remaining two neutral clusters. In the case of neutron coincidence, a search was performed among the detected three neutral clusters finding the minimal
| (1) |
of all three photon pair combinations. The invariant mass of the two photons and the real mass are denoted as and , respectively. The uncertainty of the invariant mass was evaluated with respect to individual photon cluster angular and energy resolutions of the detector system. The required resolutions and were determined from Monte Carlo (MC) simulations and the known energy resolutions of the CB and TAPS. Once the best combination was found the remaining cluster was marked as the neutron candidate. Events with wrong assignments of the neutrons are sufficiently rejected by the later applied analysis cuts (see Sec. III.3). In the analyses the minimal
| (2) |
over all possible combinations to form three mesons with masses out of six or seven neutral clusters was used to combine the best three mesons to an meson. More details about the analysis are given in Witthauer et al. (2013).
Since the contribution of the energy resolution to the two photon invariant mass is larger than the contribution of the angular resolution, the energy reconstruction of mesons can be optimized by applying the correction
| (3) |
to the reconstructed energy , where and are the invariant mass of the decay photons and the real meson mass, respectively, thus obtaining the energy , which has better resolution. This method correcting the detected photon energies within their resolution was used for the final reconstruction as well as for the intermediate state reconstruction in the analyses.
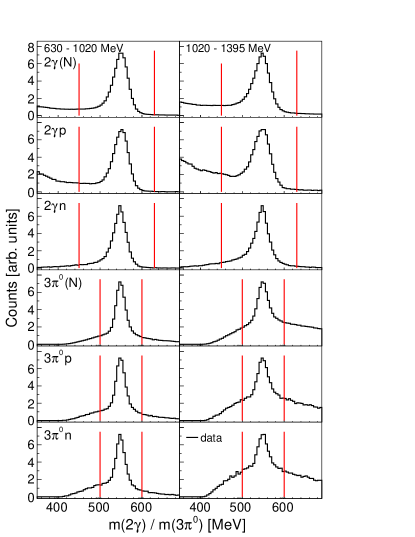
Typical spectra of the and invariant masses obtained after this event selection are shown in Fig. 4 for two ranges of incident photon energy. The resolution in the channel is better due to the constraints posed by the intermediate state mesons (cuts of were applied on the masses in the reconstruction of the three intermediate mesons (not shown)). For all further spectra aiming at the reaction identification, rough cuts on the invariant -mass indicated in Fig. 4 were applied to suppress backgrounds from single and double pion production.
The major part of the background from other reaction channels was removed by a proper identification of the signal reaction using kinematic cuts. These cuts were already applied before the use of further particle identification spectra, such as pulse-shape analysis, time-of-flight versus energy, and analysis, because they can be much more reliably modeled by MC simulations and are therefore less critical sources for systematic uncertainties.
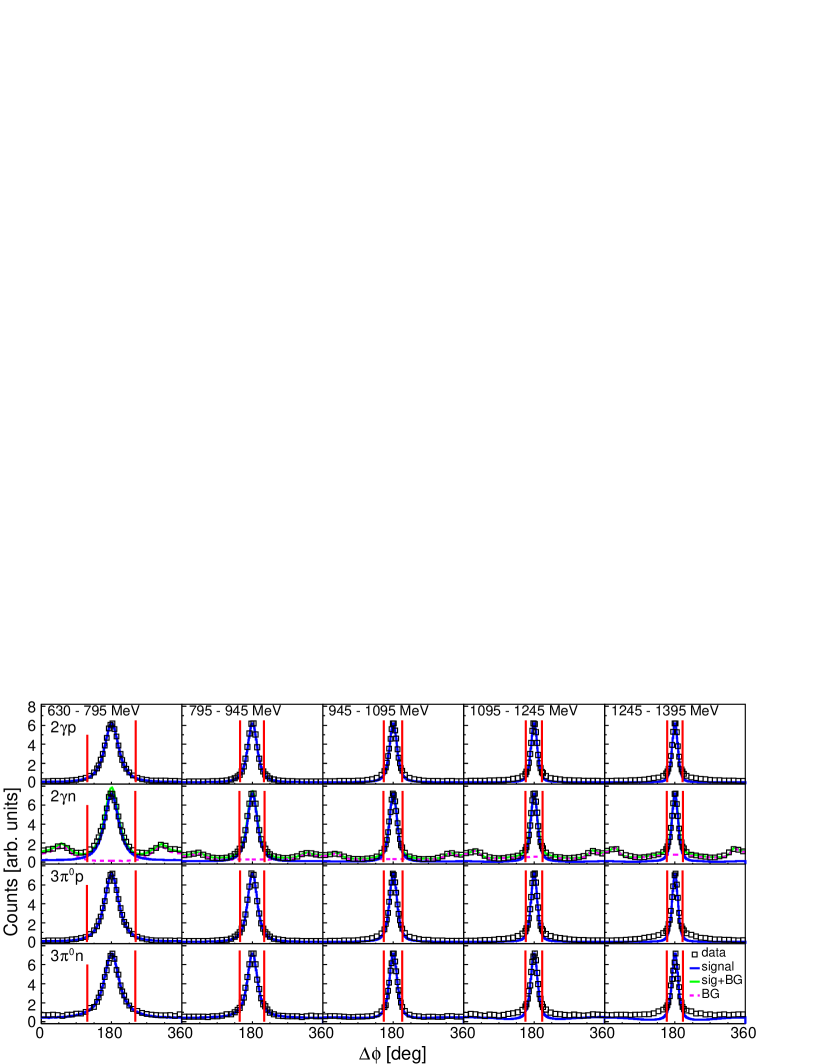
For the exclusive analyses (which are more important) a coplanarity cut involving the detected recoil nucleons can be established. Namely, it is required that the meson, the recoil nucleon, and the incoming photon lie in one plane. This can be translated into a condition on the azimuthal angle difference between meson and recoil nucleon using
| (4) |
where are the corresponding azimuthal angles of the two reconstructed particles in the lab frame. The resulting distributions are shown in Fig. 5 along with the applied cuts at . Because of the Fermi motion of the initial-state nucleons, the distributions are broader than in the analysis of free proton data. The distributions are very well reproduced by MC simulations. Significant background is only visible for the final state. It originates from the final state when one of the decay photons is misidentified as a neutron and the corresponding neutron assigned as a photon. Background reactions where all final-state particles have been detected and correctly identified will of course pass this cut.
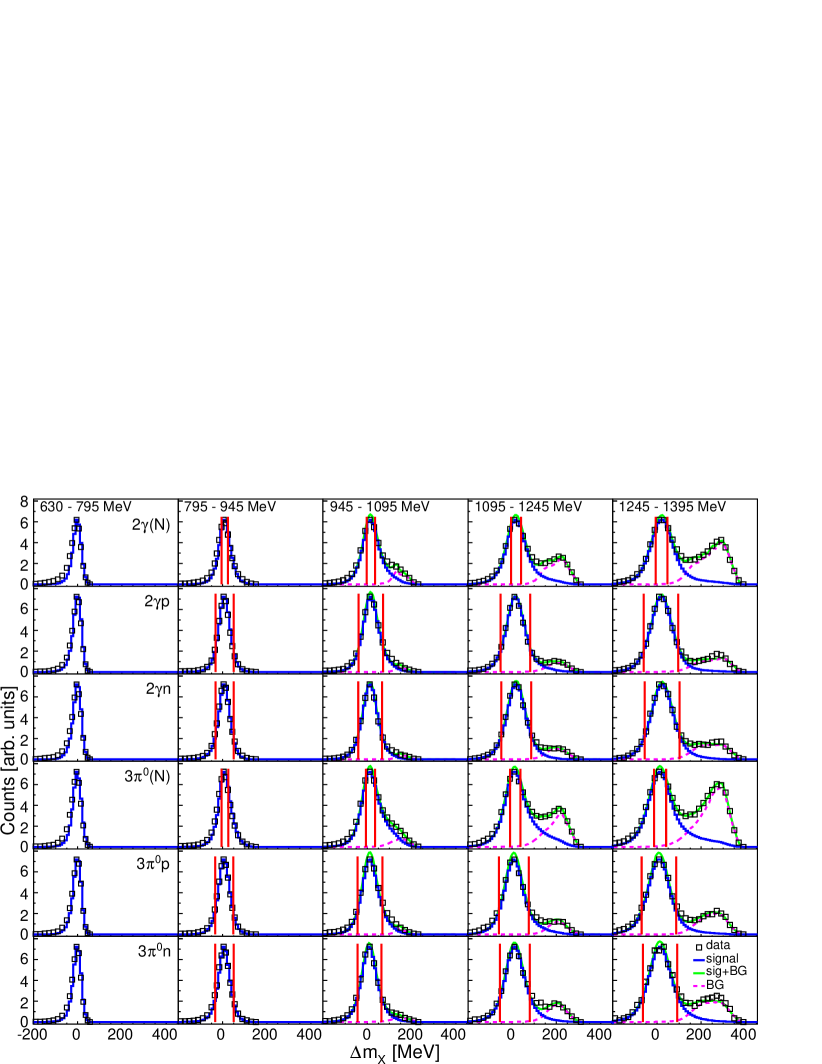
More sensitive is a cut on the missing mass of the reaction, which was calculated under the assumption of quasifree production of mesons off nucleons at rest via
| (5) |
where , are respectively the energy and momentum of the incident photon, , are respectively the reconstructed energy and momentum of the meson and is the mass of the recoil nucleon. The latter (no matter if detected or not) was treated as a missing particle. Effects from nuclear Fermi motion, which were ignored in this analysis, broaden the experimentally observed structures. Typical spectra for and decays in inclusive mode and in coincidence with recoil nucleons are summarized in Fig. 6. The reaction identification cuts discussed above were applied to these spectra. Events from quasifree -production peak around zero missing mass, while background from final states, where the pion escaped detection, appears at positive missing mass and increases strongly with incident-photon energy. Because of this energy dependence, -dependent symmetric cuts around the signal maximum were used. They account also for the small offsets (identical for data and MC simulations) of the peak positions from zero for higher incident photon energies.
The background from production (mainly charged pions) can pass all previous cuts when the charged pion is emitted with low energy or at small polar angle and escapes detection. In that case, the coplanarity cut does not help because either the energy of the pion is so low or its polar angle is so small that it does not disturb the azimuthal correlation between recoil nucleon and meson. Nevertheless, the coplanarity cut removes a significant fraction of the background as can be seen (Fig. 6) in the comparison of the missing mass spectra for the exclusive reactions (with coplanarity cut) to the inclusive reaction (without it). As a consequence, a very strict missing-mass cut was applied to the inclusive reactions whereas in the exclusive cases a broader cut was applied. For photon energies below the production threshold no cut was applied because no background was visible. Sufficient rejection of the background was checked using simulations of various production channels (their relative cross sections are known) that gave together with the simulated signal distributions a good description of the measured distributions (see green curves).
III.3 Additional checks
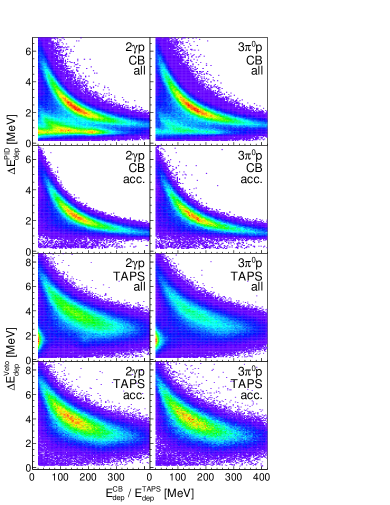
Right side: – distributions for protons: Left column: analyses. Right column: analyses. First row: protons in the CB (all events). Second row: protons in the CB (accepted events). Third row: protons in TAPS (all events). Fourth row: protons in TAPS (accepted events). Counts increase from violet to red.
So far only the information from the charged particle identification detectors (PID and TAPS-Veto) and the analysis have been used for particle identification. Further constraints on particle types can be obtained for hits in TAPS from a pulse-shape analysis (PSA) and a time-of-flight versus energy analysis, and for hits in TAPS and in the CB from analyses and from cluster-size analyses.
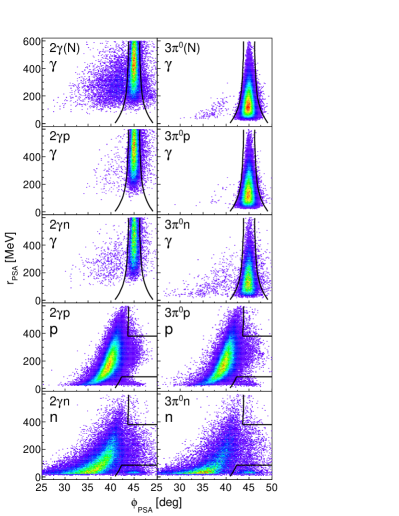
The PSA uses the fact that the pulse shape produced by protons and neutrons in BaF2 differs strongly from the signals coming from photons. This is due to the different mechanisms of energy deposition by these particles in matter. They result in different contributions to the slow ( ns) and the fast ( ns) scintillation light components of BaF2. Therefore, in the TAPS data acquisition the signals are integrated over two ranges (short gate: 40 ns, long gate: 2 s) giving two signal integrals—one containing mostly the short component and one containing the total signal. After an energy calibration based on photon signals, the short-gate energy and the long-gate energy can be compared to separate different particles. Convenient distributions are obtained by plotting the PSA-radius versus the PSA-angle using the transformations
| (6) |
The distributions for photon and nucleon candidates for all analyses are shown in Fig. 7. Since the calibration of was made by setting for photons, the photons are located at for all PSA-radii. The different mean energies of the decay photons originating from the and the decays are clearly represented by larger and smaller PSA-radii, respectively. Protons and neutrons are located at lower angles in bands showing a characteristic energy dependence. All analysis cuts discussed above were applied to the plotted distributions and very little background contamination is visible, hence the influence of the applied PSA cuts on the event selection is rather small. Some noticeable contamination was found in the nucleon spectra (in their lower, right corners) where low energy photons or electrons, which did not activate the veto detectors, are visible. However, no significant residue of the photon band was observed in these spectra.
With respect to the photon mean positions , cuts were established by fitting -distributions for different bins of PSA-radii. Photons were then only accepted within a -dependent band around . Accepted nucleons had to be located at smaller angles than the left photon cut position for MeV and MeV. For PSA-radii between these two values no cut was applied because high energy punch-through nucleons were located in this area. The cuts were kept so conservative because the background level already established by the other cuts was low and because the PSA analysis could not be included in the MC simulations as modeling of the two light components of BaF2 is not available.
Additional information on the detected particles provided by the various detectors, although not used for the application of cuts, was checked for signs of any deficiencies in the event selection.
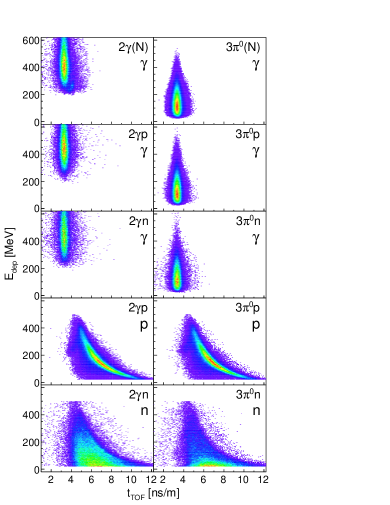
Because of the fast response of BaF2 the distance from the target was sufficient for TAPS to provide a useful time-of-flight (TOF) measurement. The deposited energy plotted versus inverse velocity, [ns/m], shows distinct distributions for the different particle types (left side of Fig. 8). Photons are located around 3.3 ns/m and the different energy of photons from the and decays is again clearly visible. For protons a fairly tight correlation between inverse velocity and deposited energy can be seen. Neutrons are located above 4 ns/m and do not show any correlation between time-of-flight and deposited energy (because the latter is more or less random). The neutron spectra at the bottom of Fig. 8 show no residual trace of the proton band indicating good separation between protons and neutrons in TAPS. Actually, none of the spectra shows significant background structures from other particle species, which demonstrates the good event selection by the previously discussed analysis cuts.
Detected proton candidates could additionally be checked using the deposited energy in the PID and Veto detectors. On the right side of Fig. 8 the corresponding distributions for candidates in the CB and TAPS are shown for both decay channel analyses. The spectra labeled ‘all’, where no analysis cuts were applied, can be compared to the spectra ‘acc’ representing the accepted events after all cuts. In the case of the CB, large background contaminations from charged pions and electrons are cleanly removed in the analysis. Resolution in TAPS is worse due to inferior optical coupling of the Veto scintillators; nevertheless, signatures of protons and electrons can be clearly identified. The latter are also effectively suppressed by the analysis cuts.
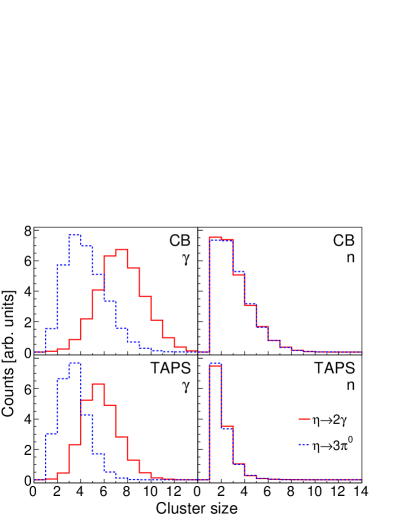
There is no direct event-by-event discrimination of photons and neutrons in the CB (no PSA and TOF has poor resolution due to the short flight path). The separation is entirely based on the analysis of the invariant masses of the ‘photon’ pairs. However, on average there is a distinction between photon and neutron hits by the size of the corresponding clusters, i.e., the number of activated detector modules. Most neutron clusters consist of four or fewer detector elements while high energy photons (from the decay) produce clusters of up to twelve crystals. The mean energy of the decay photons from the channel is smaller, therefore they produce smaller cluster sizes more similar to neutrons. The measured cluster size distributions for the CB and TAPS are shown in Fig. 9. As expected the cluster size distributions for photons are quite different for the two decay channels while they are very similar for neutrons. This is a strong indication that a clean photon-neutron separation was achieved, even for the CB where no PSA or TOF information could be used.
III.4 Final yield extraction
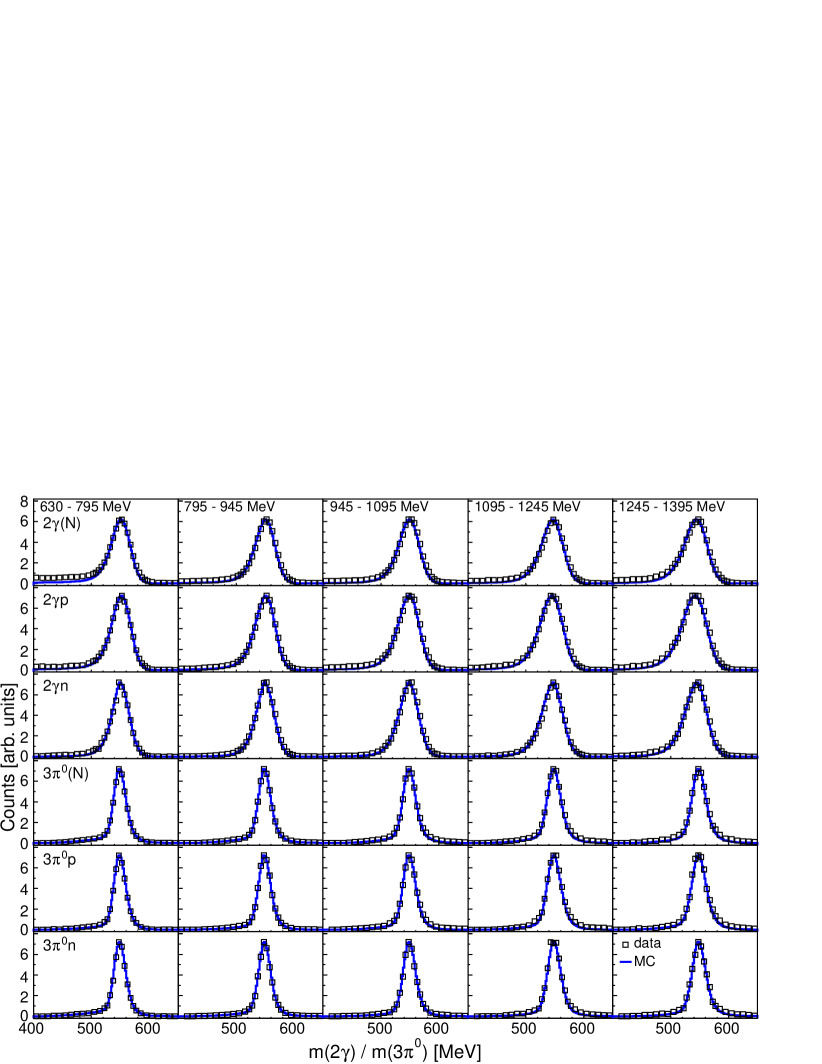
The final yields were extracted from invariant-mass spectra after the application of the cuts discussed above. Typical examples for the different reaction types for some energy ranges are shown in Fig. 10 and compared to the distributions obtained with MC simulations. The invariant-mass peaks from the exclusive analyses are almost background free. Small background components are most visible for the decay in the inclusive reaction. The residual backgrounds were subtracted by a fit made using the peak shape from the simulated distribution together with a polynomial background. For the extraction of angular distributions, the entire analysis procedure was of course done separately for each data point of the angular distribution.
III.5 reconstruction as final-state invariant mass
A full reconstruction of the kinematics was performed for the exclusive analyses. This method allowed a calculation of the Fermi momentum of the participant nucleon in the initial state. A cut on the momentum rejecting events with momenta above 80 MeV was used in a special version of the analysis (later referred to as type II) which attempted to optimize the resolution of the reconstruction. In the standard analysis no such cut was applied, partly due to the loss of statistics and because it introduces additional systematic effects in the extraction of the cross section close to threshold, where larger Fermi momenta play a crucial role.
Quasifree cross sections calculated as functions of the photon beam energy are affected by the Fermi motion of the initial-state nucleons, which are bound inside the deuteron. This means that a fixed value of corresponds to a distribution of center-of-mass energies due to the convolution with the Fermi momentum distribution. The resulting cross sections are then smeared compared to the fundamental cross sections at fixed values of . This loss of resolution is mainly a problem when sudden changes occur in the latter, as in photoproduction at threshold and in the region of interest around MeV. Therefore, in this work the ‘true’ center-of-mass energy was calculated by a full reconstruction of the reaction in impulse approximation from the final state Jaegle et al. (2011). For a limited angular region, could additionally be reconstructed using a time-of-flight measurement of the recoil nucleons.
From the measurement of the energies and directions of the decay photons, the four-momentum of the meson could be completely reconstructed. The same is in principle possible for final-state protons although a special calibration would be needed to deduce the kinetic energy from the energy deposition in the detector. As there is no correlation between the kinetic energy of neutrons and their deposited energy, a reconstruction of the neutron energies was not possible in this way. The energy of the recoil nucleon was thus treated as unknown in the reconstruction with only the measured angles used to reconstruct the direction of its momentum. This was done in the same way for protons and neutrons in order to maintain identical systematic uncertainties. Additional unknown quantities are the three components of the spectator nucleon momentum in the final state, leaving in total four unknown quantities since , all masses of the involved particles, and the momentum of the incident deuteron (at rest) are known. These four variables were determined from the four equations following from energy and momentum conservation. In this way, the three momenta of final-state participant (and spectator) nucleon and the final-state invariant mass of the recoil-nucleon-meson pair could be reconstructed in the plane-wave impulse approximation.
The kinetic energy of nucleons detected in TAPS could also be determined via a time-of-flight measurement. Regarding the different time resolutions of the detectors, the best measurement would be possible for events with a photon in TAPS along with the recoil nucleon. Due to the reaction kinematics and the experimental trigger, there are practically no such events in the analyses and only results with low statistics could be extracted in the analyses. Therefore, the main TOF results were deduced from time measurements relative to the tagger, which are affected by an inferior time resolution. TOF measurements were not possible for the CB because of the short flight path and the poor time resolution in the NaI(Tl) crystals. Due to this restriction, could only be reconstructed for polar angles in the center-of-mass frame with . Nevertheless, this independent method serves as a check for the reconstruction discussed above.
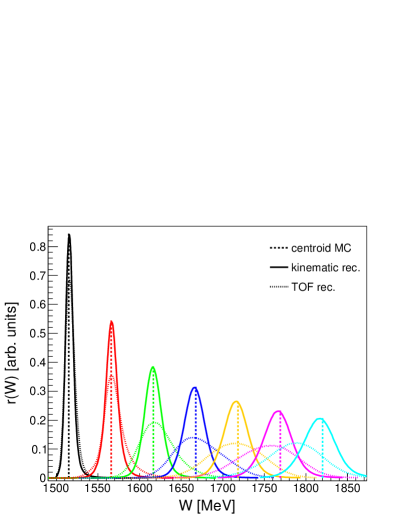
Cross sections as a function of reconstructed with the two discussed methods are no longer affected by nuclear Fermi motion but depend on the experimental resolution for the reconstructed . The resolution was investigated with MC simulations of the experimental setup (see section III.6). Phase-space events at several fixed values of (-functions) were generated and the responses of the detectors were modeled. The same analysis as used for experimental data was applied to the simulated data and the resulting distributions for from the analysis are summarized in Fig. 11.
The effects from the energy and angular resolution for the mesons enter into both analyses in the same way for the determination of the four-momentum. The resolution for the angle of the recoil nucleon also enters into both analyses via the definition of the direction of the nucleon momentum. All these factors increase the width of the observed distributions with rising . The angular resolution for the recoil nucleon degrades significantly above MeV where the majority of nucleons are detected in the CB for which the polar angle resolution is worse than in TAPS ( being similar). The final ingredient, the kinetic energy of the recoil nucleon, is determined from the kinematic reconstruction or from the TOF measurement. It is evident from Fig. 11 that the first method results in better resolution, in particular for larger values of . For the TOF reconstruction for higher energies even the centroids are shifted. This is due to the fact that the TOF resolution for neutrons is not very good (additional uncertainty is introduced because they can interact at any depth in the crystals and the TOF flight path is not very long) and that, at larger kinetic energies, the TOF-energy relation becomes so flat that small effects in TOF result in large uncertainties for the energies.
In the case of the kinematic reconstruction, the corresponding resolution for the analysis is slightly better—as it also is for the proton analyses. When approximated with Gaussians they all show a nearly linear rise from MeV at 1515 MeV to MeV at 1820 MeV.
In summary, a FWHM resolution of 30 MeV in the region of interest around MeV could be achieved with the kinematic reconstruction of the final-state invariant mass, while the TOF reconstruction yields an inferior resolution of about 70 MeV.
III.6 Extraction of cross sections
The obtained yields were normalized to differential cross sections by using the target surface density of 0.2304 nuclei/barn (0.147 nuclei/barn for one of the beam times), the flux of the incoming photon beam, the analysis-dependent detection efficiency and the decay branching ratios and , respectively J. Beringer et al. (2012) (Particle Data Group).
Right side: flux as a function of obtained from folding with the deuteron Fermi momentum distribution.
Yields for all bins in , and (with evaluated in the corresponding center-of-mass frame) were individually extracted by integrating the appropriate or invariant-mass histograms. Having applied all analysis cuts as discussed in Sec. III.2, these histograms were background-free for the exclusive analyses. In the case of the inclusive analyses, the background was non-negligible since no cuts on the recoil nucleon could be applied. Here, the signals were extracted using a fit of the distributions consisting of the combined peak shape from the simulated distribution and a second-order polynomial function for the background. Energy (but not ) dependent contributions to the yields originating from the target windows were subtracted using data that were measured while the target cell was empty. These contributions were about 5–7% and showed a rather smooth energy dependence.
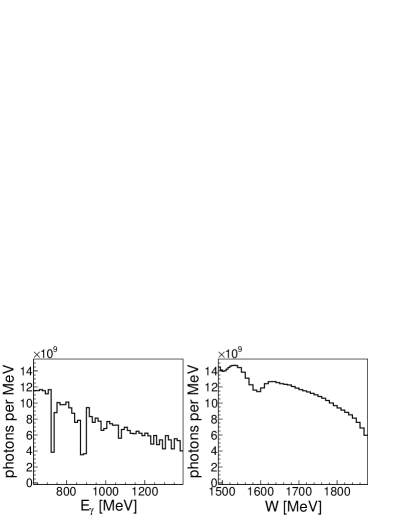
The photon flux on the target as a function of was calculated via
| (7) |
The number of electrons in the photon tagger was counted during the whole experiment. The so-called tagging efficiency , i.e., the fraction of correlated photons passing through the beam collimator, was determined in frequent, dedicated measurements at low beam intensity. Running at these conditions ensured that random electron coincidences were minimized, and that the photon detection efficiency of the lead-glass detector, which was moved into the photon beam, was still close to 100%. Besides these absolute values of the tagging efficiency, relative values were available at all times from the measured relative beam intensity using an ionization chamber placed at the end of the photon beam line. By normalization of the relative values to the absolute measurements, a time-dependent tagging efficiency was calculated. The resulting flux integrated over one of the beam times is shown as a function of at the left side of Fig. 12. For the normalization of the cross section obtained using either the kinematic or the TOF reconstruction, an effective photon flux as a function of had to be calculated. The effective distribution of values was calculated by folding the incoming photon beam energy distribution with the nucleon momentum distribution inside the deuteron. For the latter the wave function of the Paris – potential was used Lacombe et al. (1981). The resulting flux is shown at the right side of Fig. 12.
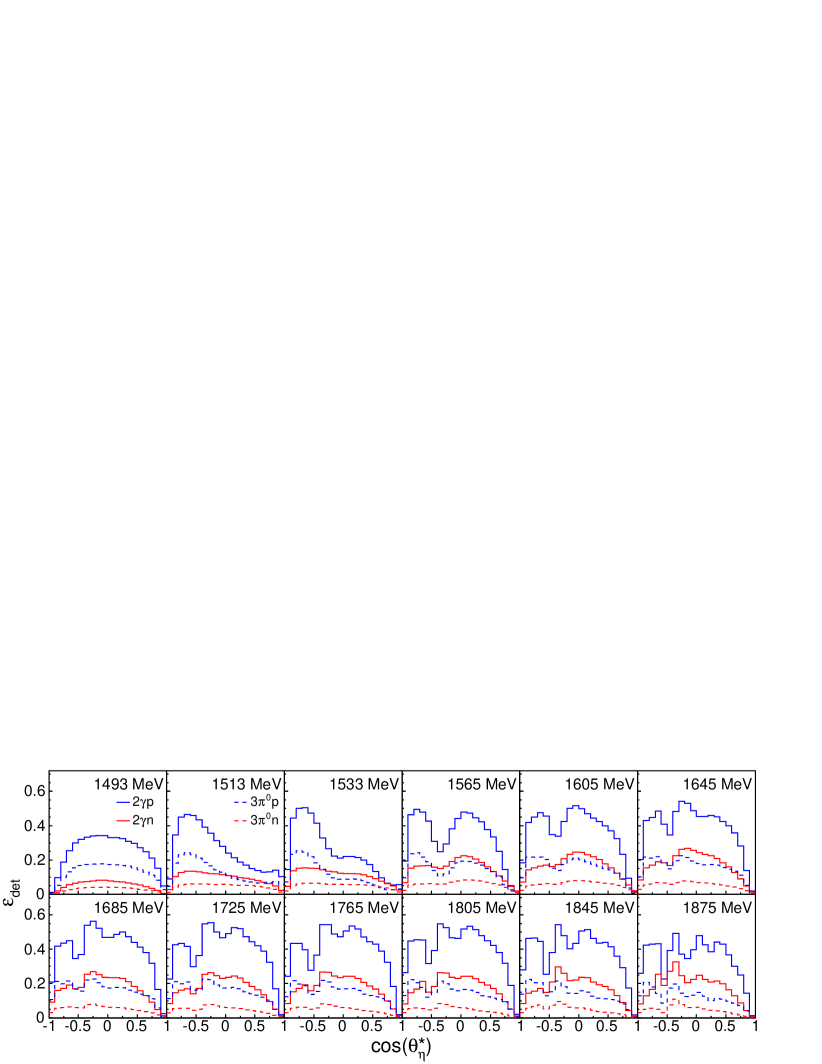
The detection efficiency was determined with a Geant4-based model Agostinelli et al. (2003) of the experimental setup. Events covering the complete phase space of quasifree production were generated and tracked by the simulation. The resulting detector information was analyzed using the same analysis as for real data. In addition, the experimental trigger conditions had to be modeled realistically. In fact, an even more restrictive implementation of the CB energy sum trigger was imposed (also on the experimental data), namely that only the decay photons were allowed to contribute. The same restriction was implemented for the hit multiplicity to avoid systematic differences in the proton and neutron analyses due to the different interaction of these particles with the detectors.
Subsequently, the detection efficiency was calculated as the ratio of detected and generated events for each bin of the excitation functions. Some examples are shown in Fig. 13 for the exclusive analyses. Special attention was given to the detection efficiencies of the recoil nucleons, as the systematic uncertainties of the hadronic models in the energy range covered by this experiment were suspected to be rather large. Especially the tracking of low energy neutrons through different materials requires specific and accurate cross sections for the nuclear reactions involved. The proton efficiencies are highly sensitive to the modeled detector geometries and material budgets as well. A measurement on a hydrogen target was used to check and correct the nucleon detection efficiencies obtained by simulation. For this purpose, relative corrections of the simulated nucleon efficiencies for the free reactions and were deduced from a comparison of hydrogen experimental data and the corresponding simulation, and applied in the deuteron analyses. For nucleons detected in TAPS corrections for recoil protons (neutrons) were on average around +7.3% (+12.1%) (the detection efficiency was overestimated by the simulation), while for the CB they were -1% (-3.5%) (underestimated on average by simulation). In the gap region between the CB and TAPS the corrected nucleon efficiencies were found to be still inaccurate. This corresponds to values of around for MeV where the sharp efficiency dependence on , especially for the proton, can be clearly seen in Fig. 13. As a solution, differential cross sections as functions of the lab polar angle of the nucleons were interpolated in the problematic regions and correction factors were calculated that were finally applied on an event-by-event basis in the analysis.
III.7 Systematic uncertainties
Common to all results are the global systematic uncertainties of the photon flux (3%), the target surface density (4%), the decay branching ratios ( 1%) and the approximately constant uncertainty of the empty target subtraction (2.5%). The systematic uncertainty in the photon flux mainly comes from the absolute measurements of the tagging efficiency and was estimated by the extreme values of the normalization of the relative flux measurements to the absolute measurements. The target surface density depends on the length of the target cell, which is subject to deformations when the target is cooled down. The systematic uncertainties of the decay branching ratios are almost negligible J. Beringer et al. (2012) (Particle Data Group). Due to the low statistics of the empty target runs, a conservative estimate of roughly half the relative yield contribution (2.5%) was made.
Several systematic uncertainties were found to be of rather different importance for the various analyses and showed a strong energy and dependence. Therefore, they were calculated individually and for all bins of the obtained cross sections. First, the CB energy sum trigger was found to be of great importance especially for the analysis. Its uncertainty was estimated by slightly different applications of the software model trigger in the analysis of simulated data. All analysis cuts were varied by and systematic uncertainties were estimated from the differences between the results. Uncertainties in the nucleon detection efficiencies were estimated taking into account effects of different hadronic models in Geant4, trigger and cut effects in the analysis of the hydrogen data used for the efficiency correction, and the influence of the correction applied for the data corresponding to the TAPS-CB gap region.
The many small systematic uncertainties from the different analysis steps were added quadratically and the result was added linearly to the uncertainties of the photon flux and the target density. The total uncertainty for the inclusive analysis shows almost no energy and dependence and is about 7%. The total uncertainty for the corresponding analysis falls from 11% at threshold to 7% at GeV above which it is constant. The reason for these increased values are the higher uncertainties in the backward region of , which are related to the CB energy sum trigger. The systematic uncertainties for the proton analyses are almost energy and independent (with the exception of the most forward angular bin and the CB-TAPS gap region located at for higher values of ) and are about 6–7%. The systematic uncertainties for the neutron analyses show a more pronounced energy and dependence. The total values for the () analysis are around 12% (15%) at threshold, have a local maximum of 13% (14%) near MeV, and fall more or less linearly to 9% (10%) at the maximum energy.
IV Results
The results presented in this section were obtained by combining the datasets from all three beam times. Furthermore, the data of the and analyses were averaged according to their statistical weights to calculate the final cross sections. Differential cross sections were extracted as functions of , and where was always evaluated in the corresponding center-of-mass frame. Total cross sections were obtained by fitting the angular distributions with Legendre polynomials.
IV.1 Cross sections as a function of
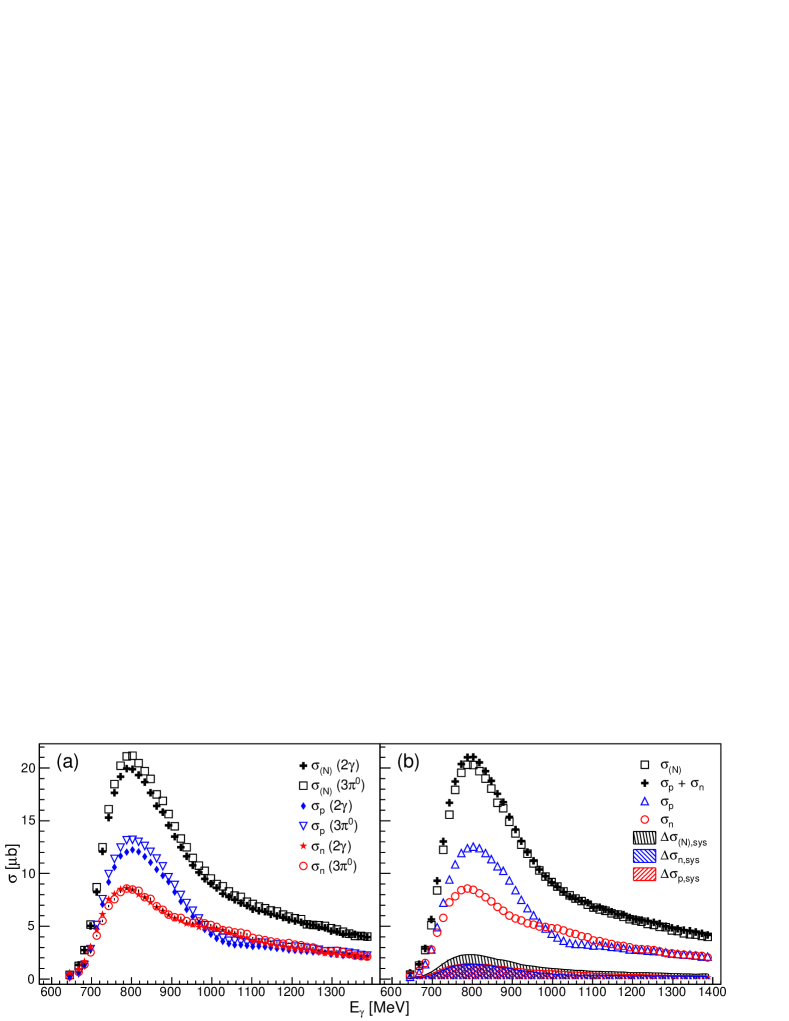
The total cross-section results are shown in Fig. 14. On the left side, the data from the two decay analyses are compared to each other. With the exception of the neutron data in the threshold region, the cross sections extracted from the analyses are slightly larger. This could be due to residual background from direct photoproduction (the invariant mass spectrum of direct production peaks in the S11(1535) region close to the -mass due to trivial kinematic relations). Other effects at lower photon beam energies could be caused by the CB energy sum trigger, whereas at higher energies cluster overlaps in the analyses could lead to systematic effects.
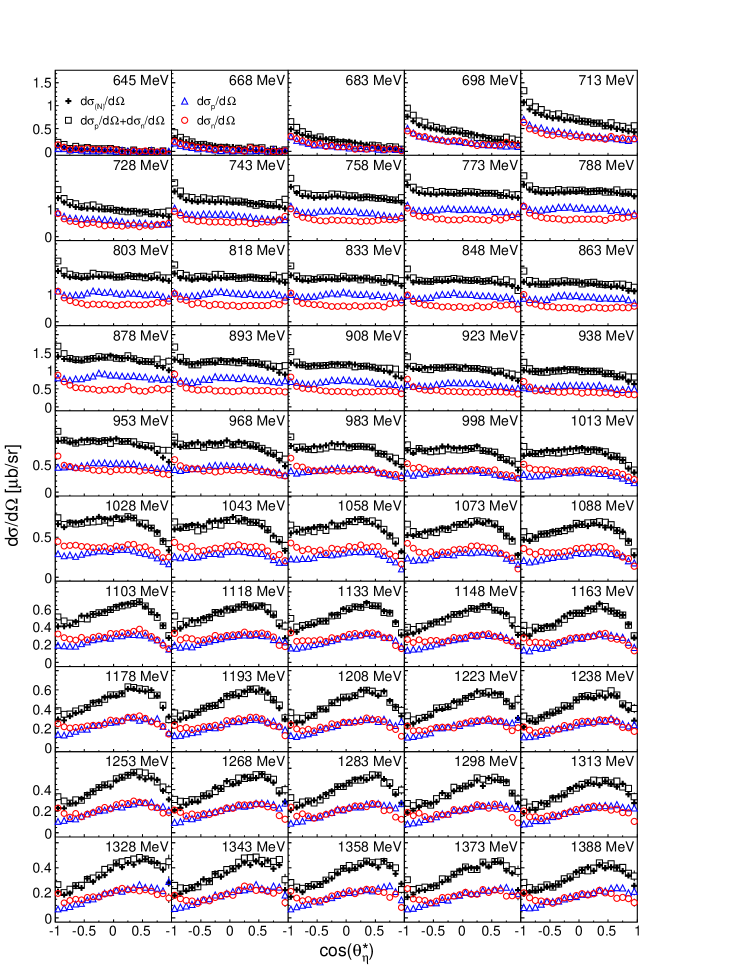
At the right side of Fig. 14, the data averaged over the decays are shown. The inclusive result and the sum of the proton and neutron cross sections are compared. Since the coherent production of mesons off the deuteron is very small Weiss et al. (2001), the two exclusive cross sections should add up to the inclusive data. Within a range of 10%, which is compatible with all of the involved systematic uncertainties, this is indeed the case. The good agreement is also clearly visible in the corresponding angular distributions that are shown in Fig. 15. In the region of the (1535) resonance ( 758–923 MeV) for example, the proton and neutron distributions are curved in opposite directions due to an interference with the (1520) with different signs Weiss et al. (2003). Their sum is flat which is reproduced by the direct inclusive measurement. Also at higher energies, the angular distributions of sum and direct measurement agree very well. This is a strong indication that systematic uncertainties, although quite large in case of the neutron data, are generally well under control.
IV.2 Cross sections as a function of
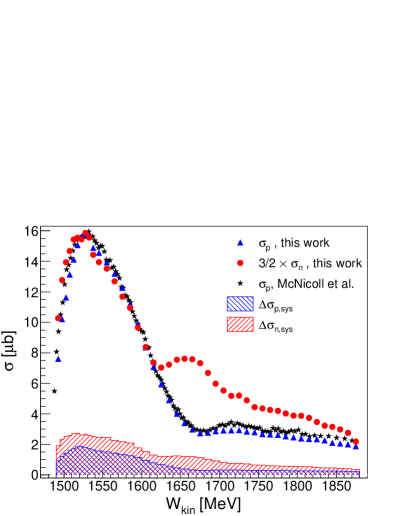
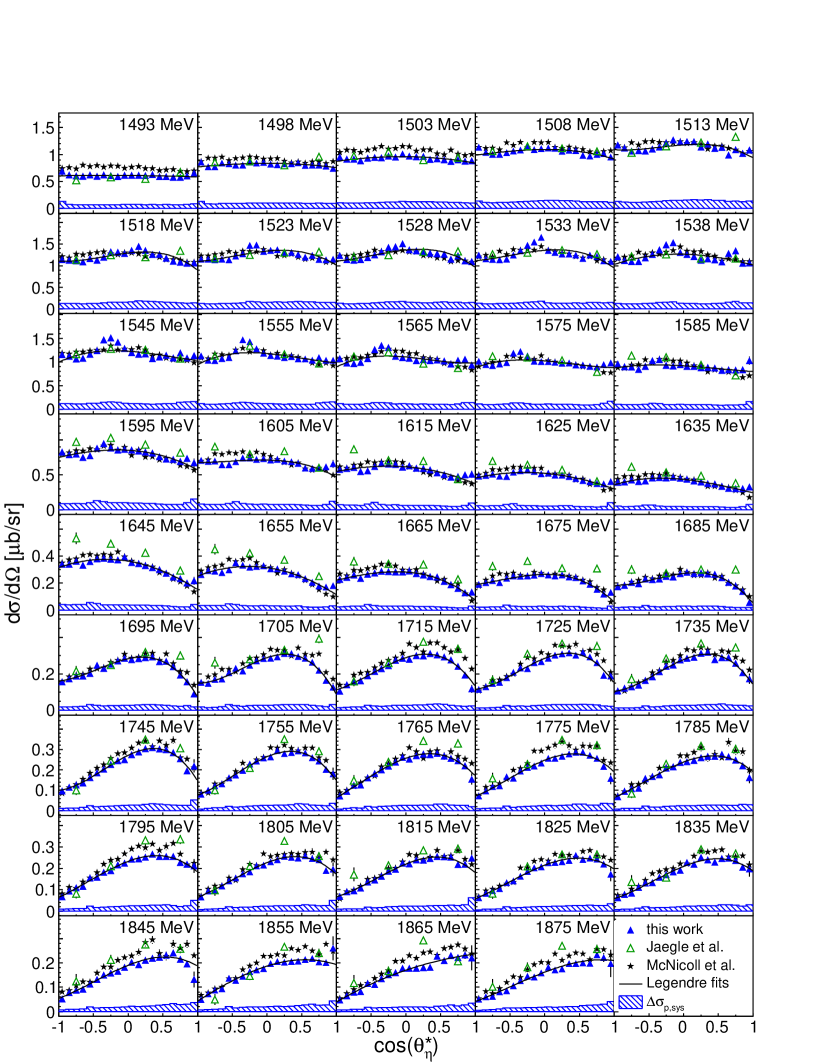
Fig. 16 shows the total cross sections as a function of the final-state invariant mass obtained using the kinematic reconstruction of the nucleon energies. As discussed before, no effects from Fermi motion should be present in these data—it should only be affected by the resolution of the reconstruction. Therefore, the proton data can be directly compared to data measured on the free proton target as, for example, obtained at MAMI-C McNicoll et al. (2010). The main characteristic features of the latter data are reproduced. There are some discrepancies at threshold, which are most probably due to the much poorer (ca. one order of magnitude) resolution in of the current analysis and the complicated proton detection efficiency in the region of the (1535) resonance. Above MeV the two data sets deviate by up to 15% for the highest measured invariant masses. The differential cross sections for are shown in Fig. 17 and also compared to the free proton data. In addition, the quasifree data obtained by the CBELSA/TAPS collaboration Jaegle et al. (2011) are plotted. The very precise angular distributions of McNicoll et al. (2010) are in general well reproduced by this work. Some residual effects from the uncertain proton detection efficiency in the CB-TAPS gap region are still visible. They are located in the energy bins for 1518 MeV 1655 MeV, first around and then slowly moving to backward angles up to . The issues in the determination of these data points are accounted for by increased systematic uncertainties. Altogether, the quasifree and free proton data agree quite well (for most kinematics within systematic uncertainties), which indicates that for this reaction channel nuclear effects from FSI are not important, so that the quasifree neutron data can be regarded as close approximation of the free cross sections. This is by no means trivial. In a similar investigation of photoproduction of mesons off nucleons bound in the deuteron Dieterle et al. (2014) substantial effects (on the order of 25%) were found and also production off nucleons bound in 3He nuclei is strongly affected by FSI Witthauer et al. (2013).
The total cross section for shown in Fig. 16 was scaled by to compensate for the known ratio Krusche et al. (1995b); Hoffmann-Rothe et al. (1997); Hejny et al. (1999) in the maximum of the (1535) resonance. The shapes of the corresponding peaks in the proton and neutron cross-section data are very similar. The small deviations are caused by the different systematic effects in the proton and neutron detection efficiencies. Above MeV the neutron cross section deviates strongly from the proton results and exhibits a pronounced peak-like structure around MeV. This structure, already observed by earlier measurements Kuznetsov et al. (2007); Miyahara et al. (2007); Jaegle et al. (2011), is thus confirmed by this work with much superior statistical significance.
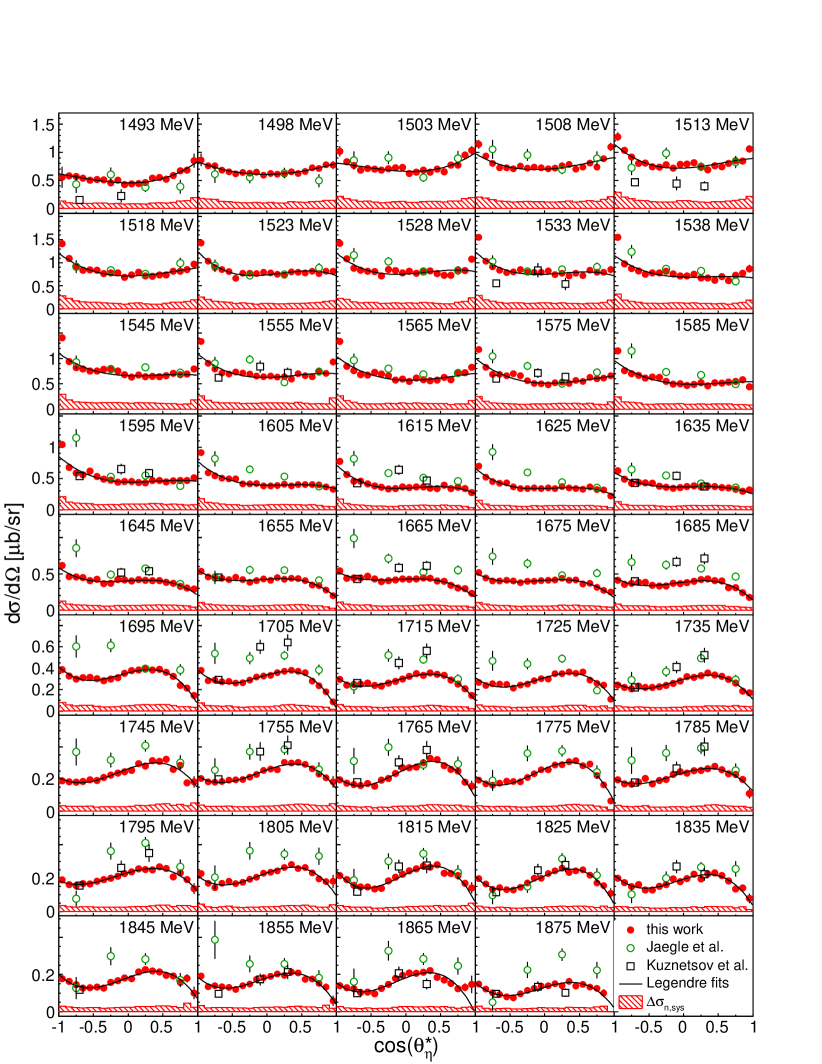
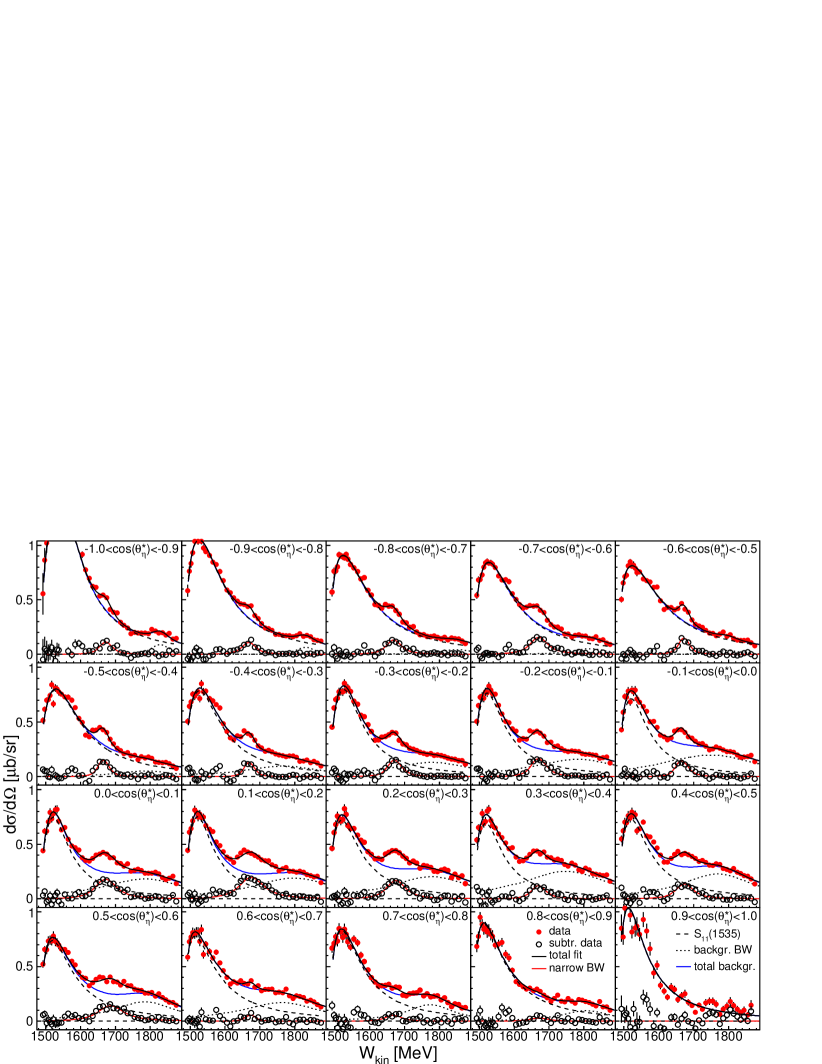
The corresponding differential cross sections for are shown in Fig. 18. The data from GRAAL Kuznetsov et al. (2007) and CBELSA/TAPS Jaegle et al. (2011) are plotted for comparison. There is reasonable agreement between all data in the region of the (1535) resonance. In the vicinity of the peak-like structure, some deviations between the different measurements are visible. Above around MeV, the agreement with the GRAAL data improves again. The much better statistical quality of the present data compared to the previous measurements is obvious from the figure.
IV.3 Properties of the structure
| [MeV] | [MeV] | [GeV-1/2] | |
| Kin. I | 16701 | 273 (503) | 12.10.8 |
| Kin. II | 16691 | 256 (445) | 11.81.0 |
| Kin. I | 16691 | 305 (494) | 12.90.8 |
| Kin. II | 16653 | 5317 (6614) | 15.62.7 |
| Best estimate | 16705 | 285 (5010) | 12.30.8 |
| TOF I | 16582 | (424) | 13.20.7 |
| TOF II | 16513 | (458) | 18.11.7 |
| TOF I | 16583 | (419) | 13.91.5 |
| TOF II | 16633 | (209) | 11.32.0 |
| Best estimate | 16587 | (4210) | 13.32.0 |
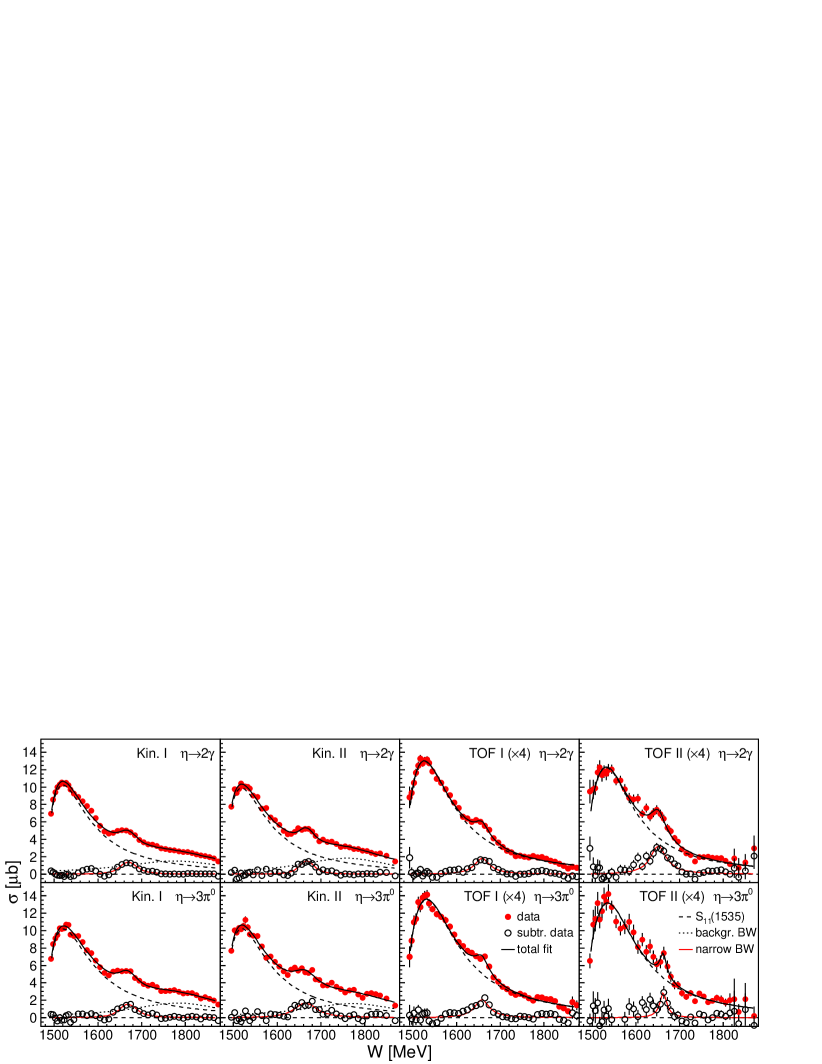
The nature of the narrow structure observed for the reaction around invariant masses of = 1670 MeV is not yet understood. The phenomenological properties of this structure were analyzed with the same simplified ansatz as in Jaegle et al. (2011). It consists of a Breit-Wigner (BW) function with energy-dependent width for the contribution of the (1535) resonance, a narrow standard BW function for the observed structure, and an additional broad BW function parameterizing the remaining background contributions at higher energies. The data obtained from the kinematic reconstruction and the reconstruction via TOF (for ) were fitted separately. It was found that the broad BW function was not needed to describe the data from the TOF reconstruction (this is so because those data are restricted to -backward angles where the background is much different from forward angles). Individual fits for the and data were performed. The results are shown in Fig. 19 and the extracted parameters for position , width , and electromagnetic coupling (multiplied by the square root of the unknown branching ratio ) assuming an state are summarized in Table 2. Kin. I, Kin. II and TOF I, TOF II represent datasets obtained with different analysis cuts, where in the sets II more strict cuts on the missing mass (), the - coplanarity () and the reconstructed Fermi momentum ( MeV) were applied (see Sec. III.2).
The data depending on were additionally analyzed with a fit taking into account the resolution of the reconstruction, which was estimated via simulation (see Sec. III.5). While the extracted parameters for position and coupling did not vary much so that they could be simply averaged, the extracted width was considerably reduced from around 50 MeV to 30 MeV. This indicates that a significant fraction of the observed width is related to the experimental resolution and that the intrinsic width is narrower. The width extracted this way can hence be seen as an approximation of the true width while the width obtained with the standard fit corresponds to an upper limit only.
With the exception of the parameters extracted from the Kin. II analysis of the channel, which suffer from a large reduction in statistics, all parameters corresponding to the kinematic reconstruction are in good agreement within statistical uncertainties. A slight improvement in resolution can be seen for the Kin. II analysis of the channel leading to smaller parameters for the width. No such effect can be seen in the data where the reliability of the fit seems to be reduced by lower statistics. A best estimate was calculated only taking into account the type I analyses, as they have better statistics than the type II analyses, and the values are shown in Table 2.
The data from the TOF reconstruction cover only of the solid angle resulting in much lower statistics. Nevertheless, they serve as an independent check for the presence and the properties of the structure. Somewhat lower values for the position and width were obtained. The coupling was estimated assuming an isotropic angular distribution, which (see Figs. 20,21) is only a rough approximation, but the results are in fair agreement with the other analysis. The smaller width is surprising since the resolution of the TOF reconstruction was estimated to be twice that of the kinematic reconstruction, although this is probably too pessimistic. The reason for the different parameter values will be discussed below. The fits of the data from the analyses with narrower cuts are less reliable due to poorer statistics. Therefore, as for the kinematic reconstruction method, only the type I data were used to deduce a total best estimate of the parameters.
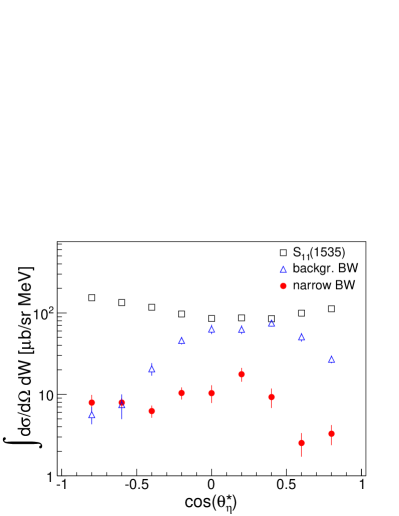
In Fig. 20 the differential cross sections are presented as a function of for different bins of . The same phenomenological fits as discussed above were performed to reveal the angular dependence of the structure. The position varies between MeV at backward angles and MeV at forward angles. Also the width is reduced at backward angles. This explains the lower values for position and width also observed in the results of the TOF reconstruction where . On the one hand, the shifting position disfavors the scenario of a single resonance. On the other hand, it could also be caused by the simplified ansatz for the phenomenological fitting (which does of course not include any interference effects). The angular dependence of the strength of the narrow structure is shown in Fig. 21. Due to the simplified ansatz this is only a qualitative indication for the variation of the strength over the angular distribution. The figure shows the contributions of the three fit components integrated over the excitation energy. The ‘’ contribution shows the expected behavior (since only one BW function was used this reflects effectively the contribution from the and the - interference, which peaks at forward and backward angles and has a minimum around ). The phenomenological background subsumes contributions from higher lying - and -states, their interferences, and non-resonant background and has therefore no simple interpretation. The angular dependence of the narrow structure does not agree with the most simple scenarios for its nature, e.g., not with a narrow state interfering with the broad states. The angular distribution of a state is isotropic and the interference term between and is proportional to . The resulting angular distribution would thus have a maximum at forward angles and a minimum at backward angles or vice versa (depending on the sign of the interference). However, Figs. 20,21 show that the structure almost vanishes at extreme forward angles and is also small at extreme backward angles. Its largest contribution lies between . A recent fit of the Bonn-Gatchina partial wave analysis Anisovich et al. (2014) reproduced the peak-like structure in the total cross section and also the angular distributions in the corresponding energy range. In this solution the bump in the total cross section is caused by interference effects in the partial wave. This interpretation requires a sign change (relative to the value given by PDG J. Beringer et al. (2012) (Particle Data Group)) of the electromagnetic coupling of the (1650) for the neutron.
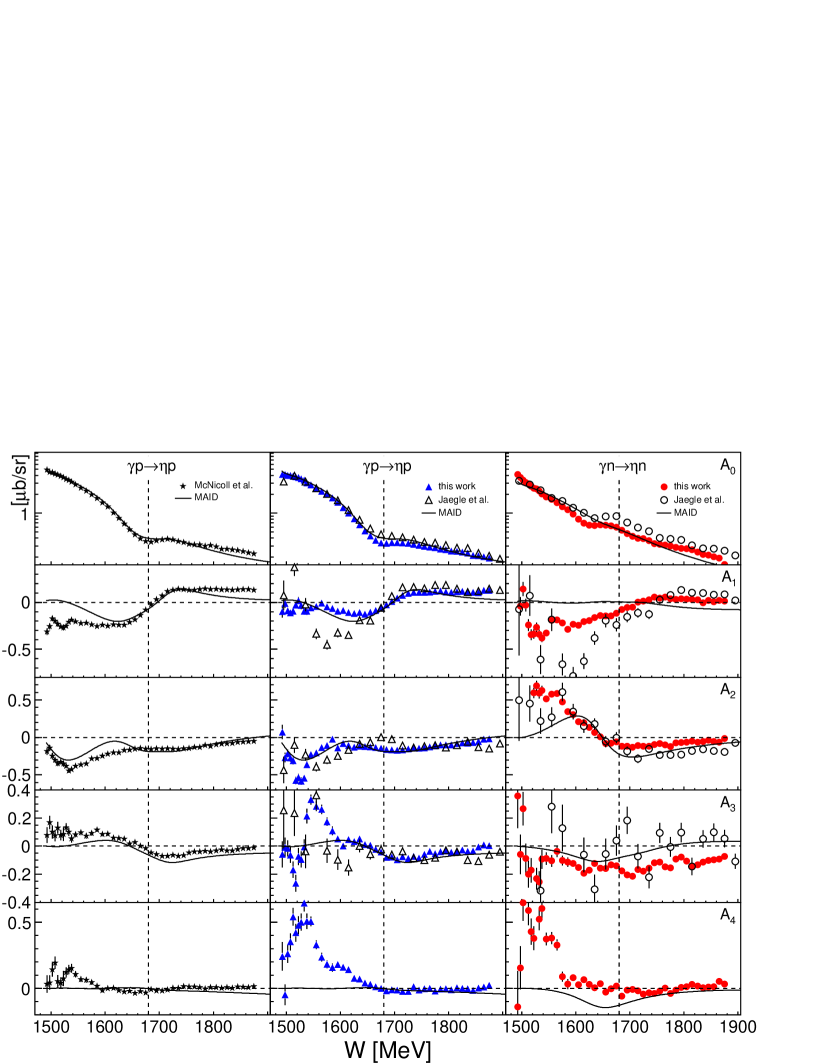
Finally, a comparison of the Legendre coefficients is shown in Fig. 22. The were obtained by fitting the angular distributions with a series of Legendre polynomials up to fourth order
| (8) |
where and are the and photon momenta in the center-of-mass frame, respectively. The data from the exclusive proton and neutron analyses are plotted along with those from CBELSA/TAPS Jaegle et al. (2011) and the free proton measurement from MAMI-C McNicoll et al. (2010). The energy dependences of the proton data of this work are in general close to the latter, which indicates that cross sections can be reliably extracted from measurements in quasifree kinematics. Below MeV, some larger discrepancies especially for and are observed. This is probably caused by the proton detection efficiency which is problematic in this region, as discussed in Sec. III.6. Nevertheless, above this energy, there is better agreement and also the data from CBELSA/TAPS are close to our results. The description of the proton data by the MAID model Chiang et al. (2002) is, as expected, reasonable.
As already seen in the neutron differential cross section data, there are some discrepancies between the current results and those from CBELSA/TAPS, although the general trends are confirmed. The most significant discrepancy (note the logarithmic scale) is in the coefficient, which (apart from the phase-space factor ) is proportional to the total cross section. The sign changes in the vicinity of MeV of and are reproduced. In case of the latter, the different signs for proton and neutron at low energies are due to interference between the (1535) and the (1520) resonances Weiss et al. (2003). is proportional (neglecting other contributions) to the helicity couplings of these states, which have equal signs for protons and neutrons for the (1520) state, whereas they are opposite for the (1535) resonance. This is more or less reproduced by MAID, while the model fails in the description of . In the discussion of the results from electroproduction the change of sign in was interpreted as - wave interference Denizli et al. (2007). If only ( multipole) and ( multipole) states are considered, would be directly proportional to . A change of sign would then mean that the relative phase between the two multipoles is changing rapidly due to one of them passing through a resonance. The rough picture of given by the CBELSA/TAPS measurement is now clarified by the better statistical quality of the present results. The coefficient seems to be negative throughout the entire energy region.
V Summary and conclusions
Differential and total cross sections of photoproduction off the proton and the neutron were simultaneously measured in quasifree kinematics on a deuteron target from threshold up to GeV. The mesons were identified using the two neutral decays and . Exclusive measurements were performed by detecting the recoil nucleons. The total dataset included events of inclusive production as well as events with coincident protons and events with coincident neutrons. With the inclusive measurement, the systematic uncertainties of the nucleon detection efficiencies could be checked via knowing that coherent contributions are very small. Effects from Fermi motion were avoided by a reconstruction of the center-of-mass energy from the final state. The technical procedure of a kinematic reconstruction of the kinetic energy of the recoil nucleons was cross-checked by a time-of-flight measurement. Both methods are only affected by the corresponding detector resolution, which for the kinematic reconstruction was determined by MC simulations to be MeV (FWHM). The results for are mostly in good agreement with data from inclusive hydrogen measurements taking into account the poorer resolution in and effects from the complicated proton efficiency. The results for are of unprecedented statistical quality and confirm the existence of a peak in the total cross section at MeV with a width of MeV. Correcting for the finite experimental resolution gave an estimate of the intrinsic width of MeV. If the structure would be related to a single state its strengths would correspond to . However, the precise differential cross sections revealed that the strength depends on ; in particular it is suppressed at extreme backward and forward angles which disfavors such a scenario. More sophisticated partial-wave analyses of the data are under way. First results in the framework of the BnGn model Anisovich et al. (2014) describe the data better with a scenario where the main effect is related to interferences in the sector than with the introduction of a narrow state. However, also in this approach contributions from other partial waves are needed to reproduce the non-trivial angular distributions.
We wish to acknowledge the outstanding support of the accelerator group and operators of MAMI. This work was supported by Schweizerischer Nationalfonds (200020-132799, 121781, 117601, 113511), Deutsche Forschungsgemeinschaft (SFB 443, SFB/TR 16), DFG-RFBR (Grant No. 05-02-04014), UK Science and Technology Facilities Council, (STFC 57071/1, 50727/1), European Community-Research Infrastructure Activity (FP6), the U.S. DOE, U.S. NSF, and NSERC (Canada).
References
- J. Beringer et al. (2012) (Particle Data Group) J. Beringer et al. (Particle Data Group), Phys. Rev. D 86, 010001 (2012).
- Anisovich et al. (2012) V. A. Anisovich et al., Eur. Phys. J. A 48, 15 (2012).
- Workmann et al. (2012) R. Workmann et al., Phys. Rev. C 86, 015202 (2012).
- Moorehouse (1966) R. G. Moorehouse, Phys. Rev. Lett. 16, 772 (1966).
- Krusche et al. (1995a) B. Krusche et al., Phys. Rev. Lett. 74, 3736 (1995a).
- Renard et al. (2002) F. Renard et al., Phys. Lett. B 528, 215 (2002).
- Dugger et al. (2002) M. Dugger et al., Phys. Rev. Lett. 89, 222002 (2002).
- Crede et al. (2005) V. Crede et al., Phys. Rev. Lett. 94, 012004 (2005).
- Nakabayashi et al. (2006) T. Nakabayashi et al., Phys. Rev. C 74, 035202 (2006).
- Bartalini et al. (2007) O. Bartalini et al., Eur. Phys. J. A 33, 169 (2007).
- Crede et al. (2009) V. Crede et al., Phys. Rev. C 80, 055202 (2009).
- Williams et al. (2009) M. Williams et al., Phys. Rev. C 80, 045213 (2009).
- McNicoll et al. (2010) E. F. McNicoll et al., Phys. Rev. C 82, 035208 (2010).
- Chiang et al. (2002) W.-T. Chiang et al., Nucl. Phys. A 700, 429 (2002).
- Chiang et al. (2003) W.-T. Chiang et al., Phys. Rev. C 68, 045202 (2003).
- Anisovich et al. (2005) V. Anisovich et al., Eur. Phys. J. A 25, 427 (2005).
- Ajaka et al. (1998) J. Ajaka et al., Phys. Rev. Lett. 81, 1797 (1998).
- Bock et al. (1998) A. Bock et al., Phys. Rev. Lett. 81, 534 (1998).
- Bartholomy et al. (2007) O. Bartholomy et al., Eur. Phys. J. A 33, 133 (2007).
- Elsner et al. (2007) D. Elsner et al., Eur. Phys. J. A 33, 147 (2007).
- Sumihama et al. (2009) M. Sumihama et al., Phys. Rev. C 80, 052201(R) (2009).
- Krusche et al. (1997) B. Krusche et al., Phys. Lett. B 397, 171 (1997).
- Weiss et al. (2003) J. Weiss et al., Eur. Phys. J. A 16, 275 (2003).
- Krusche and Schadmand (2003) B. Krusche and S. Schadmand, Prog. Part. Nucl. Phys. 51, 399 (2003).
- Krusche et al. (1995b) B. Krusche et al., Phys. Lett. B 358, 40 (1995b).
- Hoffmann-Rothe et al. (1997) P. Hoffmann-Rothe et al., Phys. Rev. Lett. 78, 4697 (1997).
- Weiss et al. (2001) J. Weiss et al., Eur. Phys. J. A 11, 371 (2001).
- Pfeiffer et al. (2004) M. Pfeiffer et al., Phys. Rev. Lett. 92, 252001 (2004).
- Hejny et al. (1999) V. Hejny et al., Eur. Phys. J. A 6, 83 (1999).
- Hejny et al. (2002) V. Hejny et al., Eur. Phys. J. A 13, 493 (2002).
- Capstick (1992) S. Capstick, Phys. Rev. D 46, 2864 (1992).
- Burkert et al. (2003) V. Burkert et al., Phys. Rev. C 67, 035204 (2003).
- Anisovich et al. (2013a) V. A. Anisovich et al., Eur. Phys. J. A 49, 67 (2013a).
- Shrestha and Manley (2012) M. Shrestha and D. M. Manley, Phys. Rev. C 86, 055203 (2012).
- Diakonov et al. (1997) D. Diakonov, V. Petrov, and Polyakov, Z. Phys. A 359, 305 (1997).
- Polyakov and Rathke (2003) M. Polyakov and A. Rathke, Eur. Phys. A 18, 691 (2003).
- Arndt et al. (2004) R. A. Arndt et al., Phys. Rev. C 69, 035208 (2004).
- Kuznetsov et al. (2007) V. Kuznetsov et al., Phys. Lett. B 647, 23 (2007).
- Miyahara et al. (2007) F. Miyahara et al., Prog. Theor. Phys. Suppl. 168, 90 (2007).
- Jaegle et al. (2008) I. Jaegle et al., Phys. Rev. Lett. 100, 252002 (2008).
- Jaegle et al. (2011) I. Jaegle et al., Eur. Phys. J. A 47, 89 (2011).
- Anisovich et al. (2013b) A. Anisovich et al., Phys. Lett. B 719, 89 (2013b).
- Shklyar et al. (2007) V. Shklyar, H. Lenske, and U. Mosel, Phys. Lett. B 650, 172 (2007).
- Shyam and Scholten (2008) R. Shyam and O. Scholten, Phys. Rev. C 78, 065201 (2008).
- Anisovich et al. (2009) V. A. Anisovich et al., Eur. Phys. J. A 41, 13 (2009).
- Döring and Nakayama (2010) M. Döring and K. Nakayama, Phys. Lett. B 683, 145 (2010).
- Choi et al. (2006) K.-S. Choi et al., Phys. Lett. B 636, 253 (2006).
- Fix et al. (2007) A. Fix, L. Tiator, and M. V. Polyakov, Eur. Phys. J. A 32, 311 (2007).
- Werthmüller et al. (2013) D. Werthmüller et al., Phys. Rev. Lett. 111, 232001 (2013).
- Herminghaus et al. (1976) H. Herminghaus et al., Nucl. Instr. Meth. 138, 1 (1976).
- Kaiser et al. (2008) K.-H. Kaiser et al., Nucl. Instr. Meth. A 593, 159 (2008).
- Oberle et al. (2013) M. Oberle et al., Phys. Lett. B 721, 237 (2013).
- Anthony et al. (1991) I. Anthony et al., Nucl. Instr. Meth. A 301, 230 (1991).
- Hall et al. (1996) S. J. Hall et al., Nucl. Instr. Meth. A 368, 698 (1996).
- McGeorge et al. (2008) J. C. McGeorge et al., Eur. Phys. J. A 37, 129 (2008).
- Starostin et al. (2001) A. Starostin et al., Phys. Rev. C 64, 055205 (2001).
- Novotny (1991) R. Novotny, IEEE Trans. Nucl. Science 38, 379 (1991).
- Gabler et al. (1994) A. R. Gabler et al., Nucl. Instr. Meth. A 346, 168 (1994).
- Watts (2005) D. Watts, Calorimetry in Particle Physics, Proceedings of the 11th International Conference, Perugia, Italy, 2004, World Scientific, Singapore p. 560 (2005).
- Witthauer et al. (2013) L. Witthauer et al., Eur. Phys. J. A 154, 49 (2013).
- Lacombe et al. (1981) M. Lacombe et al., Phys. Lett. B 101, 139 (1981).
- Agostinelli et al. (2003) S. Agostinelli et al., Nucl. Instr. Meth. A 506, 250 (2003).
- Dieterle et al. (2014) M. Dieterle et al., Phys. Rev. Lett. 112, 142001 (2014).
- Anisovich et al. (2014) A. Anisovich, E. Klempt, V. Nikonov, A. Sarantsev, and U. Thoma, arXiv:1402.7164 [nucl-ex] (2014).
- Denizli et al. (2007) H. Denizli et al., Phys. Rev. C 76, 015204 (2007).