New Clues to the Cause of Extended Main Sequence Turn-Offs in Intermediate-Age Star Clusters in the Magellanic Clouds11affiliation: Based on observations with the NASA/ESA Hubble Space Telescope, obtained at the Space Telescope Science Institute, which is operated by the Association of Universities for Research in Astronomy, Inc., under NASA contract NAS5-26555
Abstract
We use the Wide Field Camera 3 onboard the Hubble Space Telescope (HST) to obtain deep, high resolution images of two intermediate-age star clusters in the Large Magellanic Cloud of relatively low mass () and significantly different core radii, namely NGC 2209 and NGC 2249. For comparison purposes, we also re-analyzed archival HST images of NGC 1795 and IC 2146, two other relatively low mass star clusters. From the comparison of the observed color-magnitude diagrams with Monte Carlo simulations, we find that the main sequence turnoff (MSTO) regions in NGC 2209 and NGC 2249 are significantly wider than that derived from simulations of simple stellar populations, while those in NGC 1795 and IC 2146 are not. We determine the evolution of the clusters’ masses and escape velocities from an age of 10 Myr to the present age. We find that differences among these clusters can be explained by dynamical evolution arguments if the currently extended clusters (NGC 2209 and IC 2146) experienced stronger levels of initial mass segregation than the currently compact ones (NGC 2249 and NGC 1795). Under this assumption, we find that NGC 2209 and NGC 2249 have estimated escape velocities km s-1 at an age of 10 Myr, large enough to retain material ejected by slow winds of first-generation stars, while the two clusters that do not feature extended MSTOs have km s-1 at that age. These results suggest that the extended MSTO phenomenon can be better explained by a range of stellar ages rather than a range of stellar rotation velocities or interacting binaries.
Subject headings:
galaxies: star clusters — globular clusters: general — Magellanic Clouds1. Introduction
Recently, deep Color-Magnitude Diagrams (CMDs) from images taken with the Advanced Camera for Survey (ACS) aboard the Hubble Space Telescope (HST) revealed that several massive intermediate-age ( 1 – 2 Gyr old) star clusters in the Magellanic Clouds host extended and/or multiple main sequence turn-offs (MSTOs) regions (Mackey et al. 2008a; Glatt et al. 2008; Milone et al. 2009; Goudfrooij et al. 2009; Goudfrooij et al. 2011a, hereafter G11a; Piatti 2013), in some cases accompanied by composite red clumps (Girardi et al. 2009; Rubele et al. 2011). A popular interpretation of these extended MSTOs (herafter eMSTOs) is that they are due to stars that formed at different times within the parent cluster, with an age spread of 150 – 500 Myr (Milone et al. 2009; Girardi et al. 2009; Rubele et al. 2010, 2011; G11a). Other potential causes of eMSTOs mentioned in the recent literature include spreads in rotation velocity among turn-off stars (Bastian & de Mink 2009; Yang et al. 2013, but see Girardi et al. 2011), a photometric feature of interacting binary stars (Yang et al. 2011), or a combination of both (Li et al. 2012).
A relevant aspect of the nature of the eMSTO phenomenon among intermediate-age star clusters is that it is not shared by all such clusters (e.g., Milone et al. 2009, G11a). In this context, two scenarios have been proposed in the recent literature to predict the existence of eMSTOs in intermediate-age clusters. Keller et al. (2011, hereafter K11) noted that the eMSTOs known at the time were all hosted by intermediate-age clusters that have a large core radius ( pc), and suggested that such a large core radius is a prerequisite for hosting an eMSTO. Their argument is based on simulations of star cluster formation indicating that the mass loss due to stellar evolution in a primordially mass-segregated cluster can lead to a significant cluster core expansion and low central density (Mackey et al., 2008b). Since mass segregation is also expected to be a function of the cluster mass (e.g., Bonnell & Bate, 2006), K11 suggested that the clusters with the largest core radii represent the initially most mass-segregated (and hence likely most massive) clusters to have formed. In a similar but not identical argument, Goudfrooij et al. (2011b, hereafter G11b) suggest that the key factor to explain the presence of intermediate-age clusters hosting an eMSTO is the cluster’s ability to retain the material ejected by first-generation stars that are thought to be responsible for the formation of a second generation (often called “polluters”). Following the arguments of G11b, eMSTOs can be formed only if the cluster escape velocity was higher than the wind velocity of such polluter stars when the latter existed.
Currently, the most popular candidates for first-generation “polluters” are (i) intermediate-mass AGB stars (, hereafter IM-AGB; e.g., D’Antona & Ventura 2007, and references therein), (ii) rapidly rotating massive stars (often referred to as “FRMS”; e.g. Decressin et al. 2007) and (iii) massive binary stars (de Mink et al., 2009). Wind velocities of these stars must be compared with the cluster escape velocity derived at the same time these stars were present in the cluster (i.e. at ages of 5 – 30 Myr for massive stars and 50 – 200 Myr for IM-AGB stars).
We note that massive () intermediate-age star clusters do not provide very strong constraints to the cause of the presence of eMSTOs. This is due to the fact that most of them contain large core radii which renders both scenarios to predict the presence of eMSTOs in those clusters. On the other hand, low-mass (i.e. ) star clusters can provide important insights into the nature of eMSTOs, especially when selecting such clusters with a variety of core radii. With this in mind, we present the analysis of new two-color HST Wide Field Camera 3 (WFC3) photometry of two intermediate-age star clusters in the Large Magellanic Cloud (LMC) of relatively low mass and significantly different radii, namely NGC 2209 and NGC 2249. Keller et al. (2012) used ground-based Gemini/GMOS photometry to study NGC 2209; the authors identified an eMSTO, but the limited spatial resolution prevented them from a detailed analysis of the MSTO morphology in the inner regions of the cluster. For comparison purposes, we also re-analyzed archival HST/ACS images of two other relatively low mass star clusters, namely NGC 1795 and IC 2146, for which Milone et al. (2009) already showed that they do not exhibit an eMSTO. We conduct a detailed investigation of the MSTO morphology of the four clusters, comparing the observed CMDs with Monte Carlo simulations in order to quantify the widths of MSTO regions and verify whether they can be reproduced by a simple stellar population (SSP). Moreover, we study the evolution of the clusters’ masses and escape velocities from an age of 10 Myr to their current age. This analysis allows us to reveal new findings relevant to the causes for the formation and retention of second-generation stars in these intermediate-age star clusters.
The remainder of this paper is organized as follows: Section 2 presents the clusters’ observations and data reduction. In Section 3 we present CMDs of the four clusters and the comparison with Monte Carlo simulations. In Section 4 we derive the evolution of the clusters’ masses and escape velocities as a function of age, using models with and without initial mass segregation. Finally, in Section 5 we present and discuss our main results.
2. Observations and Data Reduction
NGC 2209 and NGC 2249 were observed with HST on 2013 May 23 and 2013 November 11, respectively, using the UVIS channel of the WFC3 as part of HST program 12908 (PI: P. Goudfrooij). The clusters were centered on one of the two CCD chips of the WFC3 UVIS camera, so that the observations cover enough radial extent to study variations with cluster radius and to avoid the loss of the central region of the clusters due to the CCD chip gap. Two long exposures were taken in each of the F438W and F814W filters: for NGC 2209, their exposure times were 850 s (F438W filter) and 485 s (F814W filter). For NGC 2249, they were 825 s and 425 s, respectively. In addition, we took one short 60 s exposure in F814W for each cluster in order to avoid saturation of the brightest RGB and AGB stars. The two long exposures in each filter were spatially offset from each other by 2401 in a direction +8576 with respect to the positive X-axis of the CCD array. This was done to move across the gap between the two WFC3/UVIS CCD chips, as well to simplify the identification and removal of hot pixels and cosmic rays. In addition to the WFC3/UVIS observations, we used the Wide Field Camera (WFC) of ACS in parallel to obtain images from the cluster centers. These images have been taken in the same filters used for the prime observations of the cluster (i.e., F435W and F814W). The ACS exposure times were adjusted in order to hide the parallel buffer dumps without sacrificing the target S/N of the WFC3 images. These ACS images provide valuable information of the stellar content and Star Formation History (SFH) in the underlying LMC field, permitting us to establish in detail the field star contamination fraction in each region of the CMDs. They also allow a valuable measurement of the “background” stellar surface density in the context of our King model fits (see Section 4). For NGC 1795 and IC 2146, we retrieved the STScI MAST archive images collected with ACS/WFC as part of the HST program GO-9891 (PI: G. F. Gilmore). Descriptions of those observations and datasets is reported in Table 1 of Milone et al. (2009).
The reduction of the images of NGC 2209 and NGC 2249 was performed following the method described in Kalirai et al. (2012). Briefly, we started from the flt files provided by the HST pipeline. The flt files constitute the bias-corrected, dark-subtracted and flat-fielded images. We then corrected all the flt files for charge transfer inefficiency, using the CTE correction software111http://www.stsci.edu/hst/wfc3/tools/cte_tools. We generated distortion-free images using MultiDrizzle (Fruchter & Hook, 1997) and we calculated the transformations between the individually drizzled images to link them to a reference frame (i.e.: the first exposure) in each filter. The transformations were based on Gaussian-fitted centroids of hundreds of stars on each image and the solution was refined through successive matches. The final transformations provide alignment of the individual images to better than 0.02 pixels. These offsets were then supplied to a final run of MultiDrizzle as a “shift” file and added to the WCS header information. Finally, bad pixels and cosmic rays are flagged and rejected from the input images, and a final image is created for each filter, combining the input undistorted and aligned frames. The final stacked images were generated at the native resolution of the WFC3/UVIS and ACS/WFC (i.e.: 0040 pixel-1 and 0049 pixel-1, respectively). For NGC 1795 and IC 2146, we used the drc files produced by the HST/ACS pipeline.
Stellar photometry was performed on the stacked images, using the stand-alone versions of the DAOPHOT-II and ALLSTAR point spread function (PSF) fitting programs (Stetson, 1987, 1994). The final catalog is based on first performing aperture photometry on all the sources that are at least 3 above the local sky, then deriving a PSF from bright isolated stars in the field, and finally applying the PSF to all the sources detected in the aperture photometry list. The final catalogs contain sources that were iteratively matched between the two images, and have been cleaned by eliminating background galaxies and spurious detections by means of and sharpness cuts from the PSF fitting.
To perform the photometric calibration, we used a sample of bright isolated stars to transform the instrumental PSF-fitted magnitudes to a fixed aperture of 10 pixels (040 for WFC3/UVIS, 049 for ACS/WFC). The magnitudes were then transformed into the VEGAMAG system by adopting the relevant synthetic zero points for the WFC3/UVIS and ACS/WFC bands.
To quantify incompleteness, we used the standard technique of adding artificial stars to the images and running them through the photometric pipeline. A total of nearly 120000 artificial stars were added to each image. In order to leave the crowding conditions unaltered, only of the total number of stars in the final catalogs were added per run; the overall distribution of the inserted artificial stars followed that of the stars in the image. The artificial stars were distributed in magnitude according to a luminosity function similar to the observed one and with a color distribution covering the full color ranges found in the CMDs. After inserting the artificial stars, the photometry procedures described above were applied again to the image. An inserted star was considered recovered if the input and output magnitudes agreed to within 0.75 mag in both filters. Completeness fractions were assigned to every individual star in a given CMD by fitting the completeness fractions as a function of the magnitude and distance from the cluster center.
3. Color-Magnitude Diagrams and Monte Carlo Simulations
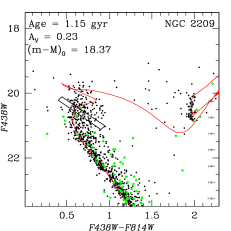
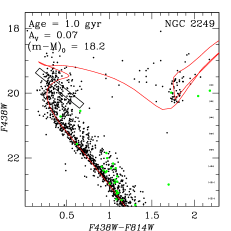
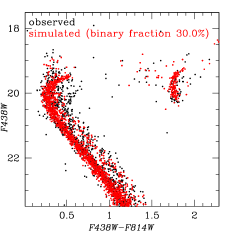
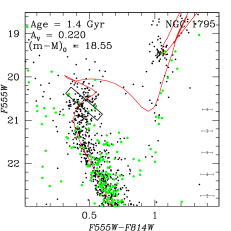
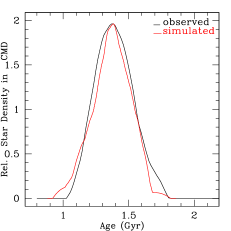
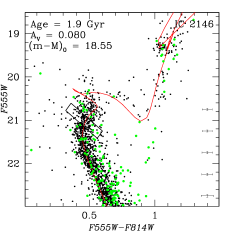
CMDs for the four star clusters are presented in the left panels of Fig. 1. We plot the stars within a core radius (except for NGC 2249, for which we plot stars within the effective radius ), based on the King (1962) model fits (derived as described in Sect. 4 below). Best-fit isochrones from Marigo et al. (2008) are superposed onto the clusters’ CMDs, along with the derived age, distance modulus and visual extinction . Isochrone fitting has been performed using the methods described in (Goudfrooij et al., 2009, G11a). Briefly, we used the observed difference in magnitude between the MSTO and the red clump (RC); we selected all the isochrones for which the value of this parameter lies within of the measured uncertainty of that parameter in the CMDs. For the set of isochrones that satisfy our selection criteria (on average 5 – 10 isochrones), we found the best-fit values for distance modulus and reddening, by means of a least square fitting program to the magnitudes and colors of the MSTO and RC. Finally, we overplotted the isochrones onto the CMDs and through a visual examination we selected the best-fitting one. To assess the level of contamination of the underlying LMC field population, we selected regions near the corners of the image, with the same surface area as that adopted for the cluster stars. Stars located in these regions have been superposed on the clusters’ CMDs (shown as green dots in the left panels of Fig 1). The contamination in NGC 2209 and NGC 2249 is very low, while it is more pronounced in NGC 1795 and IC 2146, but for all the four clusters is mainly confined to the lower (faint) part of the clusters’ MS.
Fig. 1 shows that the MSTO regions of NGC 2209 and NGC 2249 are fairly wide, whereas the MS of single stars fainter than the turnoff is well defined and much narrower. This difference is even more evident if we compare the MSTO regions of these clusters with that of NGC 1795 and IC 2146. These two clusters have a quite compact MSTO, for which the morphology seems consistent with that of a single stellar population. Magnitude and color errors are shown in the left panels of Fig. 1: photometric errors at the MSTO magnitude level are between 0.02 and 0.04 mag in color (F438W – F814W or F555W – F814W, ), far too small to account for the broadening of the MSTO region seen in NGC 2209 and NGC 2249. Moreover, reddening values are quite small and the narrow morphology of the RC features shows that differential reddening effects are negligible. Hence, the width of the MSTO in these two clusters seems to strongly exclude a simple stellar population, and in the context of the scenario described in the introduction, indicate the presence of multiple stellar generations.
To constrain this picture further in terms of whether or not a single population can reproduce the observed CMDs and to quantify the width of the eMSTO, we conducted Monte Carlo simulations of synthetic clusters with the properties implied by the isochrones fitting.
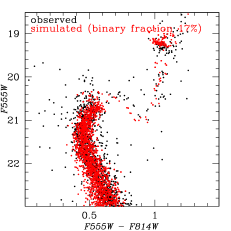
We simulated a SSP with a given age and chemical composition by populating an isochrone with stars randomly drawn from a Salpeter mass function and normalized to the observed number of stars according to the completeness. To a fraction of these sample stars, we added a component of unresolved binary stars drawn from the same mass function, using a flat distribution of primary-to-secondary mass ratios. To estimate the binary fraction in each cluster, we used the width of the upper MS, i.e. the part between the MSTO region and the TO of the background stellar population. We estimated that the internal systematic uncertainty in the binary fraction is of the order of 5%; for the purpose of this work, the results do not change significantly within 10% of the binary fraction. Finally, we added photometric errors, derived using the photometric error distribution of our artificial stars test.
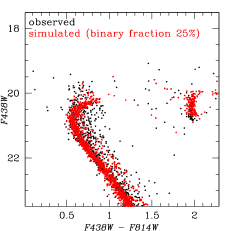
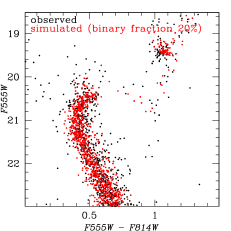
The comparison between the observed and simulated CMDs is shown in the middle panels of Fig. 1. The adopted binary star fraction is also reported for each cluster. Overall, the SSP simulations reproduce several CMDs features quite well in the four clusters, such as for example the MS and the RC. However, the middle panels of Fig. 1 clearly show that the MSTO regions in NGC 2209 and NGC 2249 are significantly wider than that of their respective SSP simulations. Conversely, the MSTO regions of NGC 1795 and IC 2146 are very well reproduced by their SSP simulation.
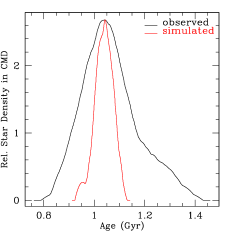
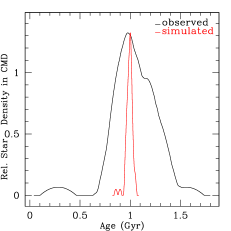
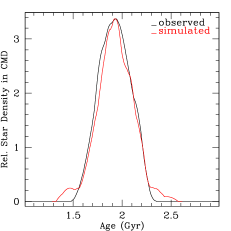
In order to compare in detail the observed and simulated MSTO regions, we created their “pseudo-age” distributions (see G11a for a detailed description). Briefly, pseudo-age distributions are derived by constructing parallelograms across the MSTOs with one axis approximately parallel to the isochrones and the other approximately perpendicular to them (parallelograms for each clusters are illustrated in left panels of Fig. 1). The (, ) and (, ) coordinates of the stars within the parallelogram are then transformed into the reference coordinate frame defined by the two axes of the parallelogram. The same procedure is then applied to the isochrone tables to set the age scale along this vector. A polynomial least-square fit between age and the coordinate in the direction perpendicular to the isochrones then yields the pseudo-age distributions. This procedure is applied both to the observed and simulated CMDs.
The derived pseudo-age distributions are shown in the right panels of Fig. 1. These were calculated using the non-parametric Epanechnikov-kernel probability density function (Silverman, 1986), in order to avoid biases that can arise if fixed bin widths are used. As expected, for NGC 1795 and IC 2146 the observed pseudo-age distributions are very well reproduced by the simulated ones. Conversely, the observed pseudo-age distributions for NGC 2209 and NGC 2249 are significantly wider than the simulated ones: the stellar age distributions peak near the location of the best-fit isochrone and then decline slower than the prediction of the single stellar generation distributions. They do so slower towards older ages than towards younger ages. The pseudo-age distributions of the observed clusters are quite smooth, suggesting that the morphologies of the MSTO regions can be better explained with a spread in age rather than by two discrete bursts of star formation. This is similar to the findings of G11a for their 7 clusters.
Our detection of an eMSTO in NGC 2209 confirms the finding by Keller et al. (2012) who used and -band imaging taken at Gemini-South. Due to the crowding in the inner regions at ground-based spatial resolution, Keller et al. (2012) only used stars in an annulus with radii from the cluster center, which is outside the cluster’s half-light radius. Our results show that the eMSTO feature in NGC 2209 extends all the way into the core, where the relative contamination by field stars is much smaller.
As to the non-detection of an eMSTO in NGC 1795 and IC 2146, it was shown by Keller et al. (2011) and G11a that the width of pseudo-age distributions of simulated SSPs scales approximately with the logarithm of the cluster age. This renders the ability to detect a given age spread to be age dependent, becoming harder for older clusters. However, at the age of the oldest cluster in our sample (IC 2146, 1.9 Gyr), an age spread = 200 Myr yields = 0.105, which is well above the detection limit for the data (see G11a). This confirms the simple stellar population nature of NGC 1795 and IC 2146.
4. Insights From Histories of Cluster Mass Loss and Escape Velocity
As stated in the Introduction, the photometric evidence available to date led to two main types of scenarios to explain the eMSTO phenomenon: scenarios that involve the formation of a second generation of stars, and scenarios that do not. The former type of scenarios consists of two subtypes: (i) the scenario of K11 who suggested that eMSTO can only be hosted by intermediate-age star clusters with current core radii larger than a certain threshold value (i.e.. 3.7 pc). We refer to this scenario as the “core radius threshold” scenario hereinafter; and (ii) the “escape velocity threshold” scenario of G11b who proposed that eMSTO can only be hosted by clusters for which the escape velocity of the cluster was higher than the wind velocities of the stars thought to provide the material used by the second generations of stars, at the time such stars were present in the cluster. The scenarios that do not involve extended star formation consist of (i) the “stellar rotation” scenario first suggested by Bastian & de Mink (2009) and (ii) the “interactive binaries” scenario of Yang et al. (2011). Noting that these different scenarios imply different predictions on the dependence of eMSTO properties on the clusters’ dynamical properties, we proceed to determine structural parameters and masses of our sample clusters.
4.1. Structural Parameters of the Clusters
We first determine completeness-corrected radial number density distributions of stars for the four clusters in our sample following Goudfrooij et al. (2009). We determine the clusters’ center creating a two dimensional histogram of the pixel coordinates using a bin size of pixels, and then calculating the center using a two-dimensional Gaussian fit to an image constructed from the surface number density values in the two-dimensional histogram. This method avoids biases related to the presence of bright stars near the center. The cluster’s ellipticity is derived by running the task ellipse within IRAF/STSDAS222STSDAS is a product of the Space Telescope Science Institute, which is operated by AURA for NASA. on the surface number density images mentioned above. The area sampled by the images is then divided in a series of concentric elliptical annuli, centered on the clusters center. The spatial completeness of each annulus is divided out in the process. For NGC 2209 and NGC 2249 the outermost data point is derived from the ACS parallel observations, in a field located 55 from the cluster center. We fit the radial surface number density profile using a King (1962) model combined with a constant background level, described by the following equation:
| (1) |
where is the central surface number density, is the core radius, is the King concentration index ( being the tidal radius), and is the geometric mean radius of the ellipse (, where a is the semi-major axis of the ellipse). The best-fit King models for the four clusters, selected using a minimization routine, are shown in Fig. 2, along with the derived surface number density values and other relevant parameters.
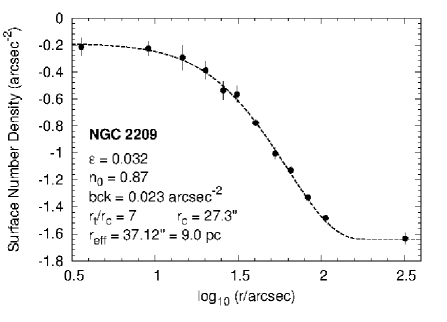
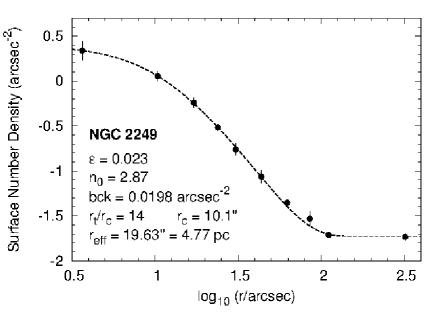
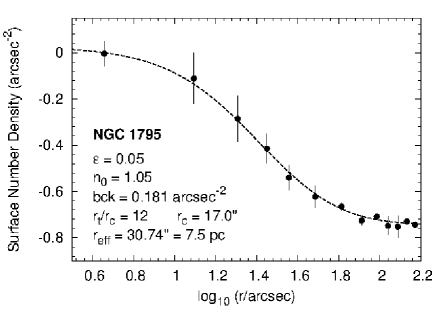
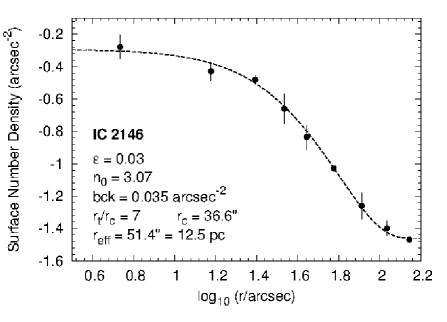
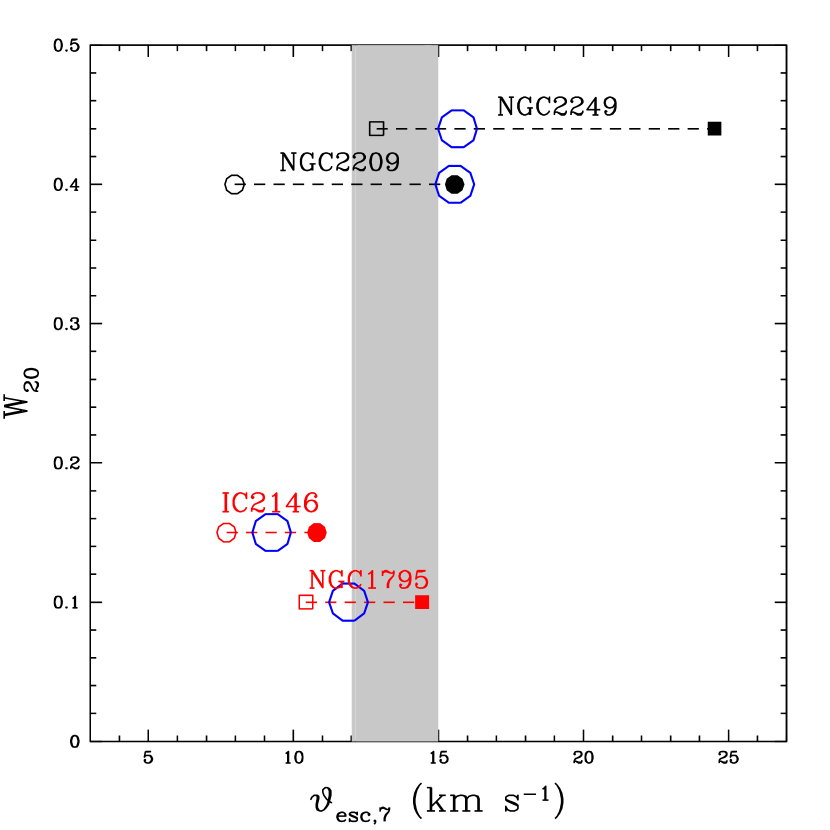
Fig. 2 shows some interesting results. First of all, the two clusters hosting an eMSTO, NGC 2209 and NGC 2249, have a very different core radius. While NGC 2209 is currently extended (i.e.: pc), NGC 2249 is currently compact (i.e.: pc). Second, the core radii of the two clusters in our sample that do not exhibit an eMSTO, NGC 1795 and IC 2146, are also interesting in the context of constraining different scenarios. While NGC 1795 has a moderately large core radius ( pc), IC 2146 is very extended ( pc, the most extended in our sample). Taking these results at face value, it seems that the “core radius threshold” scenario can not fully account for the presence of eMSTOs in intermediate-age star clusters. Specifically, under the hyphothesis that a cluster can host an eMSTO only if it has a radius larger than a certain value ( 3.7 pc), we would have expected to detect eMSTOs in NGC 1795, NGC 2209, and IC 2146, and not in NGC 2249 for which the derived core radius is significantly smaller than the threshold value. Instead, eMSTOs are not detected in NGC 1795 and IC 2146, while an eMSTO is detected in NGC 2249.
4.2. Present-Day Masses and Dynamical Evolution
To verify whether the “escape velocity threshold” scenario can provide a valid explanation on the formation of eMSTO, we estimate cluster masses and escape velocities as a function of time, going back to an age of 10 Myr, after the cluster has survived the era of violent relaxation and when the most massive stars of the first generation, proposed to be candidate polluters in the literature (i.e., FRMS and massive binary stars), are expected to start losing significant amounts of mass through slow winds.
Current cluster masses are determined from integrated-light -band magnitudes listed in Table 1. Aperture corrections for these magnitudes are determined from the best-fit King model for each cluster by calculating the fraction of total cluster light encompassed by the measurement aperture. After aperture correction, cluster masses are calculated from the values of , and age listed in Table 1. This is done by interpolation between the values in the SSP model tables of Bruzual & Charlot (2003), assuming a Salpeter (1955) initial mass function.
| Cluster | V | Aper. | Aper. corr. | [Z/H] | Age | |||
|---|---|---|---|---|---|---|---|---|
| (1) | (2) | (3) | (4) | (5) | (6) | (7) | (8) | (9) |
| NGC 2209 | 13.15 0.15 | 31 | 1.00 | -0.30 | 0.23 | 1.15 | 6.64 0.34 | 9.02 0.46 |
| NGC 2249 | 12.23 0.15 | 31 | 0.26 | -0.46 | 0.07 | 1.00 | 2.46 0.04 | 4.77 0.08 |
| NGC 1795 | 12.67 0.15 | 31 | 0.63 | -0.30 | 0.20 | 1.40 | 4.13 0.61 | 7.47 1.23 |
| IC 2146 | 13.10 0.15 | 50 | 0.76 | -0.30 | 0.08 | 1.90 | 8.89 1.36 | 12.53 1.92 |
Dynamical evolution calculations of the star clusters is done following the prescriptions of G11b. Briefly, we evaluated the evolution of cluster mass and effective radius for model clusters with and without initial mass segregation. The latter property plays a fundamental role in terms of cluster mass loss and the early evolution of cluster core radii (e.g., Mackey et al., 2008b; Vesperini et al., 2009). The dynamical evolution calculations cover an age range between 10 Myr and 13 Gyr and take into account the effects of stellar evolution mass loss and internal two-body relaxation. For each cluster, we listed in Table 2 the results obtained with a level of initial mass segregation of (where is the effective radius of stars with M⊙) versus those without initial mass segregation. Escape velocities listed in Table 2 are determined for every cluster by assuming a single-mass King model with a radius-independent ratio333We acknowledge that this will underestimate somewhat the values for clusters with significant mass segregation. as calculated above from the clusters’ best-fit age and [/H] values. Escape velocities are calculated from the reduced gravitational potential, , at the core radius. Here is the potential at the tidal (truncation) radius of the cluster. For convenience, we define , and refer to it as “early escape velocity”.
| log () | (km s-1) | ||||||
|---|---|---|---|---|---|---|---|
| Cluster | Current | 107 yr w/o m.s. | 107 yr with m.s. | Current | 107 yr w/o m.s. | 107 yr with m.s. | 107 yr “plausible” |
| (1) | (2) | (3) | (4) | (5) | (6) | (7) | (8) |
| NGC 2209 | 4.40 0.07 | 4.53 0.07 | 4.94 0.07 | 6.1 0.5 | 7.97 0.5 | 15.56 0.5 | 15.56 0.5 |
| NGC 2249 | 4.48 0.07 | 4.64 0.07 | 5.04 0.07 | 9.4 0.8 | 12.87 0.8 | 24.52 0.8 | 15.66 0.8 |
| NGC 1795 | 4.50 0.07 | 4.66 0.07 | 4.84 0.07 | 7.7 0.9 | 10.43 0.9 | 14.44 0.9 | 11.90 0.9 |
| IC 2146 | 4.49 0.07 | 4.63 0.07 | 4.82 0.07 | 5.9 0.7 | 7.69 0.7 | 10.81 0.7 | 9.25 0.7 |
Early escape velocities for the four clusters, at an age of 10 Myr, are plotted versus the parameter in Fig. 3. represents the width at the 20% level with respect to the maximum value of the clusters pseudo age distributions, after deconvolving out the values for the SSP simulations. Currently extended and currently compact clusters are shown with different symbols in Fig. 3: the former as circle and the latter as square. Furthermore, different colors are used to identify clusters hosting or not hosting an eMSTO (black versus red, respectively). Finally, for each clusters, we show the values for calculated without and with the inclusion of initial mass segregation in the dynamical evolution model (open versus filled symbols, respectively). To estimate “plausible” values for for the different clusters we used a procedure that take into account the various results from the compilation of Magellanic Cloud star cluster properties and N-body simulations by Mackey et al. (2008b). Briefly, they showed that the maximum core radius seen among a large sample of Magellanic Cloud star clusters increase approximately linearly with log(age) up to an age of 1.5 Gyr, namely from 2.0 pc at 10 Myr to 5.5 pc at 1.5 Gyr. Conversely, the minimum core radius is 1.5 pc throughout the age range 10 Myr – 2 Gyr. Using N-body modeling Mackey et al. (2008b) showed that this behavior is consistent with adiabatic expansion of the cluster core in clusters with different levels of initial mass segregation, that is the cluster with the highest level of mass segregation experience the strongest core expansion. Finally, in our estimate we also considered the impact of the retention of stellar black holes (BHs) to the evolution of the clusters core radii (for a detailed description of the procedure, we refer the reader to a companion paper, Goudfrooij et al. 2014, submitted to ApJ). Fig. 3 suggests that the differences among the clusters can be explained by dynamical evolution arguments if the currently extended clusters experienced stronger initial mass segregation than the currently compact ones (to guide the reader, we highlighted with a blue circle the most “plausible” escape velocities values to be considered in the context of the assumption mentioned above).
4.3. Implications on the nature of the eMSTOs
Under the assumption mentioned above, NGC 2209 and NGC 2249 have an early escape velocity 15 km s-1, whereas the ones derived for NGC 1795 and IC 2146 are at 9 and 12 km s-1. Taking these results at face value, the “critical” escape velocity above which the cluster is able to retain material ejected by the slow winds of first generation polluters seems to be in the approximate range of 12 – 15 km s-1 (i.e., the grey area depicted in Fig. 3). This is in agreement with the results obtained by G11b444Note however that G11b calculated their velocities using the effective radius instead of the core radius , preventing a direct comparison. and Goudfrooij et al. (2014).
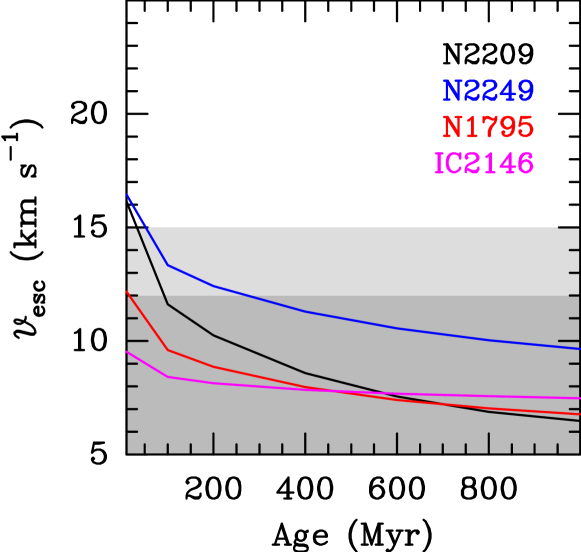
In this context, it is important to verify that the clusters escape velocity is above the derived threshold at the time the candidate polluters are present in the clusters (i.e. at ages of 5– 30 Myr for massive stars and 50– 200 Myr for IM-AGB stars) and ejecting the material necessary for the formation of the second generation. Fig. 4 shows escape velocity as a function of age, in a time range between 0 and 1 Gyr and with the assumption on the level of initial mass segregation presented above. The critical escape velocity range of 12– 15 km s-1 is depicted as the light grey region in Fig. 4, while the region below 12 km s-1, representing the velocity range in which we do not observe eMSTOs in intermediate-age star clusters, is shown in dark grey. Note that NGC 2249 escape velocity remains above 12 km s-1 for more than 250 Myr, while the escape velocity of NGC 2209 declines more rapidly and becomes lower than the threshold value after 100 Myr. This is long enough for stars with (i.e., all IM-AGB stars, see Ventura & D’Antona 2009) to have lost all their outer stellar envelope mass. Note also that given the very extended nature of NGC 2209, the level of initial mass segregation experienced by the cluster could be higher than the value we adopted in our analysis (Mackey et al. 2008b; Goudfrooij et al. 2014). In that case, NGC 2209’s escape velocity would remain above 12 km s-1 for an even longer time. Conversely, NGC 1795 and IC 2146, as expected, have an escape velocity below the threshold value at all times. Hence, these results suggest that for clusters exhibiting an eMSTO, the escape velocity remains above 12 km s-1 for a period of time long enough to permit the retention of the material ejected by all the possible candidate polluters, including the IM-AGB stars, which are the last in order of time to start their slow winds. Thus, it is worth to compare clusters escape velocities with the wind speeds of the first generation candidate polluters: wind speeds for FRMS range between ten to a few hundreds of km s-1(Porter, 1996; Porter & Rivinius, 2003; Wünsch et al., 2008), massive binary stars have wind velocities in the range 15 – 50 km s-1 (see e.g., Smith et al. 2002, 2007) and observed wind velocities for IM-AGB stars in our Galaxy and the Magellanic Clouds are in the range 12 – 18 km s-1 (Vassiliadis & Wood, 1993; Zijlstra et al., 1996). The latter range of wind velocities is very similar to the “critical” escape velocity derived from our dynamical analysis, suggesting that IM-AGB stars can be an important source of the material needed for the formation of the second generation.
For what concerns scenarios that do not involve extended star formation, the most popular is the “stellar rotation” scenario (Bastian & de Mink, 2009). Using theoretical arguments, the authors suggested that a distribution of rotation velocities for stars between 1.2 – 1.7 can mimic the observed morphology of the eMSTOs, shifting fast rotators stars to redder color in the CMDs. However, Girardi et al. (2011), using newly calculated evolutionary tracks for non-rotating and rotating stars, reached opposite conclusions, that is stellar models with rotation actually produce a modest blueshift in the CMD. Observations are needed to test these model predictions. To date, the only star cluster for which colors and rotation velocities have been determined for MSTO stars is the open cluster Trumpler 20 (Platais et al., 2012). They showed that the distribution velocities of stars in Trumpler 20 includes the full range between 0 – 180 km s-1(which is similar to the range considered in the last models by Yang et al. 2013), with a rather flat distribution, and that the fastest rotators are slightly blueshifted (by ) with respect to the slowest rotators. This is consistent with the prediction of Girardi et al. (2011), and it suggests that the effect of stellar rotation on the morphology of MSTOs is significantly less pronounced that that advocated by Bastian & de Mink (2009).
Taking this into account, the results presented here suggest that the “escape velocity threshold scenario” provides a valid explanation for the presence of broadened MSTO region in intermediate-age star clusters and, in turn, that the eMSTO phenomenon can be better explained by a range of stellar ages rather than a range of stellar rotation velocities or interacting binaries.
5. Summary and Conclusions
We studied CMDs of two relatively low mass intermediate-age star clusters in the LMC, namely NGC 2209 and NGC 2249, using new HST/WFC3 images. For comparison purposes, we also re-analyzed archival HST/ACS images of NGC 1795 and IC 2146, two other relatively low mass star clusters, for which the photometry was already presented in Milone et al. (2009). We compared the CMDs of the clusters with Monte Carlo simulations of SSPs in order to investigate the MSTO morphology and quantify the intrinsic widths of the clusters MSTO regions. To study the physical and dynamical properties of the clusters, we derived their radial surface number density distributions and we determined the evolution of the clusters masses and escape velocities from an age of 10 Myr to the current age, considering models with and without initial mass segregation. The main results of this paper can be summarized as follows:
-
•
NGC 2209 and NGC 2249 show a broadening of the MSTO region that can not be explained by photometric uncertainties, LMC field star contamination, or differential reddening effects. Comparison with Monte Carlo simulations of a SSP (including the effects of unresolved binary stars), show that the observed MSTOs are significantly wider than that of a single-age cluster with the same mass, [Z/H], and (average) age. On the other hand, NGC 1795 and IC 2146 show quite compact MSTOs, which are very well reproduced by their respective SSP simulations.
-
•
NGC 2209 and NGC 2249 pseudo-age distribution are peaked towards younger ages and decline smoothly towards older ages. The lack of obvious secondary peaks in these distributions suggests that the morphology of the MSTO region of these clusters can be better explained by a spread in age than by two discrete SSPs.
-
•
The physical properties of NGC 2209 and NGC 2249 are very different, even though their ages are almost identical: NGC 2209 is a very extended cluster (core radius pc), while NGC 2249 is quite compact ( pc). The presence of an eMSTO in both of these clusters suggests that the scenario proposed by K11, in which a cluster hosts an eMSTO only if it has a core radius larger than a certain value ( pc), can not fully explain the eMSTO phenomenon. On the other hand, we find that the differences in MSTO properties among all four clusters of our sample can be explained by dynamical evolution arguments under the plausible assumption that the currently extended clusters experienced stronger initial mass segregation than the currently compact ones. With this assumption, the derived early escape velocities for NGC 2209 and NGC 2249 are consistent with observed wind speeds for intermediate-mass AGB stars in our Galaxy and the Magellanic Clouds, which are considered to be one of the most probable candidate “polluter” stars of the first generation (the others being FRMS and massive binary stars).
-
•
The non-ubiquity of eMSTOs among intermediate-age star clusters in the Magellanic Clouds along with the apparent dependence of the presence of eMSTOs on the initial dynamical properties of the clusters in the age range of 10 – 100 Myr seems to indicate that age effects, rather than a range of stellar rotation velocities or interacting binaries, are responsible for the broadening of the MSTO region.
References
- Bastian & de Mink (2009) Bastian, N., & de Mink, S. E. 2009, MNRAS, 398, L11
- Bonnell & Bate (2006) Bonnell, I. A., & Bate, M. R. 2006, MNRAS, 370, 488
- Bruzual & Charlot (2003) Bruzual, G. A., & Charlot, S., 2003, MNRAS, 344, 1000
- D’Antona & Ventura (2007) D’Antona, F., & Ventura, P. 2007, MNRAS, 379, 1431
- Decressin et al. (2007) Decressin, T., Meynet, G., Charbonnel, C., Prantzos, N., & Ekstróm, S. 2007, A&A, 464, 1029
- de Mink et al. (2009) de Mink, S. E., Pols, O. R., Langer, N., & Izzard, R. G. 2009, A&A, 5007, L1
- Fruchter & Hook (1997) Fruchter, A. S., & Hook R. N. 1997, PASP, arXiv:astro-ph/9808087
- Girardi et al. (2009) Girardi, L., Rubele, S., & Kerber, L. 2009, MNRAS, 394, L74
- Girardi et al. (2011) Girardi, L., Eggenberger, P., & Miglio, A. 2011, MNRAS, 412, L103
- Glatt et al. (2008) Glatt, K. et al., 2008, AJ, 135, 1703
- Goudfrooij et al. (2009) Goudfrooij, P., Puzia, T. H., Kozhurina-Platais, V., & Chandar, R. 2009, AJ, 137, 4988
- Goudfrooij et al. (2011a) Goudfrooij, P., Puzia, T. H., Kozhurina-Platais, V., & Chandar, R. 2011, ApJ, 737, 3 (G11a)
- Goudfrooij et al. (2011b) Goudfrooij, P., Puzia, T. H., Chandar, R., & Kozhurina-Platais, V. 2011, ApJ, 737, 4 (G11b)
- Goudfrooij et al. (2014) Goudfrooij, P., Girardi, L., Kozhurina-Platais, V., et al. 2014, submitted to ApJ
- Kalirai et al. (2012) Kalirai, J. S., et al. 2012, ApJ, 143, 11
- Keller et al. (2011) Keller, S. C., Mackey, A. D., & Da Costa, G. S. 2011, ApJ, 731, 22
- Keller et al. (2012) Keller, S. C., Mackey, A. D., & Da Costa, G. S. 2012, ApJ, 761, L5
- Li et al. (2012) Li, Z., Mao, C., Chen, L., & Zhang, Q. 2012, ApJ, 761, 22
- Marigo et al. (2008) Marigo, P., Girardi, L., Bressan, A., Groenewegen, M. A. T., Silva, L., & Granato, G. L. 2008, A&A, 482. 883
- Mackey et al. (2008a) Mackey, A. D., Broby Nielsen. P., Ferguson, A. M. N., & Richardson, J. C. 2008, ApJ, 681, L17
- Mackey et al. (2008b) Mackey, A. D., Wilkinson, M. I., Davies, M. B., & Gilmore, G. F. 2008, MNRAS, 386, 65
- Milone et al. (2008a) Milone, A. P., et al. 2008a, ApJ, 673, 241
- Milone et al. (2009) Milone, A. P., Bedin, L. R., Piotto, G., & Anderson, J. 2009, A&A, 497, 755
- Piatti (2013) Piatti, A. E. 2013, MNRAS, 430, 2358
- Platais et al. (2012) Platais, I., et al. 2012, ApJ, 751 L8
- Porter (1996) Porter, J. M. 1996, MNRAS, 280, L31
- Porter & Rivinius (2003) Porter, J. M., & Rivinius, T. 2003, PASP, 115, 1153
- Piotto et al. (2007) Piotto, G., et al. 2007, ApJ, 661, L53
- Rubele et al. (2010) Rubele, S., Kerber, L., & Girardi, L. 2010, MNRAS, 403, 1156
- Rubele et al. (2011) Rubele, S., Girardi, L., Kozhurina-Platais, V., Goudfrooij, P., & Kerber, L. 2011, MNRAS, 414, 2204
- Salpeter (1955) Salpeter, E. E. 1955, ApJ, 121, 161
- Silverman (1986) Silverman, B. W. 1986, in Density Estimation for Statistics and Data Analysis, Chap and Hall/CRC Press, Inc.
- Smith et al. (2002) Smith, N., Gehrz, R. D., Stahl, O., Balick, B., & Kaufer, A. 2002, ApJ, 578, 464
- Smith et al. (2007) Smith, N., Bally, J., & Walawender, J., 2007, AJ, 134, 846
- Stetson (1987) Stetson, P. B. 1987, PASP, 99, 191
- Stetson (1994) Stetson, P. B. 1994, PASP, 106, 250
- Vassiliadis & Wood (1993) Vassiliadis, E. & Wood, P. R. 1993, ApJ, 413, 641
- Ventura & D’Antona (2009) Ventura, P., & D’Antona, F. 2009, A&A, 499, 835
- Vesperini et al. (2009) Vesperini, E., McMillan, S. L. W., & Portegies Zwart, S. 2009, ApJ, 698, 615
- Wünsch et al. (2008) Wünsch, R., Tenorio-Tagle, G., Palouš, & Silich, S. 2008, ApJ, 683, 683
- Yang et al. (2011) Yang, W., Meng, X., Bi, S., Tian, Z., Li, T., & Liu, K. 2011, ApJ, 731, L37
- Yang et al. (2013) Yang, W., Bi, S., Meng, X., & Liu, Z. 2013, ApJ, 776, 112
- Zijlstra et al. (1996) Zijlstra, A. A., Loup, C., Waters, L. B. M. F., Whitelock, P. A., van Loon, J. T., & Guglielmo, F., 1996, MNRAS, 279, 32