11email: xujl@bao.ac.cn 22institutetext: NAOC-TU Joint Center for Astrophysics, Lhasa 850000, China 33institutetext: Purple Mountain Observatory, Qinghai Station, 817000, Delingha, China 44institutetext: Key Laboratory of Radio Astronomy, Chinese Academy of Sciences, Nanjing 210008, China
Star formation associated with a large-scale infrared bubble
Abstract
Aims. To investigate how a large-scale infrared bubble centered at =53.9∘ and =0.2∘ form, and study if star formation is taking place at the periphery of the bubble, we performed a multi-wavelength study.
Methods. Using the data from the Galactic Ring Survey (GRS) and Galactic Legacy Infrared Mid-Plane Survey Extraordinaire (GLIMPSE), we performed a study for a large-scale infrared bubble with a size of about 16 pc at a distance of 2.0 kpc. We present the 12CO =1-0, 13CO =1-0 and C18O =1-0 observations of HII region G53.54-0.01 (Sh2-82) obtained at the the Purple Mountain Observation (PMO) 13.7 m radio telescope to investigate the detailed distribution of associated molecular material. In addition, we also used radiorecombination line and VLA data. To select young stellar objects (YSOs) consistent with this region, we used the GLIMPSE I catalog.
Results. The large-scale infrared bubble shows a half-shell morphology at 8 m. H II regions G53.54-0.01, G53.64+0.24, and G54.09-0.06 are situated on the bubble. Comparing the radio recombination line velocities and associated 13CO =1-0 components of the three H II regions, we found that the 8 m emission associated with H II region G53.54-0.01 should belong to the foreground emission, and only overlap with the large-scale infrared bubble in the line of sight. Three extended green objects (EGOs, the candidate massive young stellar objects), as well as three H II regions and two small-scale bubbles are found located in the G54.09-0.06 complex, indicating an active massive star-forming region. C18O =1-0 emission presents four cloud clumps on the northeastern border of H II region G53.54-0.01. Via comparing the spectral profiles of 12CO =1-0, 13CO =1-0, and C18O =1-0 peak at each clump, we found the collected gas in the three clumps, except for the clump coincided with a massive YSO (IRAS 19282+1814). Using the evolutive model of H II region, we derived that the age of H II region G53.54-0.01 is 1.5 yr. The significant enhancement of several Class I and Class II YSOs around G53.54-0.01 indicates the presence of some recently formed stars, which may be triggered by this H II region through the collect and collapse (CC) process.
Key Words.:
Stars: formation —Stars: early-type — ISM: H II regions — ISM: individual objeccts( Sh2-82, G54.09-0.06)1 Introduction
Star formation requires dense self-gravitating gas. The activity of ultraviolet (UV) radiation, stellar winds, and supernova remnant (SNR) can all compress or accumulate a pre-existing gas into a dense gas. The gas may become gravitational instabilities, then collapse into dense cores. Such three dynamic processes may trigger the formation of a new generation of stars. Churchwell et al. (Churchwell06 (2006, 2007)) compiled a list of 600 objects with 8 m emission in a bubble morphology, suggesting that the bubbles were polycyclic aromatic hydrocarbon (PAH) emission in the photodissociation regions (PDRs) surrounding O and early-B stars. Deharveng et al. (Deharveng10 (2010)) studied 102 bubbles catalogued by Churchwell et al. (Churchwell06 (2006, 2007)), most of the bubbles enclose H II regions ionized by O-B2 stars. They also concluded that the bubbles may trigger 1430 of the star formation in our Galaxy. Recently several pieces of observational evidence have been found in favor of star formation triggered by bubbles (see e.g. Dewangan et al. Dewangan12 (2012); Ji et al. Ji12 (2012); Zhang et al. Zhang13 (2013); Dewangan & Ojha Dewangan13 (2013); Li et al. Li14 (2014)).
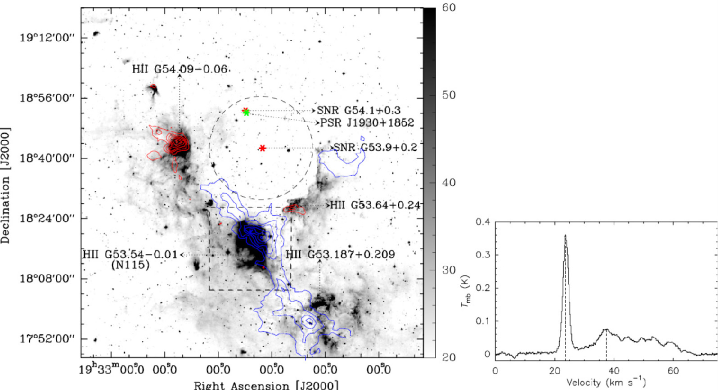
Leahy et al (Leahy08 (2008)) identified a large-scale infrared bubble at 8 m from the Galactic Legacy Infrared Mid-Plane Survey Extraordinaire (GLIMPSE) project, which just surrounds a large radio shell (centered at =53.9∘ and =0.2∘) with an angular size of 30′26′. Velusamy et al. (Velusamy86 (1986)) classified the radio shell as an H II region due to possible thermal infrared emission. With a higher spatial resolution, Leahy et al (Leahy08 (2008)) showed that the radio shell and infrared bubble are physically separated, suggesting that the radio shell may be an old SNR at a distance of 7.3 kpc. There are three H II regions (G53.54-0.01, G53.64+0.24, and G54.09-0.06) and a young SNR (G54.1+0.3) in the infrared bubble, as seen in Fig. 1.
H II region G53.54-0.01(Sh2-82) coincides with the bubble N115 (Churchwell et al. Churchwell06 (2006); Deharveng et al. Deharveng10 (2010); Sherman Sherman (2012)). HD 231616 with a B0V type and a mass of 18 M⊙ may be the exciting star of G53.54-0.01 (Hunter & Massey Hunter90 (1990)). Using the Galactic Ring Survey (GRS) data, two clumps of 13CO =1-0 were identified at the northeast of G53.54-0.01 (Yu et al. Yu (2012)). G54.1+0.3 is a core-collapse SNR with centrally brightened synchrotron emission in radio and X-rays (Velusamy & Becker Velusamy88 (1988); Lu et al. 2002), which closely resembles the Crab Nebula. HI and CO observations give the kinematic distance of 6.2 kpc to G54.1+0.3 (Leahy et al. Leahy08 (2008)). The SNR is associated with a pulsar (PSR J1930+1852), which has a 136 ms rotational period and a characteristic age of 2900 yr (Camilo et al. Camilo02 (2002); Lu et al. Lu08 (2008)). Koo et al. (Koo08 (2008)) detected a star-forming loop around SNR G54.1+0.3 using the AKARI infrared satellite. They proposed that the star-forming loop is triggered by the progenitor star of G54.1+0.3.
To explore signatures of star formation in a large-scale infrared bubble, we mainly combined molecular, infrared, and radio continuum observations toward H II regions G53.54-0.01 and G54.09-0.06. The observations and data reduction are described in 2, and the results are presented in 3. In 4, we discuss how our data provide evidence of triggered star formation in the large-scale infrared bubble. The conclusions are summarized in 5.
2 Observations and data reduction
2.1 13CO =1-0 GRS data
Galactic Ring Survey (GRS) is a survey of 13CO =1-0 emission (Jackson et al. Jackson06 (2006)). The survey covers a longitude range of 18∘–55.7∘ and a latitude range of 1∘, with a angular resolution of 46′′. The survey’s velocity coverage is -5 to 135 km s-1 for Galactic longitudes 40∘ and -5 to 85 km s-1 for Galactic longitudes 40∘. At the velocity resolution of 0.21 km s-1, the typical rms sensitivity is 0.13 K. We used the GRS archival data111http://www.bu.edu/galacticring/ to study the molecular emission of the large-scale infrared bubble.
2.2 Purple Mountain data
The mapping observations of H II region G53.54-0.01 and its adjacent region were performed in the 12CO =1-0, 13CO =1-0, and C18O =1-0 lines using the Purple Mountain Observation (PMO) 13.7 m radio telescope (Zuo et al. Zuo04 (2004)) at De Ling Ha in the west of China at an altitude of 3200 meters, in May 2013. The Superconducting Spectroscopic Array Receiver (SSAR) is used, which is a superconducting focal plane array that observes a 33 beam. The new array receiver system in single-sideband (SSB) mode was used as front end. The back end is a fast Fourier transform spectrometer (FFTS) of 16384 channels with a bandwidth of 1 GHz, corresponding to a velocity resolution of 0.16 km s-1 for 12CO =1-0 and 0.17 km s-1 for 13CO =1-0 and C18O =1-0; 12CO =1-0 was observed at upper sideband, while 13CO =1-0 and C18O =1-0 were observed simultaneously at lower sideband. The half-power beam width (HPBW) was 53′′ at 115 GHz and the main beam efficiency was 0.5. The pointing accuracy of the telescope was better than 5′′, which was derived from continuum observations of planets. W51D was observed once per hour as flux calibrator. The system noise temperature (Tsys) in SSB mode varied between 150 K and 400 K. Mapping observations were centered at RA(J2000)=, DEC(J2000)= using on-the-fly (OTF) observing mode. The total mapping area is in 12CO =1-0, 13CO =1-0, and C18O =1-0 with a grid. The standard chopper wheel calibration technique was used to measure antenna temperature ∗ corrected for atmospheric absorption. The final data was recorded in brightness temperature scale of (K). The data were reduced using the GILDAS/CLASS222http://www.iram.fr/IRAMFR/GILDAS/ package.
2.3 Additional data
The 1.4 GHz radio continuum emission data were obtained from the NRAO VLA Sky Survey (NVSS; Condon et al. Condon98 (1998)). NVSS is a 1.4 GHz continuum survey covering the entire sky north of -40∘ declination (Condon98 (1998)) with a noise of about 0.45 mJy/beam and the resolution of 45′′.
The radio-recombination lines data were derived from the GBT survey (Anderson et al. Anderson11 (2011)). The survey have detected 448 previously unknown Galactic H II regions at X-band (9 GHz, 3 cm) in the Galactic zone 343∘67∘ and 1∘. The FWHM beam size of the telescope is approximately 82′′ at this frequency.
GLIMPSE survey is used to identify the young stars along H II regions, which observed the Galactic plane (65∘ 10∘ for 1∘) with the four IR bands (3.6, 4.5, 5.8, and 8.0 m) of the Infrared Array Camera (IRAC) (Fazio (2004)) on the Spitzer Space Telescope. The resolution is from 1.5′′ (3.6 m) to 1.9′′ (8.0 m).
3 Results
3.1 The large-scale infrared bubble
3.1.1 Infrared and 13CO =1-0 emission
Figure 1, left panel shows the 13CO =1-0 integrated intensity map superimposed on the Spitzer-IRAC emission at 8 m (grey scale). The Spitzer-IRAC 8 m emission presents a half-shell morphology corresponding mainly to fluorescence from PAH molecules. The density of the inner edge is more dense in the large-scale infrared bubble. According to Leahy et al. (Leahy08 (2008)), the infrared bubble around a large radio shell with an angular size of 30′26′ contains three H II regions. Two extended H II regions G54.09-0.06 and G53.64+0.24 have a recombination line velocities of 42.10.8 km s-1 and 381.8 km s-1, respectively. The recombination line velocity of H II region G53.54-0.01 is 23.90.3 km s-1 (Anderson et al. Anderson11 (2011)).
The CO maps contain velocity information that allows to disentangle different molecular components along the line of sight. The right panel of Fig. 2 shows the average spectra of 13CO =1-0 over the whole large-scale infrared bubble. From the spectra, we can see that there is a strong line that located in the velocity intervals 20 to 28 km s-1 peak at 24 km s-1. Other velocity components overlap between 30 and 63 km s-1. In the overlapping range of velocity, there is a relatively strong line located in the velocity intervals 35 to 43 km s-1 peak at 38 km s-1. Using the velocity ranges of 20 to 28 km s-1 and 35 to 43 km s-1, we made the integrated intensity map of 13CO =1-0 (Fig. 1, right panel), marked by red and blue contours, respectively. In Fig. 1, the velocity component of 20 to 28 km s-1 presents a filamentary structure, which is associated well with the infrared emission of H II region G53.54-0.01. However, the filamentary structure extend toward the center of the large-scale infrared bubble. A weak component of 20 to 28 km s-1 is located on the western border of the infrared bubble. Additionally, the velocity components of 35 to 43 km s-1 are consistent with the infrared emission of H II regions G54.09.0.06 and G53.64+0.24. The 13CO =1-0 emission related to H II region G54.09.0.06 shows a comet-like morphology. Hence, the large-scale infrared bubble may consist of two components, while the velocity component in interval 20 to 28 km s-1 should belong to the foreground emission, and only overlap with other component in the line of sight.
3.1.2 Search for young stellar objects
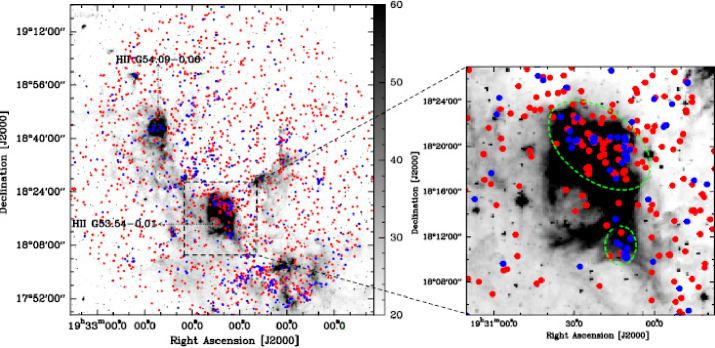
To study star formation in the vicinity of the large-scale infrared bubble by detecting all the young stellar objects (YSOs) around the infrared bubble and looking at their position with respect to the ionized gas and molecular condensations, we used the Spitzer-GLIMPSE I catalog. Considering only sources that have been detected in the four Spitzer-IRAC bands, we found 153286 near-infrared sources centered on the infrared shell within a circle of 48′ in radius. Allen et al. (Allen (2004)) showed that YSOs have specific infrared colors depending on their masses and their evolutionary stages. Based on the color selection criteria of YSOs (Allen et al. Allen (2004)), we found 478 Class I sources and 1423 Class II sources. Class I sources are protostars with circumstellar envelopes with an age of 105 yr, while Class II sources are disk-dominated objects with an age of 106 yr. The left panel of Fig. 2 presents the spatial distribution of Class I and Class II sources. From the left panel, we see that Class I and Class II sources are symmetric distributed across the whole selected region, but concentrated around G53.54-0.01. In order to clearly show the distribution of YSOs in the vicinity of H II region G53.54-0.01, we made a small-scale distributed map of the YSOs shown in the right panel of Fig. 2, which obviously presents the concentration of YSOs at the border of G53.54-0.01. We do not know if all the YSOs seen in the direction of G53.54-0.01 lie at the same distance with the H II region and associated with it. However, the concentration of YSOs in the surroundings of G53.54-0.01 indicates that the association is highly probable.
3.2 H II region G54.09-0.06
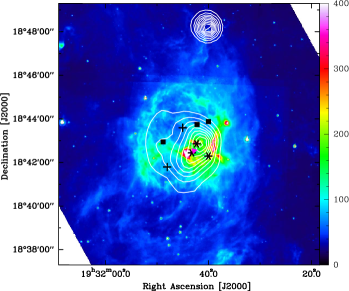
In Fig. 3, the 1.4 GHz continuum emission obtained from NVSS exhibits an extended structure, which is consistent with the Spitzer-IRAC 8 m emission. From the survey of H II regions at the radio band in the northern sky (Lockman Lockman89 (1989)), we found other two H II regions (G50.10-0.06 and G54.1-0.1), which may be associated with the Spitzer-IRAC 8 m emission. However, H II region G50.10-0.06 is closer to the center of the 1.4 GHz continuum emission. IRAS 19294+1836 with a velocity of 39.9 km s-1 is an YSO, which is more near at the position of G54.09-0.06. Additionally, there are three extended green objects (EGOs) (G54.11-0.04, 54.11-0.05 and 54.11-0.08) in the region. EGOs have excess emission in extended structures in the Infrared Array Camera (IRAC) 4.5 m band images that are conventionally coded as green in the IRAC false color images, which are considered as the candidate birth places of the massive YSO (Cyganowski et al. 2008). He et al. (2012) gave that the velocity of EGO 54.11-0.08 is 38.4 km s-1, while that of EGO G54.11-0.04 is 39.2 km s-1 (Chen et al. Chen10 (2010)), suggesting that this region is ongoing formation of many massive stars. Moreover, two small-scale bubbles (N116 and N117) are located in this region, selected from the catalog of Churchwell et al. (Churchwell06 (2006)) bubbles. Watson et al. (Watson10 (2010)) gave that the velocity of N117 is 18.7 km s-1 from the survey of H II regions in the northern sky (Lockman Lockman89 (1989)), but we did not find the matching source with N117 in the survey results. As shown in Fig. 1 (right panel), the comet-like component of 13CO peak at 38 km s-1 presents a good morphological correlation with the infrared emission containing G54.09.0.06. From Fig. 3, we also see that N116 and N117 are associated well with the Spitzer-IRAC 8 m emission, suggesting that the velocity of N116 and N117 may be 38 km s-1.
3.3 H II region G53.54-0.01
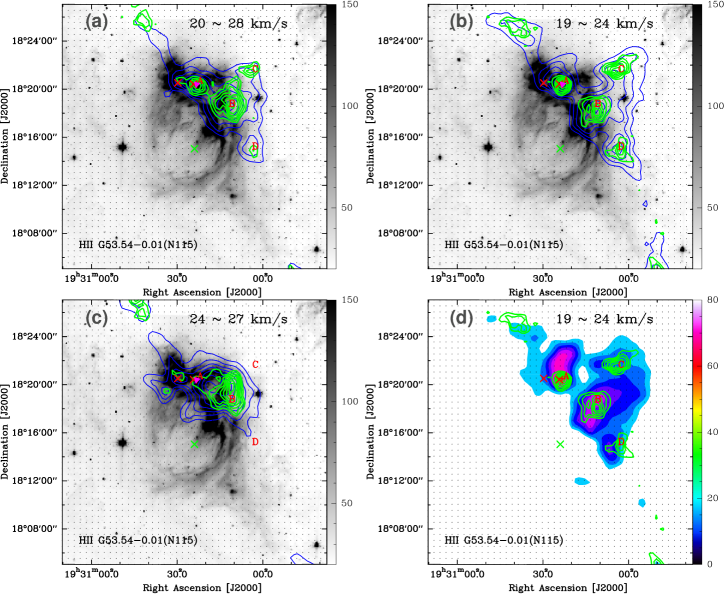
The concentration of YSOs around H II region G53.54-0.01 indicates that their formation might have been triggered. The PAH emission of H II region G53.54-0.01 shows the cometary globule. To analyze in greater detail the morphology of molecular gas associated with G53.54-0.01, we mapped the emission in the 12CO =1-0, 13CO =1-0, and C18O =1-0 transitions. Adopting the velocity range of 20 to 28 km s-1 from the right panel of Fig. 1, the integrated intensity maps of 13CO =1-0 and C18O =1-0 are made shown in Fig.4 (a). From Fig.4 (a), we see that the emission of 13CO =1-0 shows the arc-like structure consistent with the PAH emission at the northwest of G53.54-0.01. Four clumps are identified in C18O =1-0, designated clumps A, B, C and D, respectively. There are two submillimeter-wavelength continuum sources and an IRAS source that are associated with the molecular emission (Di Francesco et al. Di08 (2008) & Sun et al. Sun03 (2003)). Moreover, JCMTSF J193024.2+182026 and IRAS 19282+1814 is nearly located on the center of clump A. Sun et al. (Sun03 (2003)) suggested that IRAS 19282+1814 may be a massive YSO candidate.
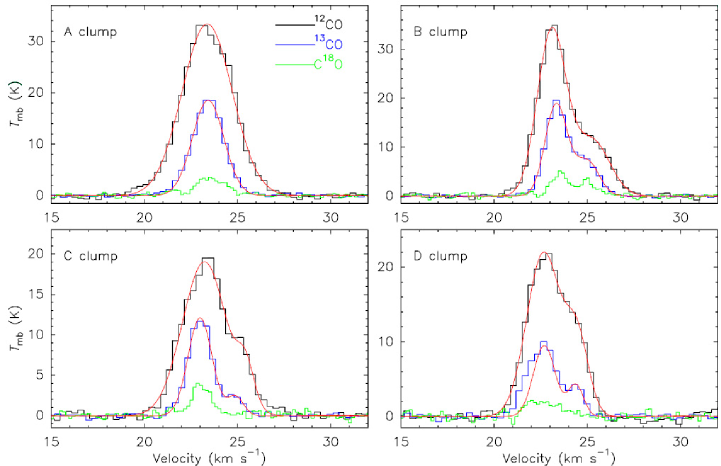
Figure 5 shows the 12CO =1-0, 13CO =1-0, and C18O =1-0 spectra toward the peak positions of each clump. The line profiles of 12CO =1-0 and 13CO =1-0 in clump A appear to only show the blue wings. For clump B, the line profiles of 12CO =1-0 and 13CO =1-0 only are broadened in the red wings, while that of C18O =1-0 shows double peaks. The line profiles of 12CO =1-0 and 13CO =1-0 in clumps C and D is the same as that in clump B, but both line profiles of C18O =1-0 show a single peak. The profile of each line is divided into a main and a residual part in the red wing. We fitted each spectrum with two Gaussian profiles. Table 1 shows the fitted results. Adopting two velocity ranges of 19 to 24 km s-1 and 24 to 27 km s-1, we further made the integrated intensify maps of 12CO =1-0, 13CO =1-0 and C18O =1-0 shown in Fig.4 (b), (c), and (d). In Fig.4 (b) and (d), the emission maps of 12CO =1-0, 13CO =1-0 and C18O =1-0 clearly show four clumps. The velocity component of 24 to 27 km s-1 is not associated with the clumps A, B, C, and D in Fig.4 (c), but well consistent with the PAH emission of H II region G53.54-0.01. Hence, we suggest that the velocity component of 24 to 27 km s-1 should be another cloud clump, which is weaker than the emission of 19 to 24 km s-1, as seen in Table 1. The velocity component of 24 to 27 km s-1 may be collected into the clumps A, B, C, and D with the expansion of H II region G53.54-0.01. C18O =1-0 is used to trace the dense clump. Comparing the C18O =1-0 emission in Fig.4 (b) with that in Fig.4 (c), we found that the position of only clump B has the strong C18O =1-0 emission with the velocity component of 24 to 27 km s-1, which is responsible for the double-peaks profile of C18O =1-0 in the clump B. One of peaks at 23 km s-1 is associated with clump B, another at 25 km s-1 may belong to the collected gas.
Anderson et al. (Anderson11 (2011)) gave that the hydrogen radio recombination line (RRL) velocity is 23.90.3 km s-1 for H II region G53.54-0.01, which are well associated with the main systemic velocities of each clump in C18O =1-0 line. According to the Galactic rotation model of Fich et al. (Fich89 (1989)) together with = 8.5 kpc and = 220 km s-1, where is the circular rotation speed of the Galaxy, we obtain a kinematic distance of 2.0 or 8.1 kpc to H II region G53.54-0.01. Hunter & Massey (Hunter90 (1990)) gave that H II region G53.54-0.01 has a photometric distance of 1.7 kpc. Hereafter, we will adopt the near kinematic distance of 2.0 kpc. Using the the optical thin 13CO =1-0 line and assuming local thermodynamical equilibrium (LTE) we estimate the H2 column density towards each clump and the collected gas in Fig. 5. Moreover, we assume that the collected gas has the same excitation temperature as each clump. The column density are determined by Garden et al. (Garden (1991))
| (1) |
where is the velocity range in km s-1, and is the excitation temperature in K. We estimate following the equation
| (2) |
where is the corrected main-beam temperature of 12CO =1-0. Here we use the relation (Simon et al. Simon01 (2001)) and Gaussian fit line parameters to estimate the H2 column density.
| Name | 12CO J=1-0 | 13CO J=1-0 | C18O J=1-0 | |||||||||
|---|---|---|---|---|---|---|---|---|---|---|---|---|
| FWHM | FWHM | FWHM | ||||||||||
| (K) | (km ) | (km ) | (K) | (km ) | (km ) | (K) | (km ) | (km ) | ||||
| Clump A | Main | 33.5 | 3.2 | 23.4 | 18.6 | 2.0 | 23.4 | 2.2 | 1.9 | 23.6 | ||
| Clump B | Main | 33.8 | 1.8 | 23.1 | 18.8 | 1.4 | 23.3 | 3.2 | 1.0 | 23.5 | ||
| Residual | 11.2 | 2.2 | 25.3 | 7.5 | 1.5 | 25.0 | 2.0 | 1.2 | 25.0 | |||
| Clump C | Main | 19.1 | 2.8 | 23.2 | 12.1 | 1.5 | 23.0 | 2.6 | 1.3 | 23.1 | ||
| Residual | 4.8 | 1.1 | 25.5 | 2.3 | 1.0 | 24.9 | – | – | – | |||
| Clump D | Main | 22.0 | 2.1 | 22.7 | 9.6 | 1.9 | 22.6 | 1.4 | 2.2 | 22.6 | ||
| Residual | 10.2 | 1.5 | 24.5 | 3.6 | 0.9 | 24.5 | – | – | – |
| Name | |||||||
|---|---|---|---|---|---|---|---|
| K | (pc) | (K km ) | (cm-2) | (cm-3) | () | ||
| Clump A | Main | 37.0 | 2.1 | 113.5 | 1.2 | 9.3 | 3.0 |
| Clump B | Main | 37.3 | 3.2 | 65.7 | 6.7 | 3.4 | 3.9 |
| Residual | 25.6 | 2.6 | 1.3 | 1.5 | |||
| Clump C | Main | 22.6 | 0.9 | 56.5 | 3.9 | 7.0 | 1.8 |
| Residual | 5.6 | 3.8 | 0.7 | 0.2 | |||
| Clump D | Main | 25.5 | 1.2 | 49.9 | 3.7 | 5.0 | 3.5 |
| Residual | 16.2 | 1.2 | 1.6 | 1.0 |
If the clumps are approximately spherical in shape, the mean number density of is estimated to be
| (3) |
where is the averaged diameter of the clumps in parsecs (pc), measured from Fig. 4.
Moreover, their mass is given by
| (4) |
where =1.36 is the mean atomic weight of the gas, and is the mass of a hydrogen molecule. The obtained results are all listed in Table 2.
4 DISCUSSION
4.1 The dynamics of the large-scale infrared bubble and H II region G53.54-0.01
The large-scale infrared bubble shows the half-shell structure at 8 m, which just surrounds a large radio shell centered at =53.9∘ and =0.2∘. Leahy et al (Leahy08 (2008)) suggested that the radio shell may belong to SNR G53.9+0.2 at a distance of 7.3 kpc. The large-scale infrared bubble contains three H II regions (G53.54-0.01, G53.64+0.24, and G54.09-0.06), while a Crab-like young SNR G54.1+0.3 is situated on the radio shell. Because the kinematic distance of SNR G54.1+0.3 is 6.2 kpc from HI and CO observations (Leahy et al. Leahy08 (2008)), SNR G54.1+0.3 is not related to the radio shell. Using the GRS data, we found that the large-scale infrared bubble is associated with several 13CO =1-0 clumps. The clumps have two velocity components, peak at 24 and 38 km s-1, respectively. The velocity component peak at 38 km s-1 coincides with H II regions G53.64+0.24 and G54.09-0.06, while that at 24 km s-1 is associated with H II region G53.54-0.01. Hence, the 8 m emission consistent with H II region G53.54-0.01 should belong to the foreground emission, and only overlap with the large-scale infrared bubble in the line of sight. Additionally, the 8 m emission of the inner border is more dense in the large-scale infrared bubble. Moreover, the 13CO =1-0 emission related to H II region G54.09-0.06 shows a comet-like morphology. We conclude that the large-scale infrared bubble is likely to be formed by ultraviolet (UV) radiation from the progenitor star of SNR 53.9+0.2.
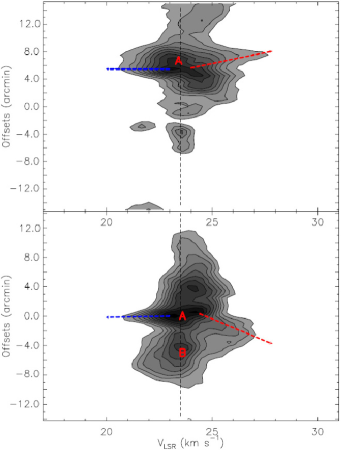
In addition, H II region G53.54-0.01 is close to a filamentary molecular cloud. We further made the observations in 12CO =1-0, 13CO =1-0, and C18O =1-0 towards H II region G53.54-0.01 and its adjacent region. Four clumps are found in this region. The profiles of 12CO =1-0 in clump A only show the blue wing. The clump A is associated with IRAS 19282+1814. Sun et al. (Sun03 (2003)) concluded that IRAS 19282+1814 has a blue-shifted monopolar molecular outflow. To confirm the outflow, we made two position-velocity (PV) diagrams (Fig. 6) with the cuts through the peak position of clump A along the north-south and east-west directions in 12CO =1-0 line. Clump A shows the bipolar structure presented in the blue and red dashed arrows. The blueshifted component has obvious velocity gradients with respect to the systemic velocity of clump A. The redshifted component also has the velocity gradient along the inverse direction, but the gradient is not very obvious relative to the blueshifted component. The distributions of redshifted and blueshifted velocity components are an indication of outflow motion. However, the profiles of 12CO =1-0 and 13CO =1-0 in clumps B, C and D only are broadened in red wings. Comparing with the profile of C18O =1-0 in clump B, the red wing may not be broadened, but indicate a component. The component may be the collected gas, which expand into the molecular cloud containing clumps A, B, C and D, after collected with the expansion of H II region G53.54-0.01.
4.2 Triggered star formation
Koo et al. (Koo08 (2008)) detected a star-forming loop around SNR G54.1+0.3. They suggested that the star-forming loop may be triggered by the progenitor star of G54.1+0.3. Because of the selected Class I and Class II sources in a large-scale region, we did not find the star-forming loop around SNR G54.1+0.3. Three EGOs sources are found located in the G54.09-0.06 complex, as well as over three H II regions and two small-scale bubbles. This distribution is an indication of an active star-forming region located in the large-scale infrared bubble around SNR G53.9+0.2.
Class I and Class II sources are mostly concentrated around H II region G53.54-0.01. H II region G53.54-0.01 is expanding into a filament molecular cloud. Four clumps are found around H II region G53.54-0.01, but only the clump A associated with a massive YSO (IRAS 19282+1814) may has an outflow motion. Adopting the angle of 90∘ and the clump size as the outflow size, the dynamic timescale of the outflow is estimated roughly by equation t = 9.78 R/V (yr), where V in km is the maximum flow velocity relative to the cloud systemic velocity, and R in pc is the outflow size. The average dynamical timescale of the outflow is 4.3 yr. The clump A has the mass of 3.0, indicating a massive star forming region. The above analysis suggest that the triggered star formation have occurred in the region around H II region G53.54-0.01. The dynamical age of H II region G53.54-0.01 can also be used to decide whether YSOs are triggered by H II region. Assuming the emission is optically thin free-free thermal continuum, the ionizing luminosity is computed by Condon (Condon92 (1992))
| (5) |
Where is the frequency of the observation, is the observed specific flux density, and is the distance to the H II region. Anderson et al. (Anderson11 (2011)) gave that HII region G53.54-0.01 has the flux density of 1.3 Jy at 9 GHz. Because the spectral type of the exciting star of H II region G53.54-0.01 is B0V (Hunter & Massey Hunter90 (1990)), we adopt an electron temperature of 33340 K (Vacca et al. Vacca96 (1996)). Finally, we obtain 4.5 ph s-1.
Using a simple model described by Dyson & Williams (Dyson80 (1980)) and assuming an H II region expanding in a homogeneous medium, we estimate the dynamical age of the H II region as
| (6) |
where is the radius of the H II region, is the initial number density of the gas, and is the ionizing luminosity. Adopting the measured radius of H II region G53.54-0.01 (2.3 pc) obtained from Fig. 5, and assuming an initial number density of 103cm-3, we derive a dynamical age of 1.5 yr for H II region G53.54-0.01.
Comparing the age of H II region G53.54-0.01 with that of YSOs (Class I and Class II sources) showed on its border, we suggest that these YSOs are likely to be triggered by H II region G53.54-0.01. Two processes have been considered for the triggering of star formation at the edge of the H II regions (Deharveng et al. Deharveng10 (2010)), namely ‘collect and collapse (CC)’ and ‘radiation driven implosion (RDI)’. In the CC process, a compressed layer of high-density neutral material forms between the ionization front and shock front preceding it in the neutral gas, and star formation occurs when this layer becomes gravitationally unstable, which is characterized by the presence of the fragments regularly spaced along the molecular ring or shell; In RDI process, the shocks drive into pre-existing density structures and compress them to form stars, which is characterized by the cometary globules or optically bright rims. The PAH emission of H II region G53.54-0.01 shows the cometary globule, but we detected the collected gas in the clumps B, C, and D. Furthermore, we identified an outflow only in the clump A associated with the massive YSO IRAS 19282+1814, but did not detect the collected gas. We suggest that the collected gas expands into the pre-existing clump A, the local density of clump A increases then it collapse to be a massive star. The CC process is responsible for the YSOs and an massive star formation around H II region G53.54-0.01. This process not only collect the diffuse gas near the pre-existing molecular cloud, but also add the collected gas into the pre-existing molecular cloud.
5 Conclusions
Using the Spitzer-IRAC 8 m and GRS 13CO =1-0 archival data, we have studied a large-scale infrared bubble centered at =53.9∘ and =0.2∘. H II regions G53.54-0.01, G53.64+0.24, and G54.09-0.06 are located on the bubble. Molecular observations in 12CO =1-0, 13CO =1-0 and C18O =1-0 with the Purple Mountain Observation (PMO) 13.7 m radio telescope were performed to investigate the detailed distribution of molecular material associated with HII region G53.54-0.01 (Sh2-82). The results can be summarized as follows:
-
1.
The large-scale infrared bubble presents a half-shell morphology at 8 m. H II regions G54.09-0.06 and G53.64+0.24 have a recombination line velocities of 42.10.8 km s-1 and 381.8 km s-1, respectively, while 23.90.3 km s-1 for H II region G53.54-0.01, hence we concluded that the 8 m emission related to H II region G53.54-0.01 should belong to the foreground emission, and only overlap with the large-scale infrared bubble in the line of sight.
-
2.
The large-scale infrared bubble has the dense inner border and several pillar-like structures. Moreover, the 13CO =1-0 emission related to H II region G54.09-0.06 shows a comet-like morphology, suggesting that the large-scale infrared bubble is likely to be formed by ultraviolet (UV) radiation from the progenitor star of old SNR 53.9+0.2.
-
3.
Three EGOs sources, three H II regions and two small-scale bubbles (N116 and N117) are found situated at the G54.09-0.06 complex, suggesting an active massive star-forming region. We suggest that the velocity of N116 and N117 may be 38 km s-1.
-
4.
In 18CO =1-0 line, we found four cloud clumps on the northeastern border of H II region G53.54-0.01. Comparing the spectral profiles of 12CO =1-0 and 13CO =1-0 with that of 18CO =1-0 peak at each clump, we found a collected gas component, which has rushed into three clumps B, C, and D, except for the clump A.
-
5.
clump A with a mass of 3000 is associated with a submillimeter-wavelength continuum source and a massive YSO. Additionally, the clump A has an outflow motion. The estimated dynamical timescale of the outflow is 4.3 yr, indicate a forming massive star. The derived ages of G53.54-0.01 is 1.5 yr. The significant enhancement of several Class I and Class II YSOs around G53.54-0.01 indicates the presence of some recently formed stars. Taking into account the age of G53.54-0.01 and YSOs, we find that G53.54-0.01 may trigger the formation of these YSOs via the collect and collapse (CC) process.
Acknowledgements.
We are very grateful to the anonymous referee for his/her helpful comments and suggestions. We are also grateful to the staff at the Qinghai Station of PMO for their assistance during the observations. Thanks for the Key Laboratory for Radio Astronomy, CAS, for partly supporting the telescope operation. This work was supported by the National Natural Science Foundation of China (Grant No. 11363004). Also supported by the young researcher grant of national astronomical observatories, Chinese academy of sciences.References
- (1) Allen, L. E., Calvet, N., D’Alessio, P., 2004, ApJS, 154, 363
- (2) Anderson, L. D., Bania, T. M., Balser, D. S., & Rood, R. T. 2011, ApJ, 194, 32
- (3) Camilo, F., Lorimer, D. R., Bhat, N. D. R., et al. 2002, ApJL, 574, L71
- (4) Condon, J. J. ARA&A, 30, 575
- (5) Condon, J. J., Cotton, W. D, Greisen, E. W., et al., 1998, AJ, 115, 1693
- (6) Chen, X., Shen, Z., Li, J., Xu, Y., & He, J. 2010, ApJ, 710, 150
- (7) Churchwell, E., Povich, M. S., Allen, D., et al. 2006, ApJ, 649, 759
- (8) Churchwell, E., Watson, D. F., Povich, M. S., et al. 2007, ApJ, 670, 428
- (9) Cyganowski, C. J., Whitney, B. A., Holden, E., et al. 2008, AJ, 136, 2391
- (10) Deharveng, L., Schuller, F., Anderson, L. D., et al. 2010, A&A, 523, 6
- (11) Di Francesco, J., Johnstone, D., Kirk, H., MacKenzie, T., & Ledwosinska, E. 2008, ApJS, 175, 277
- (12) Dyson, J. E., & Williams, D. A. 1980, Physics of the interstellar medium, ed. Dyson, J. E. & Williams, D. A.
- (13) Fazio, G. G., Hora, J. L., Allen, L. E., et al. 2004, ApJS, 154, 10
- (14) Fich, M., Blitz, L., & Stark, A. A., 1989, ApJ, 342, 272
- (15) Garden, R. P., Hayashi, M., Hasegawa, T., et al., 1991, ApJ, 374, 540
- (16) He, J. H., Takahashi, S., Chen, X. 2012, ApJS, 202, 1
- (17) Hunter, D. A., & Massey, P. 1990, AJ, 99, 846
- (18) Jackson, J. M., Rathborne, J. M., Shah, R. Y. et al. 2006, ApJS, 163, 145
- (19) Ji, W.-G., Zhou, J.-J., Esimbek, J., Wu, Y.-F., et. al. 2012, A&A, 544, 39
- (20) Koo, B.-C., McKee, C. F., Lee, J.-J., et al. 2008, ApJS, 673, L147
- (21) Leahy, D. A., Tian, W., & Wang, Q. D. 2008, AJ, 136, 1477
- (22) Li, Jun-Yu., Jiang, Zhi-Bo., Liu, Yao., & Wang, Yuan. RAA, 13, 921
- (23) Lockman, F. J. 1989, ApJS, 71, 469
- (24) Lu, F. J., Wang, Q. D., Aschenbach, B., Durouchoux, P., & Song, L. M. 2002, ApJS, 568, L49
- (25) Dewangan, L. K., Ojha, D. K., Anandarao, B. G., Ghosh, S. K., & Chakraborti, S. A&A, 756, 151
- (26) Dewangan, L. K., & Ojha, D. K. MNRAS, 429, 1386
- (27) Pomarès, M., Zavagno, A., Deharveng, L., et al. 2009, A&A, 494, 987
- (28) Sherman, R. A. 2012, ApJ, 760, 58
- (29) Simon, R., Jackson, J. M., Clemens, D. P., Bania, T. M., & Heyer, M. H. 2001, ApJ, 551, 747
- (30) Watson, C, Hanspal, U., & Mengistu, A. 2010, ApJ, 716, 1478
- (31) Sun, K, & Wu, Y. 2003, Chinese Astronomy and Astrophysics, 27, 73
- (32) Vacca, W. D., Garmany, C. D., & Shull, J. M. 1996, ApJ, 460, 914
- (33) Velusamy, T., Goss, W. M., & Arnal, E. M. 1986, A&A, 7, 105
- (34) Velusamy, T., & Becker, R. H. 1988, AJ, 95, 1162
- (35) Yu, Nai-Ping, & Wang, Jun-Jie. 2012, RAA, 12, 651
- (36) Zuo, Y.-X., Yang, J., Shi, S.-C., et al. 2004, CJA&A, 4, 390
- (37) Zhang, C.-P., Wang, J.-J., & Xu, J.-L. A&A, 550, 117