The Properties of Ly Nebulae: Gas Kinematics from Non-resonant Lines**affiliation: Based on observations made with an ESO telescope at the Paranal Observatory, under the program ID 086.A-0804.
Abstract
With VLT/X-shooter, we obtain optical and near-infrared spectra of six Ly blobs at 2.3. For a total sample of eight Ly blobs (including two that we have previously studied), the majority (6/8) have broadened Ly profiles with shapes ranging from a single peak to symmetric or asymmetric double-peaked. The remaining two systems, in which the Ly profile is not significantly broader than the [O III] or H emission lines, have the most spatially compact Ly emission, the smallest offset between the Ly and the [O III] or H line velocities, and the only detected C IV and He II lines in the sample, implying that a hard ionizing source, possibly an AGN, is responsible for their lower optical depth. Using three measures — the velocity offset between the Ly line and the non-resonant [O III] or H line ( ), the offset of stacked interstellar metal absorption lines, and a new indicator, the spectrally-resolved [O III] line profile — we study the kinematics of gas along the line of sight to galaxies within each blob center. These three indicators generally agree in velocity and direction, and are consistent with a simple picture in which the gas is stationary or slowly outflowing at a few hundred km s-1 from the embedded galaxies. The absence of stronger outflows is not a projection effect: the covering fraction for our sample is limited to 1/8 (13%). The outflow velocities exclude models in which star formation or AGN produce “super” or “hyper” winds of up to 1000 km s-1 . The offsets here are smaller than typical of Lyman break galaxies (LBGs), but similar to those of compact Ly emitters. The latter suggests a connection between blob galaxies and Ly emitters and that outflow speed cannot be a dominant factor in driving extended Ly emission. For one Ly blob (CDFS-LAB14), whose Ly profile and metal absorption line offsets suggest no significant bulk motion, we use a simple radiative transfer model to make the first column density measurement of gas in an embedded galaxy, finding it consistent with a damped Ly absorption system. Overall, the absence of clear inflow signatures suggests that the channeling of gravitational cooling radiation into Ly is not significant over the radii probed here. However, one peculiar system (CDFS-LAB10) has a blueshifted Ly component that is not obviously associated with any galaxy, suggesting either displaced gas arising from tidal interactions among blob galaxies or gas flowing into the blob center. The former is expected in these overdense regions, where HST images resolve many galaxies. The latter might signify the predicted but elusive cold gas accretion along filaments.
Subject headings:
galaxies: formation — galaxies: high-redshift — intergalactic medium1. Introduction
Giant Ly nebulae, or “blobs,” are extended sources at 2–6 with typical Ly sizes of 5″ ( 50 kpc) and line luminosities of erg s-1 (e.g., Keel et al., 1999; Steidel et al., 2000; Francis et al., 2001; Matsuda et al., 2004, 2011; Dey et al., 2005; Saito et al., 2006; Smith & Jarvis, 2007; Hennawi et al., 2009; Ouchi et al., 2009; Prescott et al., 2009, 2012a; Yang et al., 2009, 2010; Erb et al., 2011). The low number counts, strong clustering, multiple embedded sources, and location in over-dense environments of the largest Ly blobs indicate that they lie in massive ( ) dark matter halos, which will evolve into those typical of rich galaxy groups or clusters today (Yang et al., 2009, 2010; Prescott et al., 2008, 2012b). Therefore, Ly blobs are unique tracers of the formation of the most massive galaxies and their early interaction with the surrounding intergalactic medium (IGM).
This interaction is probably tied on some scale to the source of the blobs’ extended Ly emission, but that mechanism is poorly understood. Emission from Ly blobs could arise from several phenomena, which may even operate together, including shock-heating by galactic superwinds (Taniguchi & Shioya, 2000) or gas photoionized by active galactic nuclei (Haiman & Rees, 2001; Geach et al., 2009). Another possibility is smooth gas accretion, which is likely to play an important role in the formation of galaxies (e.g., Kereš et al., 2005, 2009) and which should channel some of its gravitational cooling radiation into atomic emission lines such as Ly (Haiman, Spaans, & Quataert, 2000; Fardal et al., 2001; Dijkstra & Loeb, 2009; Goerdt et al., 2010). Another scenario is the resonant scattering of Ly photons produced by star formation or active galactic nuclei (AGN) (Steidel et al., 2010; Hayes et al., 2011) in the embedded galaxies.
To resolve the debate about the nature of Ly blobs requires — at the very least — that we discriminate between between outflowing and inflowing models. Because Ly is a resonant line and typically optically thick in the surrounding intergalactic medium, studies even of the same Ly blob’s kinematics can disagree. On one hand, Wilman et al. (2005) argue that their integral field unit (IFU) spectra of a Ly blob are consistent with a simple model where the Ly emission is absorbed by a foreground slab of neutral gas swept out by a galactic scale outflow. On the other, Dijkstra et al. (2006b) explain the same data as arising from the infall of the surrounding intergalactic medium. Worse, Verhamme et al. (2006) claim that the same symmetric Ly profiles are most consistent with static surrounding gas.
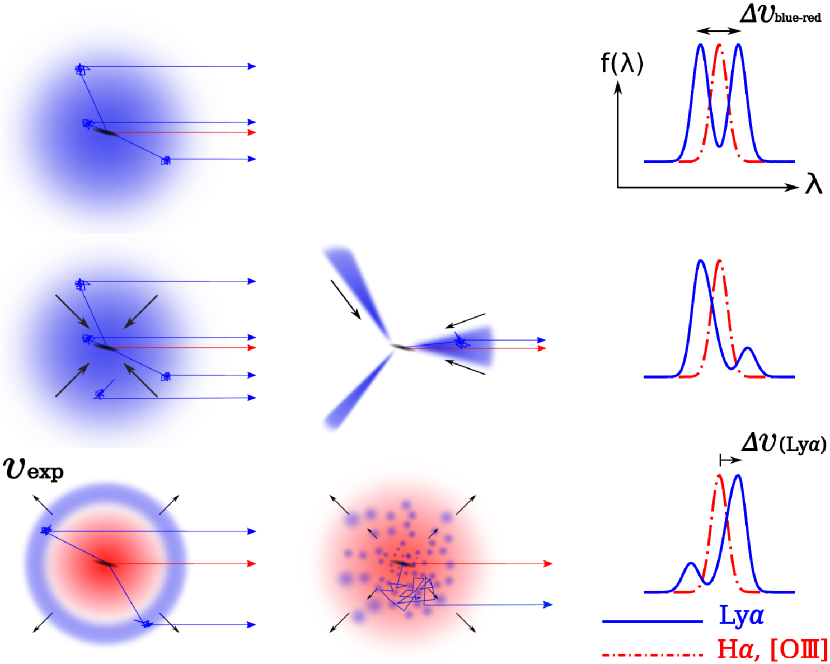
To distinguish among such possibilities requires a comparison of the center of the Ly line profile with that of a non-resonant line like H 6563 or [O III] 5007. These rest-frame optical nebular lines are better measure of the Ly blob’s systemic velocity, i.e., of the precise redshift, because it is not seriously altered by radiative transfer effects and is more concentrated about the galaxies in the Ly blob’s core. We illustrate this line offset technique in Figure 1. While gas accretion models predict different line profile shapes depending on various assumptions, e.g., the location of ionizing sources, the detailed geometry, and the velocity field, they all predict that the overall Ly line profile, originating from the central source or the surrounding gas, will be blue-shifted with respect to the center of a non-resonant line such as H that is optically thin to the surrounding H I gas (Verhamme et al., 2006; Dijkstra et al., 2006a). This is because the red-side of the Ly profile will see higher optical depth due to the infalling (approaching) gas. In other words, the H kinematics represent the true underlying velocity field if the Ly blob is accreting gas from the intergalactic medium. The same is true if the gas is outflowing, except that the Ly line will be redshifted with respect to H. Thus, if we measure the direction of the Ly–H and/or Ly–[O III] line offset (hereafter defined as ), we can distinguish an inflow from an outflow.
The first such analysis for two Ly blobs shows that Ly is coincident with or redshifted by 200 km s-1 from the H line center (Yang et al., 2011, see also McLinden et al. 2013). These offsets are much smaller than the 1000 km s-1 expected from superwind models (Taniguchi & Shioya, 2000) and even smaller than those typical of Lyman break galaxies (LBGs), which are widely believed to have galactic outflows (Steidel et al., 2004, 2010). Thus, if is a proxy for outflow velocities ( ), our initial results suggest that star formation- or AGN-produced winds may not be required for powering Ly blobs, making other interpretations of their emission more likely.
However, we do not yet know if these results are representative of all Ly blobs or if we have failed to detect strong flows due to the projected orientations of these two sources. For example, the gas flow may not be isotropic. As in bipolar outflows in M82 (e.g., Bland & Tully, 1988), a galactic-scale outflow may occur in the direction of minimum pressure in the surrounding interstellar medium (ISM), often perpendicular to the stellar disks. Or, if gas accretion is taking place in Ly blobs, numerical simulations suggest that the gas infall may occur preferentially along filamentary streams (Kereš et al., 2005, 2009; Dekel et al., 2009). Thus, if the bulk motion of gas (either infalling or outflowing) happens to be mis-aligned with our line of sight (LOS), then we may underestimate or even fail to detect the relative velocity shifts. Therefore, it is critical to measure for a larger sample to average over any geometric effects and obtain better constraints on the incidence, direction, speed, and isotropy of bulk gas motions in blobs.
In this paper, in order to overcome this geometry effects, we present new X-shooter optical and near-infrared (NIR) spectroscopy of the six more Ly blobs at . Note that the survey redshift of this Ly sample has been carefully selected to allow all important rest-frame optical diagnostic lines (e.g., [O II] 3727, [O III] 5007, H 4868, H 6563) to fall in NIR windows and to avoid bright OH sky lines and atmospheric absorption (Yang et al., 2009, 2010). With the resulting large sample of measurements (a total of eight), we determine the relative frequency of gas infall versus outflow.
Benefiting from X-shooter’s high spectral resolution and wide spectral coverage (3000Å – 2.5µm), we constrain the gas kinematics in Ly blobs using three different tracers: (1) the offset of the Ly profile with respect to a non-resonant nebular line, (2) the offset of an interstellar metal absorption line in the rest-frame UV with respect to the nebular emission line, and (3) a new indicator, the profile of the spectrally-resolved [O III] emission line.
This paper is organized as follows. In Section 2, we review our sample selection and describe the X-shooter observations and data reduction. In Section 3, we present the results from the X-shooter spectroscopy, confirming the Ly blobs’ redshift (Section 3.2). We present 1–D and 2–D spectra in Section 3.2 and Section 3.3, respectively. We briefly summarize the properties of individual systems in Section 3.4. In Section 3.5, we constrain the gas kinematics using the three different techniques noted above. In Section 3.5.1, we compare the Ly profiles with the H or [O III] line centers to discriminate between simple infall and outflow scenarios and present the statistics for the sample. In Section 3.5.2, we describe the interstellar absorption lines detected in three galaxies. In Section 3.5.3, we inspect the [O III] emission line profiles in detail to look for possible signatures of warm outflows. In Section 3.6, we constrain the H I column density of a Ly blob by comparing its Ly profile with a simple radiative transfer (RT) model. In Section 3.7, we focus on a Ly blob with a blue-shifted Ly component not directly associated with any detected galaxy, a possible marker of gas inflow. Section 5 summarizes our conclusions. Throughout this paper, we adopt the cosmological parameters: = 70 km s-1 Mpc-1, , and .
2. Observations and Data Reduction
2.1. Sample
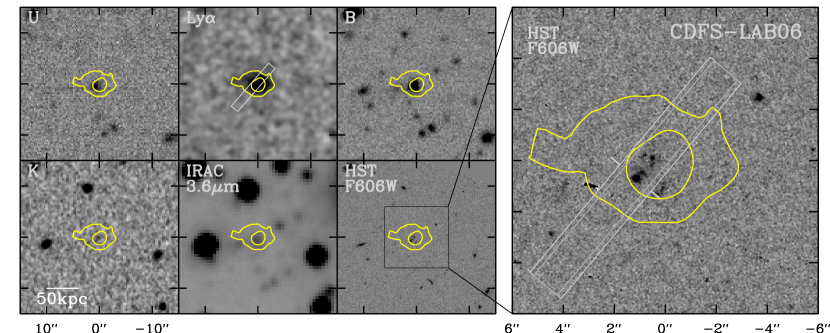
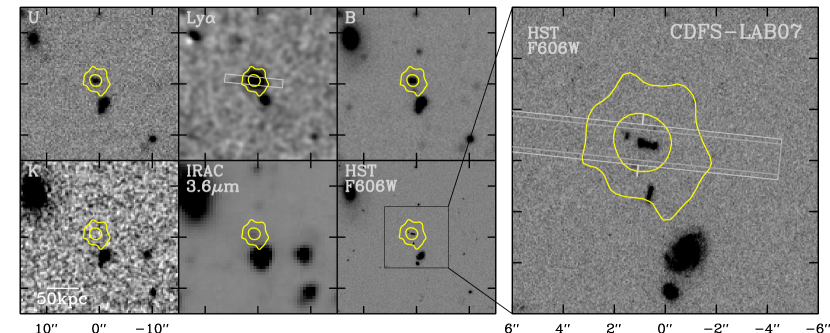
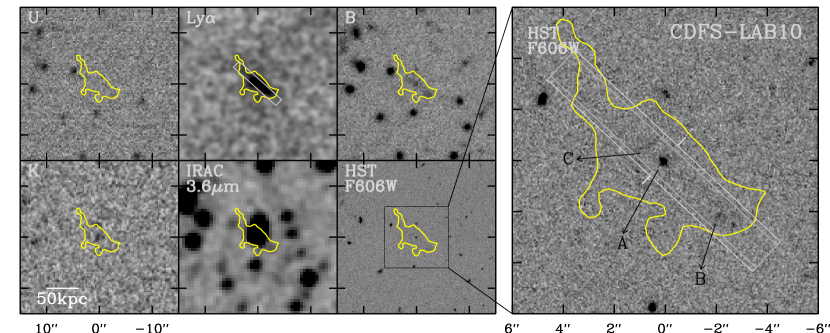
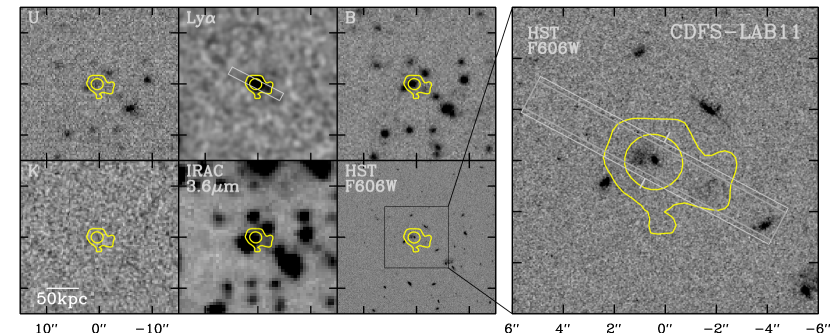
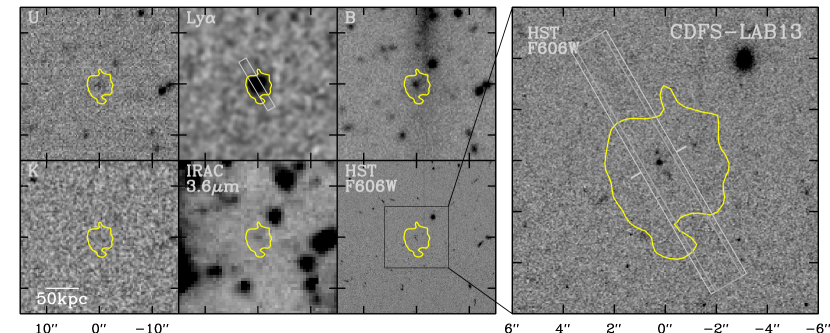
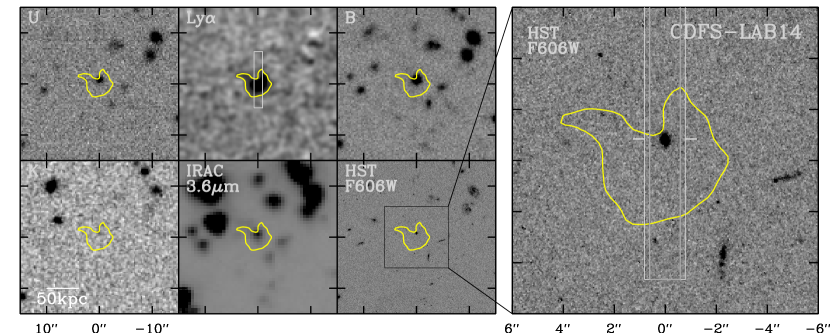
We observe six Ly blobs from the Yang et al. (2010) sample. These targets were chosen such that they are not X-ray detected [ (0.3 – 4.2) erg s-1; Lehmer et al. (2005); Luo et al. (2008)], and thus are not obvious AGN, as our primary goal is to cleanly detect gas infall or outflow. These six blobs lie in the Extended Chandra Deep Field South (ECDFS) and were discovered via deep narrowband imaging with the CTIO-4m MOSAIC–II camera and a custom narrowband filter (NB403). This filter has a central wavelength of Å, designed for selecting Ly-emitting sources at . In Figure 2, we show the images of these six Ly blobs (CDFS-LAB06, 07, 10, 11, 12, 13, 14) at various wavelengths (UBK, Ly, Spitzer IRAC 3.6µm and HST F606W; Gawiser et al. 2006, Yang et al. 2010, Damen et al. 2011, Rix et al. 2004).
With X-shooter, we are targeting intermediate luminosity ( 1043 erg s-1) Ly blobs: the higher Ly blob ID indicates the lower Ly luminosity in our sample. Our sample was obtained from a blind survey, so combined with the two brightest Ly blobs presented in Yang et al. (2011), the full sample (a total of eight) spans a wide and more representative range of Ly luminosity and size. Furthermore, the transition from compact Ly emitters (LAEs; isophotal area of a few arcsec2) to extended Ly blobs (10 arcsec2) is continuous (Matsuda et al., 2004; Yang et al., 2010), thus the gas kinematics for our faintest Ly blobs might share the properties with those of bright LAEs. We refer readers to Yang et al. (2010) for details of the sample selection and to Yang et al. (2011) for the first results of our spectroscopic campaign.
2.2. UV-to-NIR Spectroscopy
We obtained high resolution optical–NIR (3000Å– 2.5µm) spectra of the six Ly blobs using X-shooter, a single object echelle spectrograph (Vernet et al., 2011), on the VLT UT2 telescope in service mode between 2010 November 6 and 2011 January 28. In Table 1, we summarize the X-shooter observations. In Figure 2, we show the location of the spectrograph slit on the sky, which was placed on UV-brightest galaxy or galaxies embedded at or near the Ly blob center. These galaxies or galaxy fragments also lie in the region of brightest Ly emission. Later, we assume that their redshifts mark the systemic redshift of the Ly blob.
X-shooter consists of three arms (UVB, VIS, NIR), which covers the spectral ranges of 3000Å–5500Å, 5500Å–1µm, and 1µm–2.5µm, respectively. This enormous spectral coverage allows us to obtain both Ly and H lines with a single exposure in contrast to our previous approach (Yang et al., 2011) involving both optical and NIR spectrograph. Furthermore, X-shooter can detect at least one of the nebular lines ([O II], H, [O III], H), which will provide the systemic velocity of the embedded galaxies. Because at the redshift of our targets () most of the emission lines of interest (Ly, C IV, He II, [O II], [O III], H) are located in the UVB or NIR arms, we focus only on the UVB ( = 900Å–1660Å) and NIR ( = 3020Å–7500Å) part of spectra in this paper.
The observations were carried out over eight nights and 14 observing blocks (OBs) of one hour duration each. The sky condition was either clear or photometric, and the guide camera seeing ranged from 06 to 12 with a median of 08 depending on the OB. We adopted 16 and 12-wide slits for UVB and NIR, yielding a spectral resolution of 3300 and , respectively. The slit length is rather small (12″) compared to typical long-slits. In each OB, we placed the slit on a target using a blind offset from a nearby star. Using acquisition images taken after the blind-offset, we estimate that the telescope pointing and position angle of the slit are accurate within 0.2″ and 0.5° on average, respectively. The individual exposure times were 680s and 240s for UVB and NIR, respectively, and the telescope was nodded along the slit by 2″ while keeping the science targets always on the slit but at different detector positions. Total exposure times were 0.8 – 3.2 hours depending on the targets. In general, we were always able to detect both Ly and at least one of the optical nebular lines within one OB.
For accurate wavelength calibration, we took ThAr lamp frames through pinhole mask right before the science exposures and at the same telescope pointing to compensate for the effect of instrument flexure. For the UVB arm, we obtained another ThAr arc frame at the end of each OB in order to verify the wavelength solution where no bright sky lines are available. Telluric standard stars (B–type) were taken after or before the science targets with similar airmass to correct for atmospheric absorption in the NIR. Spectrophotometric standard stars were observed with 5″-wide slits once during the night as a part of the observatory’s baseline calibration plan.
2.3. Data Reduction
We reduce the data using the ESO X-shooter pipeline (version 1.3.7). In the UVB arm, the frames are overscan-corrected, bias-subtracted, and flat-fielded with halogen and deuterium lamps. The sky background is then subtracted in the “stare”-mode of the pipeline by modeling the sky in 2–D as described in Kelson (2003). In the NIR arm, dark current and sky background are removed from each science frame by subtracting the dithered “sky” frame (“nodding”-mode of the pipeline). Then, we flat-field the data and correct for cosmic-ray hits and bad pixels. In both arms, these flat-fielded, sky-subtracted frames were corrected for the spatial distortions using multi-pinhole arc frames.
Because we will compare the velocity centers of the Ly and H lines, we carefully verify the wavelength calibration. In the NIR, we compare the wavelength solutions obtained from the OH sky lines in the science frames to those from the daytime arc lamps and flexure-compensation frames, i.e., the pipeline solutions. In the UVB, we also compare the wavelength solutions obtained from the attached ThAr arc frames with the pipeline solutions. Our wavelength calibration is accurate within 4 km s-1 in both arms. Furthermore, in the cases where we visited sources multiple times, all spectra agree each other. These frames are then rectified (resampled) and combined to create 2–D spectra. We collapse the 2–D spectra in the wavelength direction to measure the spatial extent of each emission line. Then we extract 1–D spectra from [, ] apertures, where the is the Gaussian width of the spatial profile. The aperture sizes are 2″– 35 in the UVB and 15 – 25 in the NIR depending on the target. Finally, the 1–D spectra are corrected to heliocentric velocities and transformed to the vacuum wavelength.
3. Results
3.1. Systemic Redshift from [O III] and H
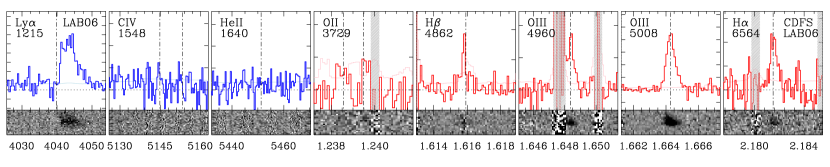
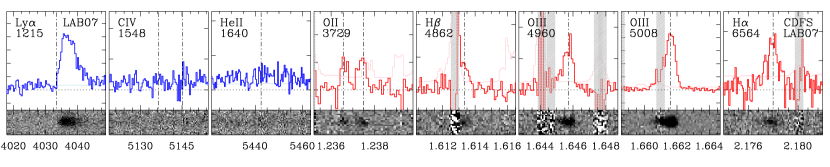
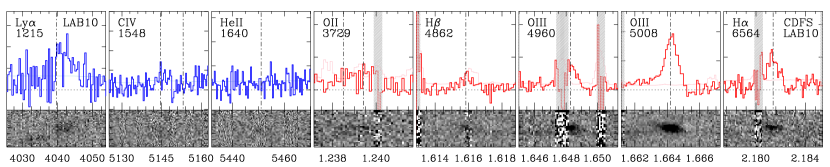
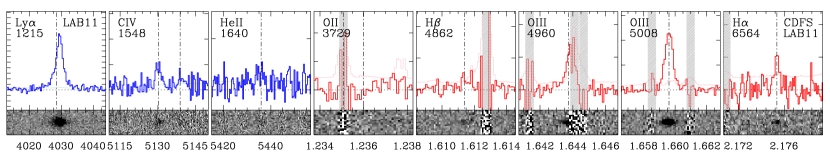
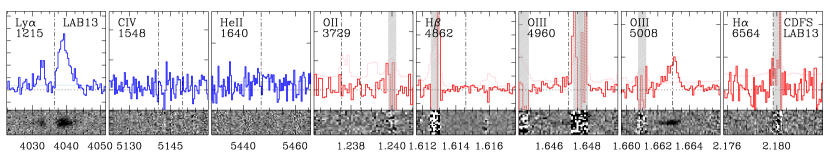
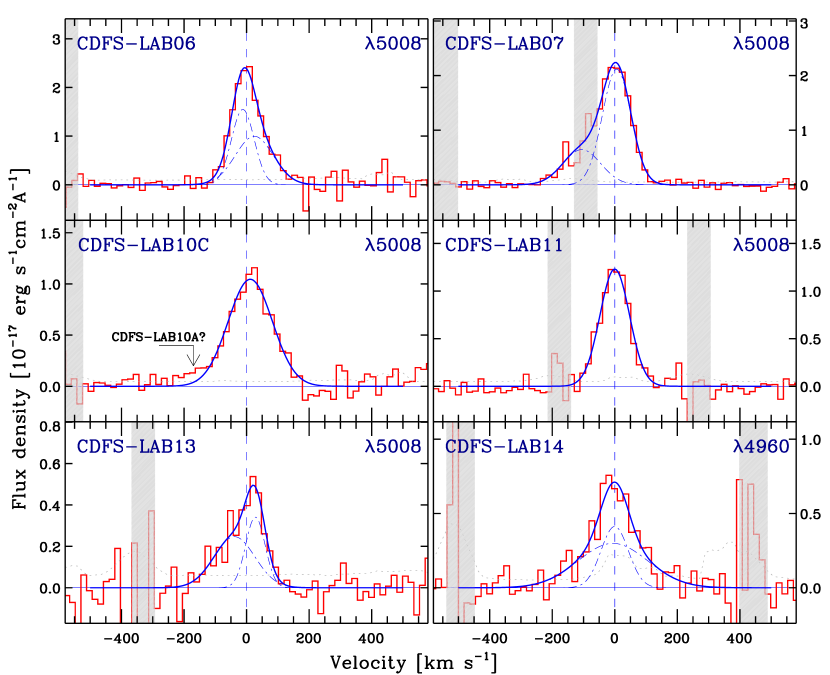
Various emission lines in the UVB and NIR arms confirm that Ly blobs lie at the survey redshift, . In addition to Ly and H, we cover other UV emission lines and the non-resonant [O II] 3727,3729, [O III] 4959,5007, and H 4861 lines. In Figure 3, we show 1–D and 2–D spectra of the six Ly blobs. The first three columns show the rest-frame UV emission lines (Ly, C IV, He II) from the X-shooter UVB arm, and the remaining columns show the rest-frame optical nebular emission lines ([O II], H, [O III], H) from the NIR arm.
Among the rest-frame optical nebular lines, the [O III] line is the brightest and detected with highest signal-to-noise (S/N) ratio in all cases, partly due to the low sky background and thermal instrument background in H-band. We determine the systemic redshift using [O III] doublets. In one case (CDFS-LAB14), the brighter [O III] line () falls on top of an OH sky line, thus making it impossible to determine the line center. In this case we used the fainter [O III] line (). The vertical dashed lines in Figure 3 indicate the line centers determined by [O III] lines, which are then overlayed on other emission line profiles. As expected, we find that the line centers of all non-resonant emission lines agree well each other, to within 10 km s-1 , showing that all of these lines are good indicators of systemic velocity. Thus, the brightest [O III] line can serve as best emission line to target for this survey redshift and instrument.
3.2. 1–D Ly Profiles
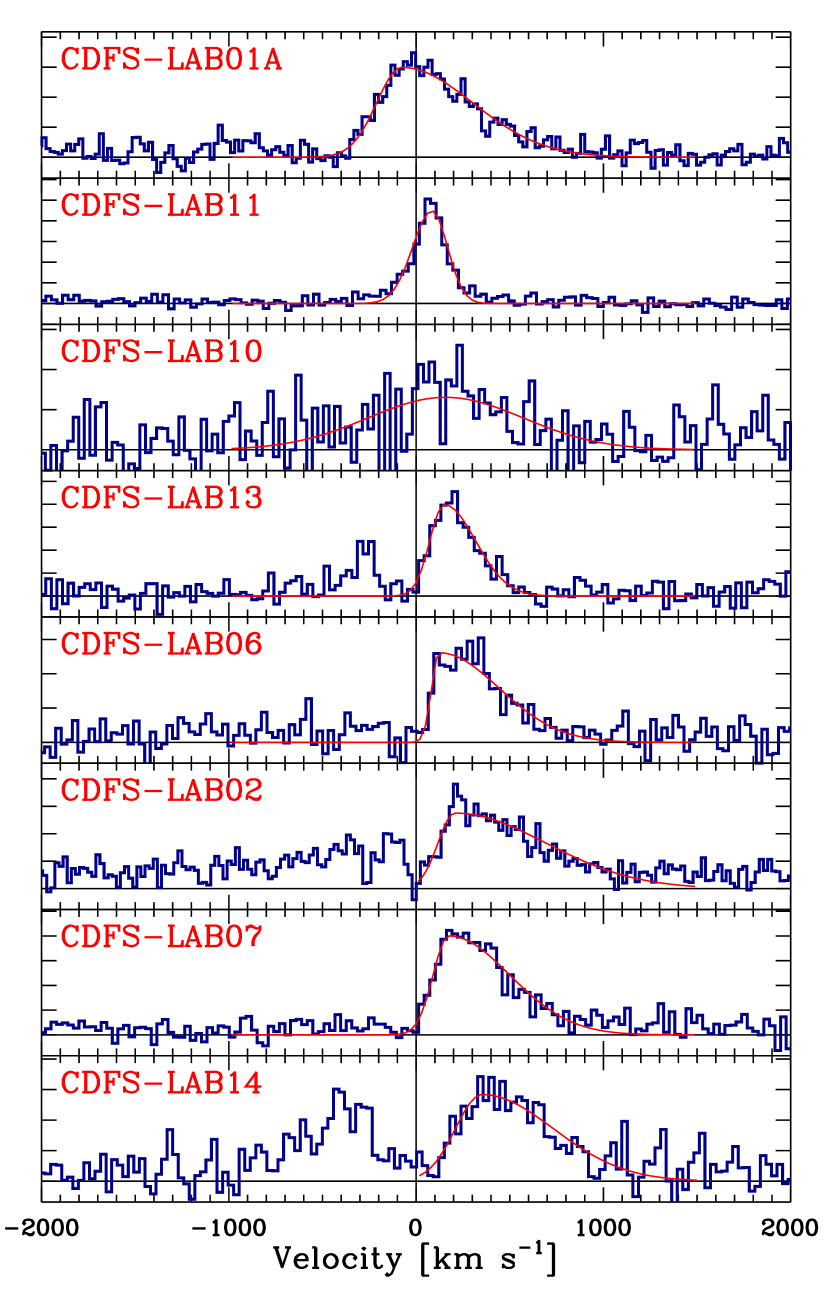
The Ly profiles are significantly broad compared to the non-resonant lines (H and/or [O III]) in six cases out of the sample of eight Ly blobs, including the two from our previous work (Yang et al., 2011). These integrated 1–D profile shapes range from an asymmetric single-peaked profile (CDFS-LAB06, 07, 10), to a double-peaked profile with a stronger red peak (CDFS-LAB02, 13), to a double-peaked profile with two similar intensity peaks (CDFS-LAB14). The Ly profiles of even this small sample show extremely diverse morphologies consistent with simple radiative model predictions (Verhamme et al., 2006, 2008; Dijkstra et al., 2006a) with varying geometry and outflow velocities (see also Matsuda et al., 2006; Saito et al., 2008; Weijmans et al., 2010).
The remaining two Ly profiles are narrower relative to the [O III] lines and show slightly extended wings (CDFS-LAB01 and 11). Note that the Ly line width of CDFS-LAB01 is one of the largest among our sample, but the blue side of its Ly profile agrees well with its H profile (Yang et al., 2011). While there is an underlying broad component in CDFS-LAB11, the width of the dominant narrow component is small, comparable to that of the [O III] line (see §4.4). These are the two Ly blobs where He II and C IV emission lines are also detected indicating that they contain a hard ionizing source, possibly an AGN. If photo-ionization by an AGN is indeed responsible for the He II and C IV emission, and possibly the extended Ly emission as well, the discovery of narrow Ly profiles suggests that the Ly blob gas is highly-ionized, i.e., that the resonant scattering of Ly is not effective enough to alter the profile significantly. We will further investigate the details of these He II, C IV emission lines and the implications for AGN in a future paper (Y. Yang in preparation).
The fraction of double-peaked profiles is significant: 38% (3/8), which is roughly consistent with the findings for LBGs and LAEs at = 2–3. Among LBGs, Kulas et al. (2012) find that 30% of LBGs with Ly emission show multiple-peaked profiles. Yamada et al. (2012) also find that 50% of LAE’s profiles have multiple peaks.


3.3. 2–D Ly and [O III] Profiles
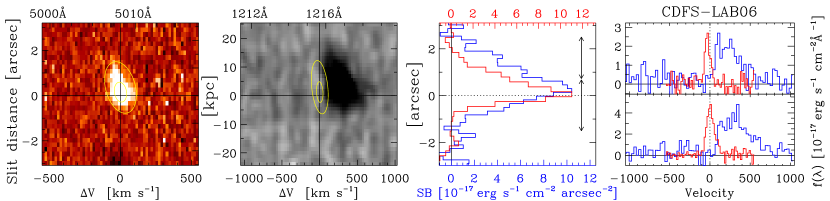
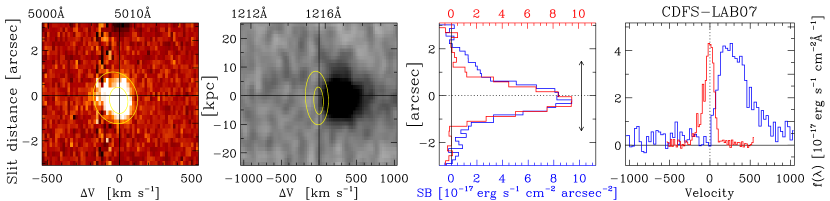
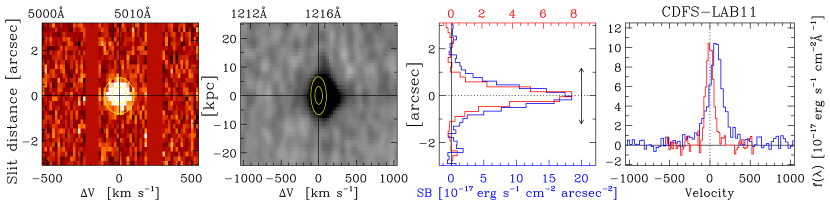
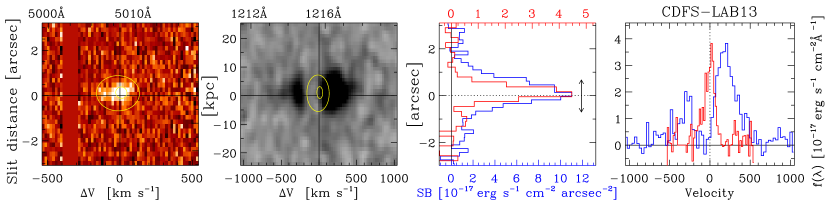
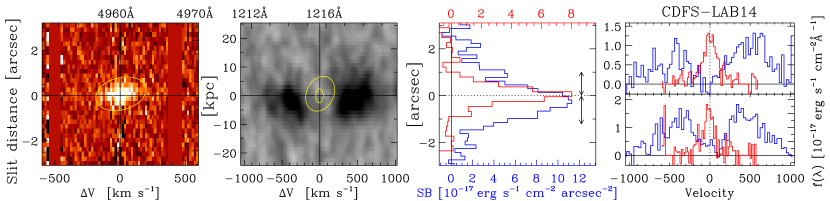
Using 2–D spectra, we detect the extended Ly lines and identify the exact locations from which the Ly or [O III] line originates. In Figure 4, we show close-ups of the 2–D [O III] and Ly profiles in the first and second columns, respectively. To aid the comparison between the [O III] and Ly profiles, we overlay the rough boundary of the [O III] spectrum on each Ly panel with ellipses. The third column shows the spatial profiles along the slit, i.e., collapsed in the wavelength direction. The last column shows the 1–D Ly and [O III] profiles that are extracted from the different parts of the slit, as indicated with vertical arrows in the third column.
In four cases (CDFS-LAB06, 10, 13, 14), the Ly spectrum is spatially extended relative to the [O III] line, confirming the narrowband imaging result that the Ly-emitting gas extends beyond the embedded galaxies that are probably responsible for the [O III] emission. Note that the X-shooter spectroscopy reaches much shallower Ly surface brightness limit (1.5–3 erg s-1 cm-2 arcsec-2) than the narrowband imaging (5 erg s-1 cm-2 arcsec-2; 3 limit).
In two Ly blobs (CDFS-LAB06 and 10), the [O III] lines are spatially resolved. However, there is no evidence that the [O III] or H lines are extended beyond the UV continuum emission arising from stars in the embedded galaxies seen in Figure 2. Deeper NIR spectroscopic, preferentially IFU, observations are required to better define the spatial extent of these lines and to measure the spatially-resolved gas kinematics. Throughout the paper, we assume that the [O III] and H lines originate from the central embedded galaxies, not from the extended Ly-emitting gas, and thus that their line centers represent the systemic velocity of the Ly blob. In the next section, we briefly describe individual systems in detail.
3.4. Notes for Individual Objects
3.4.1 CDFS-LAB06
CDFS-LAB06 has two rest-frame UV sources with small separation (08; 6.5 kpc) in the HST image (Fig. 2). Both components (or clumps) were placed in the X-shooter slit and are detected in [O III] and Ly (Fig. 4). These two sources are separated by only 50 km s-1 in velocity space, thus it is not clear whether they belong to one galaxy or are interacting with each other. We adopt the redshift of the brighter UV source as the systemic velocity of CDFS-LAB06. The Ly emission detected in the spectrum (between = and ″) is spatially extended due to the other galaxy, so it does not represent the IGM or circum-galactic medium (CGM).
3.4.2 CDFS-LAB07
The galaxy within CDFS-LAB07 has a bar-like morphology in the HST image with which we align the slit. This galaxy or galaxy fragments were marginally resolved in the [O III] emission line. All optical nebular emission lines ([O II], H, [O III], and H) are detected. Faint UV continuum emission is marginally detected, allowing us to study the gas kinematics with metal absorption lines (§3.5.2). The [O III] and H lines show asymmetric profiles extending toward the blue. This profile can be fitted with a narrow Gaussian component at the velocity center superposed on the blueshifted broad component (§3.5.3).
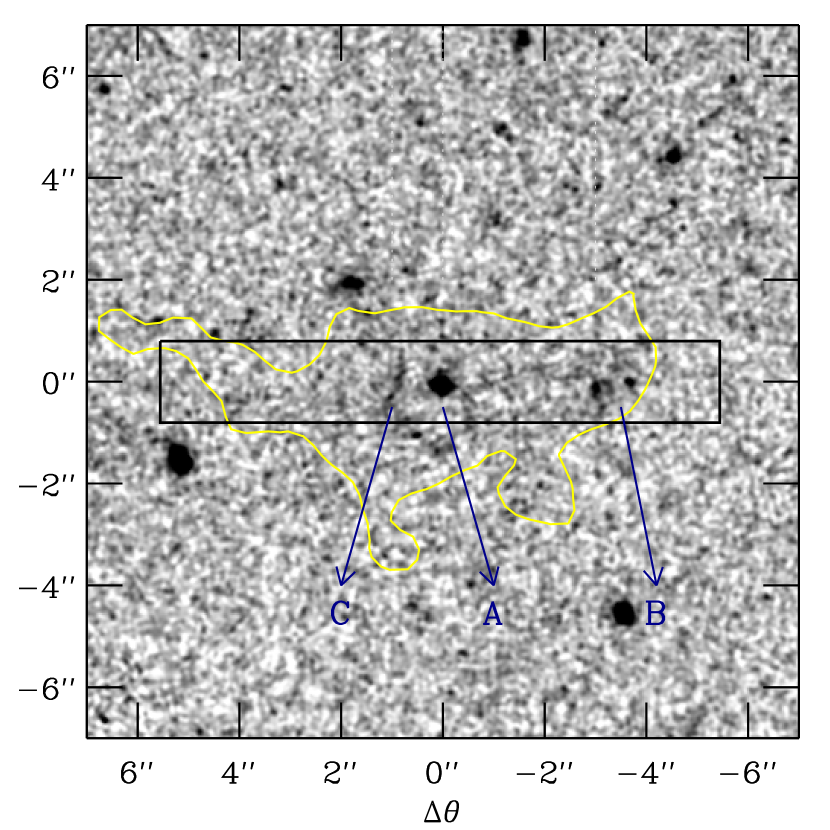
3.4.3 CDFS-LAB10
CDFS-LAB10 is the most puzzling and complex source in the X-shooter sample. The Ly emission in the narrow-band image is elongated over 10″ (80 kpc). In the NIR spectrum, three sources are detected: two with [O III] emission lines (galaxies B and C), and the other (galaxy A) with very faint continuum (Fig. 4). This NIR continuum source (galaxy A) is located at the slit center, while the strongest [O III]-emitting source (galaxy C) is offset by 1″ toward north-east from the center and barely detected in the HST image. The 2–D [O III] spectrum of galaxy C shows a velocity shear indicative of rotating disk. In the 2–D Ly spectrum, there are also three distinct components. Although the 1–D Ly spectrum of the entire blob looks single-peaked with a broad linewidth, it is in fact composed of these three components. We will investigate these various emission line and continuum sources in §3.7.
3.4.4 CDFS-LAB11
There are one compact UV source at the slit center and a diffuse emission toward northeast in the HST image. It appears that the [O III] emission originates from the central compact source. Unlike commonly observed broad Ly profiles found in Ly blobs and emitters, CDFS-LAB11 has a peculiar Ly profile that is almost symmetric and narrow. As will be discussed in §4.4, both narrow and underlying broad components are required to explain the Ly profile. The Ly is redshifted against H by small amount: = 846 km s-1 . Both [O III] and Ly are spatially compact (Fig. 4). Both C IV 1546 and He II 1640 emission lines are also detected (Fig. 3), implying the presence of hard ionizing source. A total of two Ly blobs from our ECDFS sample (CDFS-LAB01 and 11; 2/8) show these emission lines. Note that C IV and narrow He II line emission are commonly detected in bright Ly blobs (Dey et al., 2005; Scarlata et al., 2009; Prescott et al., 2009; Yang et al., 2011), while the nature of the hard-ionizing source is unknown.
3.4.5 CDFS-LAB13
CDFS-LAB13 has a double-peaked profile with a stronger red peak, and asymmetric [O III] profile (§3.5.3). Ly in CDFS-LAB13 is likely more extended, but the low S/N of the [O III] line makes the comparison difficult. There are multiple galaxy fragments in the HST UV continuum image, but they were not spatially resolved in the X-shooter observations.
3.4.6 CDFS-LAB14
In the HST and narrowband images, a UV source is located at the upper boundary of the Ly emission contours. In the X-shooter 2–D spectra (Figure 4), the [O III] line is centered on this UV continuum source and Ly is more extended toward the south in agreement with narrowband imaging. CDFS-LAB14 is one of two cases where extended Ly emission is well detected in the spectroscopy. The Ly profile has two peaks with similar intensities. The peak separation narrows as the slit distance from the central galaxy increases. Faint UV continuum is also detected at the location of the UV source allowing us to measure outflow speed from metal absorption lines (§3.5.2). Combining the Ly and the absorption profiles, we will put constraints on the gas kinematics and the neutral column density of this system (§3.6). [O III] has a broad wing on top of the narrow component (§3.5.3)
3.5. Gas Kinematics
In this section, we constrain the gas kinematics in the Ly blobs using three different techniques and compare those results. First, for the six blobs in the X-shooter survey, we compare the optically thick Ly and non-resonant [O III] line (either or in the case of CDFS-LAB14) to measure Ly velocity offsets from the systemic velocity of the Ly blobs. For the two Ly blobs from our previous work (CDFS-LAB01A and 02; Yang et al. (2011)), where an [O III] line is unavailable, we use H. As mentioned previously, the line centers of both [O III] lines and H are all consistent. Second, we constrain the outflow speed from the interstellar metal absorption lines in three galaxies where we are able to detect the rest-frame UV continuum in the spectrum. Lastly, we present a new tracer of kinematics in four Ly blobs: characterizing the breadth and asymmetry of the [O III] line profile. Note that while we detect an asymmetric wing in some [O III] line profiles, it does not affect the line centroid, which is essential in determining the systemic velocity in the first technique above.
3.5.1 Ly – [O III] offset
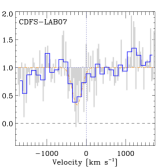
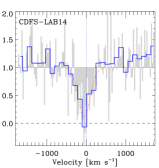
We compare the peak of each Ly profile with the center of a non-resonant nebular emission line, particularly [O III]. Throughout the paper, the Ly–H and Ly–[O III] offsets are used interchangeably to represent the Ly offset from the systemic velocity: . Figure 5 shows eight Ly profiles from this work and from Yang et al. (2011), plotted with increasing .
Because Ly spectra are somewhat noisy because of the small spectral dispersion (20–30 km s-1 per pixel), we measure using the following two methods. First, we measure the velocity of the Ly peak after smoothing the spectra with a Gaussian filter with FWHM = 90 km s-1 , corresponding to our velocity resolution. Second, we fit the red peaks with an asymmetric Gaussian function, which consists of two Gaussian functions with different FWHMs being joined at the center. The two measurements agree to within 50 km s-1 , except for CDFS-LAB06 where the second method gives = 120 km s-1 compared to 320 km s-1 from simple smoothing due to the very sharp edge at the blue side of Ly profile. We adopt the second measurements in this paper and show these fits in Figure 5 and Table 2. None of the conclusions in this paper are affected by this choice.
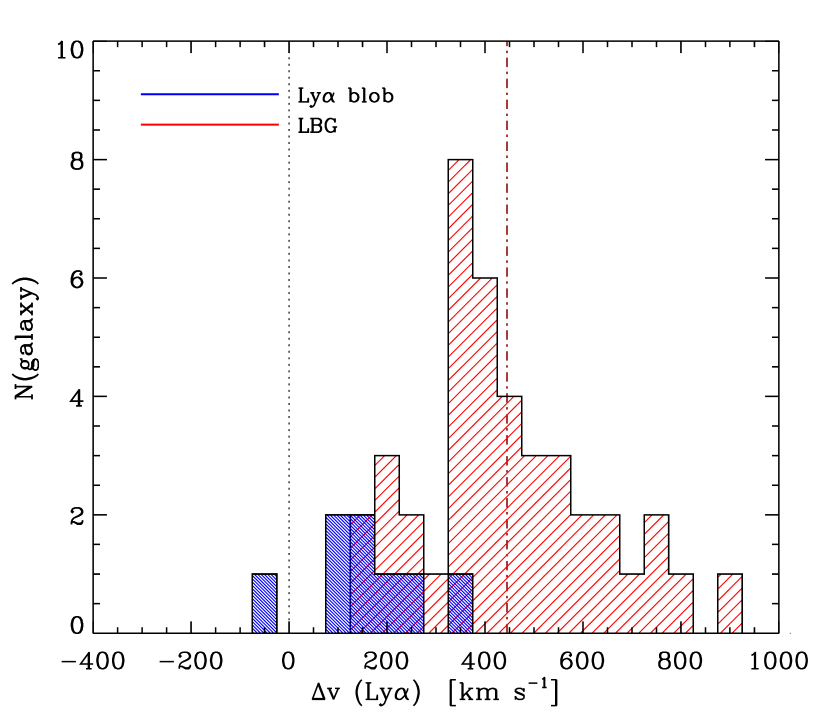
Figure 6 shows the distribution of of the eight Ly blob galaxies in comparison with 41 LBGs that have both H and Ly spectra (Steidel et al., 2010). Because the spectral resolutions of our Ly spectra obtained from VLT/X-shooter and Magellan/MagE are higher than those of the Ly profiles of the LBGs (FWHM 370 km s-1 ), we test if the different spectral resolutions affect the Ly blob–LBG comparison. We repeat the measurement of after convolving our Ly profiles to the spectral resolution of LBG sample. The values change by a negligible amount (only 50 km s-1 ) except for CDFS-LAB02, where increases by +100 km s-1 because of its sharp red peak. Therefore, we conclude that the distributions of Ly blobs and LBGs can be compared directly.
The distribution for galaxies within our Ly blobs reveals smaller velocity offsets than typical of LBGs, confirming previous claims (Yang et al., 2011, see also McLinden et al. 2013). Galaxies within blobs have = 60 +400 km s-1 with an average of = 160 km s-1 , while LBGs at similar redshifts have = 250 – 900 km s-1 with = 445 km s-1 .
The remaining question is how to interpret these small values. Two possibilities are: (1) is a proxy for the gas outflow velocity ( ), suggesting that the outflows here are weaker than in other star-forming galaxies at = 2–3 (Verhamme et al., 2006), or (2) there is less neutral gas close to the systemic velocity of the embedded galaxies (Steidel et al., 2010), and is independent of the outflow speed. We discussed the caveats associated with interpreting in Yang et al. (2011) and revisit this issue in §4.2.
In the direction of the embedded galaxies, we do not find any Ly profile that is blue-peak dominated, i.e., 0 km s-1 . Therefore, there is no evidence along these lines-of-sight for infalling gas (but see §3.7). While the statistics are still small, we place an upper limit on the covering factor of infalling gas (if any) detectable with the technique. Here the covering factor of any inflowing streams like those predicted by cold-mode accretion (Kereš et al., 2005, 2009; Dekel et al., 2009) must be less than 13% (1/8). We further discuss the covering factor of cold streams in §4.1.
3.5.2 Interstellar Metal Absorption Lines
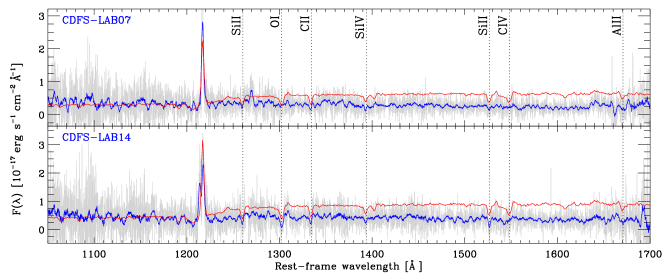

While strong emission lines such as Ly and [O III] are relatively easy to detect, interstellar metal absorption lines provide a less ambiguous way to measure the outflow velocity of neutral gas lying in front of the galaxies targeted with our spectroscopic slit. However, due to the faint UV continuum ( = 23.8–26.5 mag) of our targets, even 8-m telescope struggles to detect their continuum for absorption line studies. Therefore, we obtain higher-S/N absorption line profiles by stacking several lines in each galaxy. Our aim is to test the mild outflow interpretation of our results by comparing the velocity offset of the stacked ISM absorption profile to the systemic velocity of the galaxy: .
Among the six Ly blobs, only the UV continua of the galaxies in CDFS-LAB07 and CDFS-LAB14 have S/N higher than 1.5 per spectral pixel (20–30 km s-1 ), allowing us to marginally extract the absorption profiles. Figure 7(top) shows the rest-frame UV spectra of these two galaxies in comparison with the LBG composite (Shapley et al., 2003). For comparison, we also show the boxcar-smoothed spectra over 20 pixels, corresponding to a velocity width of 450–600 km s-1 . While it is difficult to identify the absorption lines in the un-binned spectra, the smoothed spectra show a good match to the composite spectrum, revealing several low- and high-ionization lines.
As suggested above, it is still difficult to measure individual absorption line profiles, so we stack the five low-ionization lines: Si II 1260, O I 1302, C II 1334, Si II 1526, Al II 1670 to increase the S/N. We do not include the C IV and Si IV lines in the stacking, as these high ionization lines are contaminated with broader absorption features arising from stellar winds from massive stars (Shapley et al., 2003), which are hard to remove in our low S/N spectra. Furthermore, it is possible that these high ionization lines trace different state of gas, while the low ionization lines show similar profiles (Steidel et al., 2010). In Figure 7(bottom), we show the stacked absorption profiles for three galaxies, including the re-analyzed CDFS-LAB02 spectrum that we obtained earlier with Magellan/MagE (Yang et al., 2011).
The stacked absorption profiles here are consistent with weaker outflows than required by the super/hyperwind hypothesis for Ly blob emission (Taniguchi & Shioya, 2000). These profiles are also consistent with the interpretation of small indicating small outflow speed, as discussed in §3.5.1. In two galaxies (within CDFS-LAB02 and 07), the absorption profiles have minima around 200 km s-1 and might extend up to 500 km s-1 , although the exact end of the profile is uncertain due to the low S/N. The shapes of these two absorption profiles are similar to those of typical star-forming galaxies (i.e., LBGs) at the same epoch (Steidel et al., 2010), and the implied outflow velocities are comparable to or slower than in the LBGs. By fitting a Gaussian profile, we obtain = 177 31 km s-1 and 236 31 km s-1 for CDFS-LAB02 and CDFS-LAB07, respectively. We do not find any redshifted absorption component, which is consistent with the absence of any blueshifted Ly emission line associated with these galaxies.
In contrast, the profile of CDFS-LAB14’s galaxy has a minimum at 0 km s-1 ( = 59 32 km s-1 ) without any significant blueshifted (outflowing) component. While the other two profiles terminate roughly at 0 km s-1 , CDFS-LAB14’s profile extends to 0 km s-1 . Thus, its ISM absorption and Ly profiles are both consistent with the simple RT model expectation that a symmetric, double-peaked Ly profile should emerge from static gas or the absence of of bulk motions. Furthermore, the absorption profile is almost saturated, indicating that the column density in this Ly blob could be higher than for the other two systems. We will place a constraint on the H I column density of its Ly-emitting gas in §3.6.
For CDFS-LAB14, the location of the dip between the blue and red Ly velocity peaks changes little for the two extraction apertures shown in Figure 4: one along the line of sight toward the embedded galaxy (the [O III] source) and the other encompassing the spatially extended gas around = 0.5″. Note that such a trough between Ly peaks is often interpreted as arising from absorption by the neutral media between the Ly source and observers. For example, Wilman et al. (2005) claim that their IFU spectra of a Ly blob (SSA22-LAB02; Steidel blob 2) suggest that the Ly emission is absorbed by a foreground slab of neutral gas swept out by a galactic scale outflow. More recently, Martin et al. (2014) show instead that the absorption troughs in the Ly emission are actually located at the systemic velocity determined by the [O III] emission line, i.e., there are negligible velocity offsets between any foreground screen and the systemic velocity. CDFS-LAB14 also demonstrates that a coherent velocity trough, at least over a 10 kpc scale, can arise entirely from complicated radiative transfer effects even if there are no significant bulk motions in the Ly-emitting gas.
3.5.3 Broadening and Asymmetry in [O III] Profile
The central galaxies in four Ly blobs (CDFS-LAB06, 07, 13, 14) show a broad and/or shifted underlying component to the [O III] profile, which provides additional constraints on the kinematics of warm ionized gas in the vicinity of the galaxies. To the authors’ knowledge, this is the first detection of broadened, asymmetric [O III] profiles from narrowband-selected Ly-emitting galaxies at high redshifts, demonstrating that high spectral resolution is required to fully exploit the NIR spectroscopy of Ly galaxies.
We emphasize again that these broad underlying components, even when shifted in velocity, do not affect our measurements of [O III] line centers, because the [O III] flux density at the core is dominated by the narrower component, which is likely to arise from nebular regions in the embedded galaxy. As discussed previously, the line centers determined from other non-resonant emission lines (e.g., H and H) agree to within 10 km s-1 . Therefore, our measurements of systemic velocity, critical for determining and , remain unchanged.
In Figure 8, we show close-ups of the [O III] profiles. In CDFS-LAB11, which has the narrowest and the most symmetric Ly profile, the [O III] line is also symmetric. CDFS-LAB10 is excluded from the following analysis because its [O III] line is elongated in position-velocity space, suggesting some velocity shear, and the neighboring galaxy (CDFS-LAB10A) makes it difficult to reliably extract its profile (see §3.7 for more details of this system). In the remaining four Ly blobs, the [O III] profile either has an asymmetric wing (CDFS-LAB06, 07, 13) or a symmetric broad component or components (CDFS-LAB14). Note that the CDFS-LAB06 profile in Figure 8 also includes the light from a faint neighbor or clump to the northwest that is slightly blueshifted (50 km s-1 ). Therefore, the somewhat redshifted wing of CDFS-LAB06 is not due to this contamination.
To extract the underlying broad components, we fit the line profiles with two Gaussian functions (the two dot-dashed lines in Figure 8) and list the results in Table 3. In the Appendix, we describe our fitting procedures in detail. We adopt a two-component fit for simplicity and for comparison with previous studies (although we cannot rule out the possibility that the velocity wings consist of multiple small narrow components). The line center of the broad component () agree with that of the narrow component in CDFS-LAB14, is blueshifted in CDFS-LAB07, and in CDFS-LAB13, and is marginally redshifted in CDFS-LAB06. The widths of the broad components, corrected for the instrumental resolution, are relatively small: = 45 – 120 km s-1 (FWHM = 100 – 280 km s-1 ), which would not be detected with lower resolution or lower S/N spectra.
To quantify the contribution of the broad components, we measure the “broad-to-narrow ratio” (), which is defined as the ratio of the flux in the broad [O III] emission line to the flux in the narrow component. Because the fluxes in the two Gaussian components are anti-correlated with each other, this ratio has large uncertainties. We also list the “broad flux fraction” (), which is the ratio of the flux in broad emission to the total [O III] flux (/). The broad emission component is significant with = 0.4 – 0.8 constituting 30%–45% of the total [O III] line flux (although the uncertainties are fairly large). The measurements of the underlying components are highly dependent on the S/N of spectra. Due to the low S/N in the -band, we are not able to reliably measure the broad line components from permitted lines such as H or H, but similar broad wings are also present in the H profiles of at least two galaxies (CDFS-LAB07 and 14; see Figure 3).
What is the mechanism responsible for the broad component in the [O III] profiles? A broad component with a larger line-width () of a few hundred km s-1 is generally interpreted as a signature of starburst-driven galactic winds, and often observed in local dwarf starbursts (e.g., Westmoquette et al., 2007) and in local ultraluminous infrared galaxies (ULIRGs) (e.g., Soto et al., 2012). While broad components in forbidden lines such as [O III] are not related to the broad line region (BLR) of Type 1 AGN, they might still arise from the shocked narrow line region (NLR) in AGN. However, the composite spectrum of all of our X-shooter sample has a line ratio ([N II]/H) , excluding any significant contribution from AGN (Y. Yang et al. in preparation). Furthermore, in CDFS-LAB11, whose He II and C IV emission lines hint at the presence of an AGN, no broad component is detected.
At high redshift (), broadened emission lines were first reported by Shapiro et al. (2009). They found that the stacked spectrum of star-forming galaxies (SFGs) shows broad (FWHM 550 km s-1 ) emission underneath the H+[N II] line complex. More recently, stacked spectra of higher S/N data have revealed that the broad emission is spatially extended over a half-light radius (Newman et al., 2012b). Broad emission lines are now detected from individual SFGs and even from giant star-forming clumps within them (Genzel et al., 2011). Genzel et al. (2011) show that SFGs show broad wings of H emission with FWHM 300 – 1000 km s-1 ( 125 – 425) and employ the maximum blueshifted velocity, = as a proxy of the outflow speed, finding that SFGs have = 380 – 1000 km s-1 . Thus, the broad component in these galaxies is attributed to powerful galactic outflows. For compact Ly emitters, although there are increasing number of detections of [O III] and H (e.g., McLinden et al., 2011; Finkelstein et al., 2011; Nakajima et al., 2012; Hashimoto et al., 2013), broad emission in [O III] has not been reported so far, perhaps due to the lower spectral resolution or lower S/N of these studies. Therefore, at the moment, it is not clear whether the broad component and sometime line asymmetry that we observe in Ly blobs is a general property of Ly-selected galaxies.
As in local ULIRGs and in high redshift SFGs, the detection of a broad component in the [O III] profile here suggests warm ionized outflows from the galaxies within Ly blobs, presumably driven by supernovae and stellar winds. However, while the flux fraction of our broad emission is comparable to those of SFGs, the broad [O III] wings are narrower ( = 45 – 120 km s-1 ) and the inferred velocities much smaller = 150 – 260 km s-1 . Therefore, at face value, the warm ionized outflows from the Ly blob galaxies are not as strong as those in SFGs at similar redshift. Furthermore, these estimates for outflow velocity are roughly consistent with the values obtained from our two other kinematic measures, and (§3.5.1 and §3.5.2), independently discounting shock-heating via super/hyperwinds as a viable powering mechanism.
3.6. Constraint on H I Column Density
Constraining the physical state of the Ly-emitting gas in a Ly blob is a critical step to understand its emission mechanism and to directly compare the observations with the numerical simulations (e.g., Faucher-Giguère et al., 2010; Rosdahl & Blaizot, 2012; Cen & Zheng, 2013; Latif et al., 2011), which predict the Ly emissivity maps from the gas density, temperature, and UV radiation fields. In this section, as a first step, we estimate the H I column density of a Ly blob, CDFS-LAB14.
The and analyses of CDFS-LAB14 are consistent with a simple RT model in which the surrounding gas is static or without bulk motions. The third kinematic indicator, the [O III] profile, which suggests a mild outflow, either contradicts the other indicators or is sensitive to gas in a different state (e.g., warm, ionized instead of cold, neutral) or distribution (e.g., around galaxy instead of in galaxy). Here we use the Ly emission and ISM absorption line profiles to place a constraint on the amount of neutral hydrogen in this Ly blob. Ultimately, by comparing the Ly profile with detailed RT models, one could extract a wealth of information, including outflow speed, optical depth, and column density (e.g., Verhamme et al., 2008). We defer such detailed analysis to the future papers and consider the most simplistic case in this section.
Ly line transfer in an extremely thick medium of neutral gas has been studied over many decades, and the analytic solutions for simple geometries (like a static homogeneous slab or uniform sphere) are known (Harrington, 1973; Neufeld, 1990; Dijkstra et al., 2006a). We consider a simple geometry in which a Ly source is located at the center of a static homogeneous slab with optical depth of from the center to the edge. Because Ly photons generated at the center escape the system through random scattering in the frequency space, the emergent line spectrum is double-peaked profile with its maxima at , where represents the line frequency in units of Doppler width . and are the Voigt parameter and Ly optical depth at the line center, respectively (Dijkstra et al., 2006a)111 Note that this coefficient is slightly different from the traditional Neufeld solution (1.066).. In terms of velocity, the separation between blue and red peaks with same the intensity is
| (1) |
where and represent the Doppler parameter () and the column density of neutral hydrogen, respectively. If we adopt a uniform sphere geometry instead of a slab, the coefficient of the above equation will decrease to 336 km s-1 , and the product ( ) will increase by a factor of two for a fixed value. Note that the blue-to-red peak separation is degenerate between two parameters, and .
From the Ly profile of CDFS-LAB14 (Figure 3 and 4), we measure the separation between the blue and red peaks, = 790 39 km s-1 . In the analytic solution, the peaks on the blue and red sides of the systemic velocity are each symmetric, whereas for CDFS-LAB14 they are slightly asymmetric. As a result, the RT in this system may require ultimately a more complicated model than the assumed simple geometry.
To constrain , we consider two extreme cases for the Doppler parameter : First, as a lower limit, 12.85 km s-1 , obtained by assuming a temperature = 104 K and ignoring the turbulence term. Second, , the width of the metal absorption lines. In other words, we assume that the observed velocity width of absorbing material is purely due to the turbulence or random motions inside the slab. The width of the absorption line is = 152 35 km s-1 from a single Gaussian fit (§3.5.2 and Figure 7) and after being corrected for the instrumental line width. For this range of , we obtain 19.7 20.8.
Because the Ly emission is spatially resolved in CDFS-LAB14, we further apply this technique to the extended Ly-emitting gas in a direction other than toward the embedded galaxy. As shown in Figure 4, the Ly profile remains double-peaked as we move away from the sight-line directly toward the embedded galaxy. The separation between the blue and red peaks decreases, indicating that also decreases. For 650 km s-1 , we obtain slightly smaller estimates for the column density: 19.5 20.6.
Using the accurate measurement of systemic velocity, the metal absorption lines, and the symmetric double-peaked Ly profile, we are able to place constraints on the toward the galaxy and the extended Ly-emitting gas, albeit with large uncertainties. It is intriguing that this rough estimate of the H I column density is similar to those of damped Ly absorption systems (DLA; 2 cm-2). While we have identified this Ly blob by searching for extended Ly emission, it would be interpreted as a DLA if there were a background QSO whose continuum spectrum showed absorption at the blob redshift. There are similar systems where extended Ly emission is identified from DLAs very close to the QSO redshift (e.g., Møller et al., 1998; Fynbo et al., 1999; Hennawi et al., 2009).
3.7. Blueshifted Ly without Broadband Counterpart
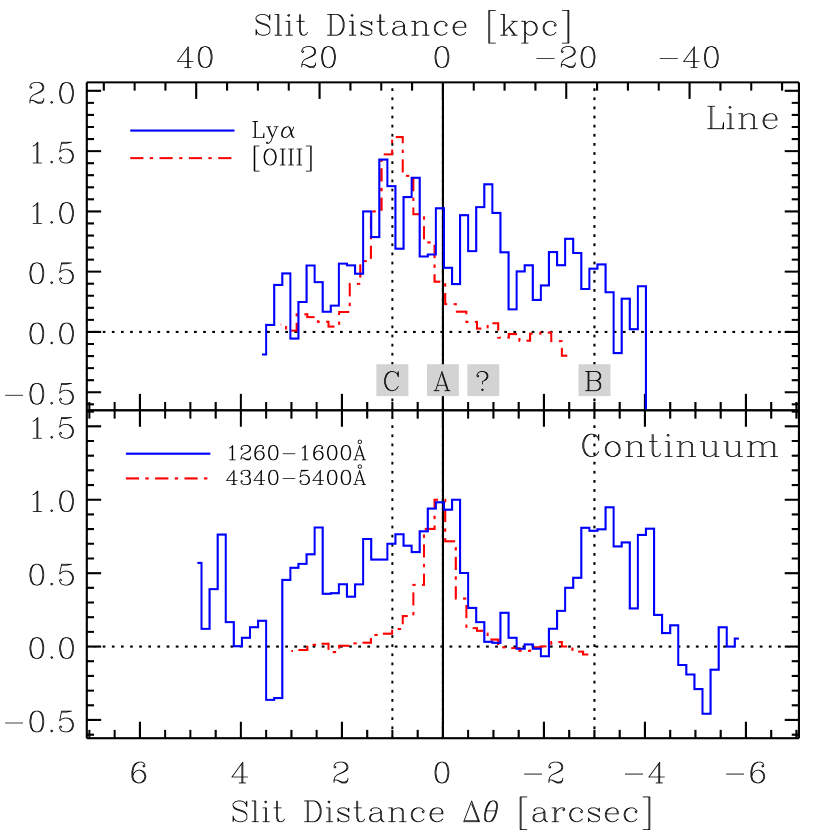
Up to this point, we have examined only Ly emission along the line-of-sight to galaxies embedded in our blobs. In the 2–D spectrum of CDFS-LAB10, however, we identify a region of blueshifted Ly emission that does not spatially coincide with any of the blob galaxies identified with HST. This is the first case in our sample where we detect the Ly emission from the extended gas itself. Given that a blueshifted Ly line is a long-sought signature of gas inflows as described in §1 and Figure 1, we present a detailed analysis of CDFS-LAB10 here.
In Figure 9 (bottom), we show the HST F606W image of CDFS-LAB10 now rotated and smoothed with a Gaussian kernel to increase the contrast of faint sources. There are three broadband sources labeled CDFS-LAB10A, B, and C within the Ly contour, which is elongated over 10″ (82 kpc). Figure 9(top) shows the spatial profiles of the stellar continuum and the emission lines (Ly and [O III]). The latter are the same as in Figure 4. To obtain the spatial profiles for the continuum, we collapse the 2–D spectra for the rest-frame wavelength range, [1260Å, 1600Å] and [4340Å, 5400Å], i.e., redward of Ly and both sides of the [O III] lines, respectively. Because of different data reduction modes, the spatial profiles from the NIR arms ([O III]) cover only the central 6″, while the profiles from the UVB arm (Ly) cover 14″.
The brightest UV source in the HST image, CDFS-LAB10A at the slit center ( = 0″), is detected in both the rest-frame UV and optical continua, but not in Ly or any strong emission lines ([O II], [O III], H, H). It is still possible that there is a faint [O III] 5007 line under a sky line at km s-1 (see Figure 4). Therefore, it is not clear whether galaxy A is at the same redshift as the Ly-emitting gas or is a fore- or background galaxy. The galaxy B at 3″ is detected in Ly, [O III], and UV continuum and is thus a member of the CDFS-LAB10 blob. Galaxy B’s Ly emission is slightly offset from its UV continuum. CDFS-LAB10C, which has a filamentary or elongated morphology in the HST image, is the faintest ( = ) of the three sources, but the brightest in Ly and [O III]. Thus, galaxy C is the dominant source of Ly emission from the known galaxies in this Ly blob. It appears to be a classic example of an object heavily extincted in the UV whose Ly photons can still escape. Its 2–D [O III] spectrum shows a velocity shear, suggesting a disk.
There is no obvious counterpart of the Ly emission at = ″ and 500 km s-1 in either the HST image or in the X-shooter continuum spectrum. Therefore, this isolated Ly emission probably arises from the extended gas. Its line profile is broad, double-peaked, and blueshifted from galaxy B and galaxy C (Figure 4). It is not possible to distinguish whether the bulk motion is inflowing or outflowing (at 500 km s-1 ) with respect to galaxy C, the brightest [O III] source and marker of systemic velocity (Figure 4), because we do not know whether the gas lies in front of or behind galaxy C. This is the first unambiguous detection of a blueshifted Ly line with respect to galaxies embedded within Ly blobs. It is likely that the blueshift is relative to the systemic velocity of the Ly blob as well.
It is not clear what this blueshifted Ly emission represents. We consider three possibilities. First, although unlikely, this Ly component could be associated with a heavily-extincted galaxy that lies below the detection limit of the HST image ( 28 mag) or with galaxy A, whose redshift is unknown. Second, this gas might be tidally-stripped material arising from a galaxy-galaxy interaction: the two galaxies (B and C) are separated by 30 kpc in projected distance and 200 km s-1 in velocity space. Lastly, but most interestingly, this blueshifted Ly emission could be the long-sought, but elusive cold gas accretion along filamentary streams (Kereš et al., 2005, 2009; Dekel et al., 2009).
Note that similarly blueshifted Ly emission has been reported in a faint Ly emitter at = 3.344, which was discovered in an extremely deep, blind spectroscopic search (Rauch et al., 2011). The spectrum of this peculiar system also has very complex structure (e.g., diffuse fan-like blueshifted Ly emission and a DLA system). Rauch et al. (2011) suggest that this blueshifted Ly emission can be explained if the gas is inflowing along a filament behind the galaxy and emits fluorescent Ly photons induced by the ionizing flux escaping from the galaxy. Discriminating among the above possibilities will require us to further constrain the Ly line profile of this blueshifted component and to more fully survey possible member galaxies (or energy sources) within CDFS-LAB10.
Still, we were able to successfully link the Ly and [O III] sources with the embedded galaxies in this complex system and to find blueshifted Ly emission that might point to gas inflow. This example raises concerns about how to identify the sources of Ly emission and to interpret the gas morphologies and kinematics solely from Ly lines. Elongated or filamentary Ly morphologies may be a sign of bipolar outflows (Matsuda et al., 2004) or related to filamentary cold streams. In CDFS-LAB10, the Ly spectrum shows two kinematically distinct components around the brightest galaxy A: the upper ( 0″) and lower parts are blue- and redshifted, respectively. In the absence of [O III] spectroscopy, the Ly data appear to be consistent with either of the above outflow or infalling stream scenarios. However, our detailed analysis including the [O III] line clearly shows that one of the Ly components arises from the faint galaxy C, which would be difficult to detect without HST imaging and is likely the dominant source of Ly emission. Therefore, we stress that interpreting the Ly morphology and spectra requires deep high-resolution imaging and the determination of the systemic velocity through NIR spectroscopy.
4. Discussion
4.1. Covering Factor of Inflows and Outflows
Under the assumption that inflowing gas streams (if any) are randomly distributed, and from the non-detection of any blueshifted Ly–H or Ly–[O III] offset in the direction of the eight embedded galaxies tested here (although see Section 3.7), we constrain the covering fraction of inflows to be 1/8 (13%). Likewise, if all of our offsets are different projections of the same collimated outflow from the galaxies and are a proxy for outflow speed, the covering fraction of strong outflows, i.e., super/hyper-winds, is less than 13%.
The covering fraction of gas flows to which we are referring here has a different meaning than often discussed in the literature (e.g., Faucher-Giguère & Kereš, 2011; Kimm et al., 2011; Fumagalli et al., 2011). In these theoretical papers, the covering factor is defined as how many sight-lines will be detected in metal or H I absorption when bright background sources close to the galaxies are targeted. What we measure in this paper is how often the inflowing gas is aligned with observer’s sight-lines so that the column of neutral gas becomes optically thick and blue-shifts Ly lines against systemic velocity. Nonetheless, Faucher-Giguère & Kereš (2011) predict that the covering factor within the virial radius ( 75 kpc) from their simulated galaxies with a halo mass of = 3 at is relatively small: 3% and 10% for DLAs and Lyman limit systems (LLS), respectively. Within 0.5, this factor increases to 10% and 30%, respectively, and presumably will be much higher directly towards the galaxies (i.e., for a pencil beam or looking down-the-barrel). Note that Faucher-Giguère & Kereš (2011) ignore galactic winds in order to isolate the inflowing streams, so we expect that there will be enough dense material arising from gas accretion to affect the transfer of Ly photons in our experiments.
What is uncertain is that how the velocity field of this dense material near the galaxy will shift the emerging Ly profiles and the statistics of , because answering this requires full Ly radiative transfer treatment. Unlike RT models with simple geometry (e.g., Dijkstra et al., 2006a; Verhamme et al., 2006), cosmological simulations (Faucher-Giguère et al., 2010) predict that the gas inflow can only slightly enhance the blue Ly peak, implying that the overall profile will be still red-peak dominated if the effects of outflows from the galaxies and IGM absorption are fully considered. Therefore, according to these simulations, our non-detection of infall signatures does not contradict the cold stream model. The Ly profiles calculated from cold-stream models are in general the integrated profiles of Ly-emitting gas around the galaxies, which are not detectable by our study. What we need are the predictions for how Ly profiles are modified and/or shifted against optically-thin lines along the line-of-sight to the galaxies embedded in the extended gas. In this way, the distribution of predicted can be compared directly with the observations.
It is also critical to take into account the effect of simultaneous outflows and inflows. For example, the H and [O III] detections suggest that the galaxies embedded in the blobs are forming stars, which could generate mechanical feedback into the surrounding gas cloud. Thus, one might have expected that the innermost part of the gas cloud, close to the galaxies, has galactic scale outflows similar to those of other star-forming galaxies at (e.g., Steidel et al., 2010). Gas infall (if any) may dominate at larger radii (up to 50 kpc, the typical blob size). In this case, the emerging Ly profile will be more sensitive to the core of the Ly blob, presumably the densest part of the CGM, than to the gas infall. As a result, it might be difficult to detect the infalling gas by measuring . This kind of more realistic, infall+outflow model has not been considered yet in RT calculations, so its spectral signatures are unknown.
4.2. Outflow Speed vs.
In our sample of eight Ly blobs, the embedded galaxies have smaller velocity offsets ( = 160 km s-1 ) than those of LBGs (445 km s-1 ). The remaining question is how to interpret these small values. We consider two possibilities here.
First, if we assume a simple geometry where the outflowing material forms a spherical shell that consists of continuous media, originates from the resonant scattering of the Ly photons at the shell as discussed in Verhamme et al. (2008). Note that the emerging Ly profile is independent of the physical size of the shell as long as the shell have the same outflow velocity. Therefore, this model is applicable to Ly blobs. In this shell model, a central monochromatic point source is surrounded by an expanding shell of neutral gas with varying column density () and Doppler parameter (e.g., Verhamme et al., 2006, 2008). A generic prediction is that the Ly emission is asymmetric, with the details of the line shape depending on the shell velocity, Doppler parameter , and optical depth of H I column in the shell. In this simple geometry, the values can be used as a proxy for outflow velocity of expanding shell, i.e., 0.5 . If this is the case, outflow velocities from blob galaxies are much smaller than the values expected from models of strong galactic winds ( 1000 km s-1 ; Taniguchi & Shioya, 2000; Taniguchi et al., 2001; Ohyama et al., 2003; Wilman et al., 2005). Furthermore, these offsets are even smaller than the typical Ly–H offsets (250–900 km s-1 ) of LBGs (Steidel et al., 2004, 2010). In particular, while CDFS-LAB14 has the largest for its red peak, its blue and red peaks have similar intensity, which is a characteristic of a static medium or no bulk motions (Verhamme et al., 2006; Kollmeier et al., 2010).
Second, in an “expanding bullet” or “clumpy CGM” model (Steidel et al., 2010), the outflowing material, which consists of small individual clumps, has a wide velocity range rather than a single value, and the Ly profiles are determined by the Doppler shift that photons acquire when they are last scattered by the clumps just before escaping the system. In this case, the Ly–H offsets are primarily modulated by the amount of gas that has component (though it is not clear where this material is spatially located); thus is not directly correlated with outflow velocity. If this is the case, the small value of the galaxies in our Ly blobs simply indicates that there is less neutral gas at the galaxies’ systemic velocity (presumably near the galaxy) compared to LBGs.
Testing these two hypotheses for Ly blobs or LBGs first requires a detailed comparison between high resolution Ly profiles and RT predictions. This test is beyond the scope of this paper and will be discussed in the future. As emphasized by Steidel et al. (2010), one also needs to check the consistency of the Ly profiles with ISM metal absorption profiles, which depends on high S/N continuum spectra that are not available here. Nonetheless, we attempted such an analysis by stacking many low-ionization absorption lines in three galaxies (section 3.5.2).
For those three embedded galaxies with measured and , the outflow velocity estimates from both methods roughly agree within the uncertainties arising from low S/N and from RT complications. However, closer inspection reveals a discrepancy between the observations and the simplest RT models in that we obtain 200 km s-1 and also 200 km s-1 while the RT model with an expanding shell geometry predicts = = . This discrepancy has also appeared in LBGs (Steidel et al., 2010), and Kulas et al. (2012) show that the stacked Ly profile of LBGs with double-peaked profiles cannot be reproduced accurately by the shell model. For a wide range of parameters ( , , ), Kulas et al. (2012) cannot reproduce the location of the red peak, the width of the Ly profile, and the metal absorption profile at the same time.
We attribute this discrepancy to the very simple nature of the shell model. By construction or by definition of the expanding “shell”, the internal velocity dispersion of the media that constitute the shell should be much smaller than the expansion velocity of the shell itself, i.e., / 1. Therefore, one expects that the metal absorption lines arising from this thin shell have very narrow line widths similar to , typically tens of km s-1 . However, such narrow absorption lines are not observed in either LBGs or Ly blobs. Clearly, RT calculations with more realistic geometries and allowing a more thorough comparison with the observed Ly profiles are required.
4.3. in Context of LAEs and LBGs
Given that the galaxies within our Ly blobs were selected, by definition, as Ly emitters with high equivalent width (EW), the comparison with LAEs suggests that small values are a general characteristic of all high EW Ly-selected populations, be they compact or extended. In addition to this work and Yang et al. (2011), there are recent studies that measure for bright compact Ly-emitters (McLinden et al., 2011; Finkelstein et al., 2011; Hashimoto et al., 2013; Guaita et al., 2013) and Ly blobs (McLinden et al., 2013), which also find small Ly–[O III] offsets for LAEs ranging from 35 – 340 km s-1 . A Kolmogorov–Smirnov test fails to distinguish the distribution of our eight Ly blobs from that of ten compact LAEs compiled from the four studies mentioned above. Thus, we now have a fairly large sample of high–EW Ly emitters (compact or extended) with = 60 +400 km s-1 , which is clearly different from the distribution for LBGs (see Section 3.5.1).
The smaller of LAEs and LABs might be related to their higher Ly equivalent widths. An anti-correlation between EW(Ly) and in a compilation of LAE and LBG samples has been suggested (Hashimoto et al., 2013). Even within the LBG population itself there is an indication that decreases as EW(Ly) increases. Shapley et al. (2003) find an anti-correlation between the EW(Ly) and the velocity offsets between interstellar absorption and Ly emission lines, .222The notation, is used in Shapley et al. (2003). From the stacked spectra of LBGs binned at different EW(Ly), they show that with increasing Ly line strength from 15Å to 53Å, decreases from 800 km s-1 to 480 km s-1 . Because = + , we can infer that is likely to decrease as EW(Ly) increases unless the observed anti-correlation is entirely due to .
The origin of the apparent relationship between larger EW(Ly) and smaller is not understood. It is possible that other physical properties drive this anti-correlation: for example, LBGs tend to have brighter continuum magnitudes, thus likely higher star formation rates and stellar masses, than are of typical LAEs. Hashimoto et al. (2013) propose that low H I column density, and thus a small number of resonant scatterings of Ly photons, might be responsible for the strong Ly emission and small of Ly emitters.
What we do know from our measurements is that LAEs and Ly blobs are kinematically similar. Therefore, the mystery remains as to what powers Ly nebulae, or, in other words, why certain galaxies have more spatially-extended Ly gas (i.e., blobs) than others (i.e., compact LAEs) with similar and EW(Ly). While the answer may be related to photo-ionization from (buried) AGN (e.g., see Section 4.4 or Yang et al. 2014), an extended proto-intracluster medium that can scatter or transport the Ly photons out to larger distances, or less dust to destroy Ly photons (cf. Hayes et al., 2013), discriminating among these possibilities will require a multi-wavelength analysis of a large sample of Ly blobs. For now, the similarity here of LABs and LAEs suggests that differences in gas kinematics are not responsible for the extended Ly halos.
4.4. CDFS-LAB11: Photo-ionization by AGN?
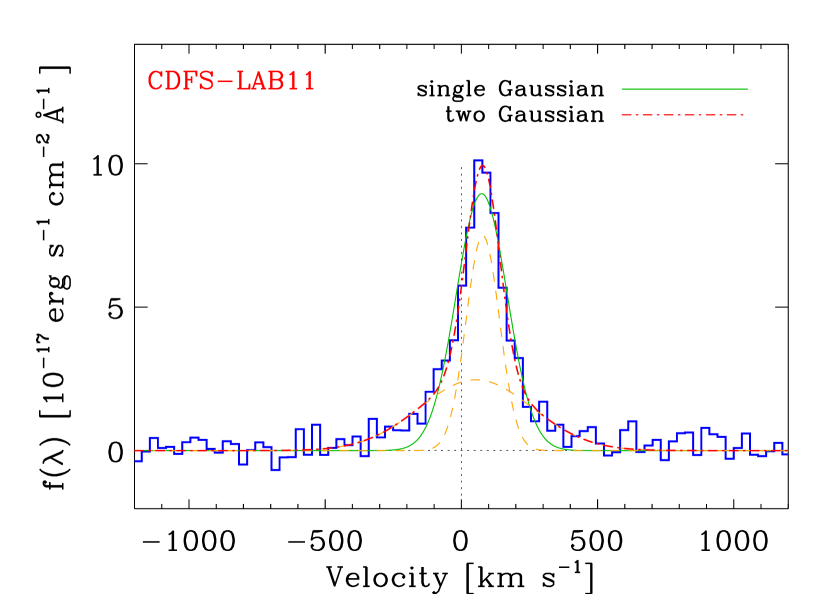
From the nearly symmetric Ly profile (Fig. 10), C IV and He II detection, and rest-frame optical line ratios, we hypothesize that an AGN in CDFS-LAB11 ionizes the gas surrounding the galaxies, making Ly relatively optically thin and preventing the resonant scattering of Ly photons from dominating the shape of the profile. While fitting the profile requires an underlying broad component (FWHM 480 km s-1 ), the narrow component (redshifted by 80 km s-1 ) has a small velocity width (FWHM 110 km s-1 ), comparable to that of the [O III] line (80 km s-1 ). Therefore, if we assume that Ly and [O III] photons originate from the same region, resonant scattering by the IGM/CGM does not broaden the intrinsic profile significantly. In other words, at least along our LOS, the optical depth of CDFS-LAB11’s IGM/CGM is smaller than for the other Ly blobs in our sample and for typical Ly emitters at high redshifts.
A nearly symmetric and narrow Ly profile such as CDFS-LAB11’s is rarely observed among high- Ly-emitting galaxies. However, Ly radiative transfer calculations show that such Ly profiles can be generated in the presence of a central ionizing source. For example, Dijkstra et al. (2006a) investigate the emerging Ly profiles from an collapsing/expanding sphere centered on an ionizing source (an AGN) for different luminosities (see their Figures 11 and 12). They find that if the ionizing source is strong and the Ly is relatively optically thin (line-center optical depth ), the separation of the characteristic double-peaks become smaller ( 100 km s-1 ) as the ionizing source gets stronger. The overall profile becomes symmetric, and is blue or redshifted depending on the flow direction, but again by small amount ( 100 km s-1 ). These authors were skeptical that the sign of the Ly shift and the small Ly offset ( a few tens km s-1 ) from the systemic velocity could be measured. However, with the right strategy (i.e., high spectral resolution and a careful choice of survey redshift), we are able to reliably measure the predicted small offset. Clearly, more detailed comparisons with the RT models are required.
A broad, asymmetric Ly profile with a sharp blue edge (e.g., CDFS-LAB06 and 07) is characteristic of high- Ly-emitters. In spectroscopic follow-up observations of Ly-emitter candidates, where spectral coverage is limited, these characteristics alone are often used to discriminate high- Ly emitters from possible low- interlopers. The example of CDFS-LAB11 demonstrates that caution is required because a narrow and symmetric Ly line can also arise when the ISM or CGM of a candidate galaxy is significantly photo-ionized, e.g., by AGN. On the bright side, our velocity offset technique could be used for studying gas infall or outflow in high- QSOs instead of relying on only the Ly line profile (e.g., Weidinger et al., 2004).
5. Conclusions
Exploring the origin of Ly nebulae (“blobs”) at high redshift requires measurements of their gas kinematics that are difficult with only the resonant, optically-thick Ly line. To define gas motions relative to the systemic velocity of the nebula, the Ly line must be compared with non-resonant lines, which are not much altered by radiative transfer effects. We made first comparison of non-resonant H 6563 to extended Ly emission for two bright Ly blobs in Yang et al. (2011), concluding that, within the context of a simple radiative transfer model, the gas was static or mildly outflowing at 250 km s-1 . However, it was unclear if these two Ly blobs, which are the brightest in the sample, are representative of the general Ly blob population. Furthermore, geometric effects — infall along filaments or bi-polar outflows — might hide bulk motions of the gas when only viewed from the two directions toward these two Ly blobs. With VLT X-shooter, we obtain optical and near-infrared spectra of six additional Ly blobs from the Yang et al. (2010) sample. With a total of eight Ly blobs, we investigate the gas kinematics within Ly blobs using three techniques: the Ly offset from the systemic velocity ( ), the shape and shift ( ) of the ISM metal absorption line profiles, and the breadth of the [O III] line profile.
Our findings are:
-
1.
Both Ly and non-resonant lines confirm that these blobs lie at the survey redshift (). We also detect the [O II] 3727,3729, [O III] 4959, [O III] 5007, and H 4861 lines. All non-resonant line velocities are consistent with each other and with arising from the galaxy or galaxies embedded in the Ly blob. [O III], which is observed at high signal-to-noise in all cases and whose profile is an RT-independent constraint on the gas kinematics, is a particularly good diagnostic line for this redshift and instrument.
-
2.
The majority of the blobs (6/8) have broadened Ly profiles indicating radiative transfer effects. These Ly profiles are consistent with being in the same family of objects as predicted by RT, with profile shapes ranging from symmetric double-peaked, to asymmetric red peak dominated, to a single red peak. The fraction of double-peaked profiles is 38% (3/8).
-
3.
The narrow Ly profile systems (CDFS-LAB01A, CDFS-LAB11), whose Ly profile is not significantly broader than the [O III] or H lines, have the smallest offsets, the most spatially compact Ly emission, and the only C IV and He II lines detected, implying that a hard ionizing source, possibly an AGN, is responsible for the lower optical depth toward the central embedded galaxies.
-
4.
With a combination of , the interstellar metal absorption line profile, and a new indicator, the spectrally-resolved [O III] line profile, we detect gas moving along the line of sight to galaxies embedded in the Ly blob center. Although not all three indicators are available for all Ly blobs, the implied speeds and direction are roughly consistent for the sample, suggesting a simple picture in which the gas is stationary or slowly outflowing at a few hundred km s-1 from the embedded galaxies. These outflow speeds are similar to those of LAEs, suggesting that outflow speed is not the dominant driver of extended Ly emission. Furthermore, these outflow speeds exclude models in which star formation or AGN produce “super” or “hyper” winds of up to 1000 km s-1 (Taniguchi & Shioya, 2000).
More specifically:
-
We compare the non-resonant emission lines [O III] and H to the Ly profile to obtain the velocity offset . The galaxies embedded within our Ly blobs have smaller than those of LBGs, confirming the previous claims (Yang et al., 2011). The galaxies within Ly blobs have = 60 +400 km s-1 with an average of = 160 km s-1 , while LBGs at similar redshifts have = 250 – 900 km s-1 . The small in the Ly blobs are consistent with those measured for compact LAEs.
-
By stacking low-ionization metal absorption lines, we measure the outflow velocity of neutral gas in front of the galaxies in the Ly blobs. Galaxies in two Ly blobs show an outflow speed of 250 km s-1 , while another has an almost symmetric absorption line profile centered at = 0 km s-1 , consistent with no significant bulk motion. The ISM absorption line profiles here have low S/N, but are very roughly consistent with those of some LBGs (at the level of several hundred km s-1 outflows).
-
The high spectral resolution of our data reveals broad wings in the [O III] profiles of four Ly blobs. This new kinematic diagnostic suggests warm ionized outflows driven by supernovae and stellar winds. These broad line components are narrower ( = 45 – 120 km s-1 ) and have a maximum blueshifted velocity ( = 150 – 260 km s-1 ) smaller than those of star-forming galaxies (SFGs), implying weaker outflows here than for LBGs and SFGs at similar redshifts.
-
If we assume that the detected outflows are different projections of the same outflow from the Ly blob center, we can estimate the effects of flow geometry on our measurements given that our large sample size allows averaging over many lines-of-sight. The absence of any strong (1000 km s-1 ) outflows among the eight galaxies tested is not a projection effect: their covering fraction is 1/8 (13%). Likewise, the lack of a blue-peak dominated Ly profile, at least in the direction of the embedded galaxies (see point 6. below), implies that the covering factor of any cold streams (Kereš et al., 2005, 2009; Dekel et al., 2009) is less than 13%. The channeling of gravitational cooling radiation into Ly may not be significant over the radii probed by our techniques here.
-
-
5.
Constraining the physical state of Ly-emitting gas in a Ly blob is a critical step in understanding its emission mechanism and in comparing to simulations. For one Ly blob whose Ly profile and ISM metal absorption lines suggest no significant bulk motion (CDFS-LAB14), at least in its cool and neutral gas, we assume a simple RT model and make the first column density measurement of gas in a embedded galaxy, finding that it is consistent with a DLA.
-
6.
For one peculiar system (CDFS-LAB10), we discover blueshifted Ly emission that is not directly associated with any embedded galaxy. This Ly emitting gas is blueshifted relative to two embedded galaxies, suggesting that it arose from a tidal interaction between the galaxies or is actually flowing into the blob center. The former is expected in these overdense regions, where HST images resolve many galaxies. The latter might signify the predicted but elusive cold gas accretion along filaments.
References
- Bland & Tully (1988) Bland, J., & Tully, B. 1988, Nature, 334, 43
- Cen & Zheng (2013) Cen, R., & Zheng, Z. 2013, ApJ, 775, 112
- Colbert et al. (2006) Colbert, J. W., Teplitz, H., Francis, P., Palunas, P., Williger, G. M., & Woodgate, B. 2006, ApJ, 637, L89
- Damen et al. (2011) Damen, M., Labbé, I., van Dokkum, P. G., et al. 2011, ApJ, 727, 1
- Dekel et al. (2009) Dekel, A., et al. 2009, Nature, 457, 451
- Dey et al. (2005) Dey, A., et al. 2005, ApJ, 629, 654
- Dijkstra et al. (2006a) Dijkstra, M., Haiman, Z., & Spaans, M. 2006, ApJ, 649, 14
- Dijkstra et al. (2006b) Dijkstra, M., Haiman, Z., & Spaans, M. 2006, ApJ, 649, 37
- Dijkstra & Loeb (2009) Dijkstra, M., & Loeb, A. 2009, MNRAS, 400, 1109
- Erb et al. (2011) Erb, D. K., Bogosavljević, M., & Steidel, C. C. 2011, ApJ, 740, L31
- Fardal et al. (2001) Fardal, M. A., Katz, N., Gardner, J. P., Hernquist, L., Weinberg, D. H., & Davé, R. 2001, ApJ, 562, 605
- Faucher-Giguère et al. (2010) Faucher-Giguère, C.-A., Kereš, D., Dijkstra, M., Hernquist, L., & Zaldarriaga, M. 2010, ApJ, 725, 633
- Faucher-Giguère & Kereš (2011) Faucher-Giguère, C.-A., & Kereš, D. 2011, MNRAS, 412, L118
- Finkelstein et al. (2011) Finkelstein, S. L., Hill, G. J., Gebhardt, K., et al. 2011, ApJ, 729, 140
- Foreman-Mackey et al. (2013) Foreman-Mackey, D., Hogg, D. W., Lang, D., & Goodman, J. 2013, PASP, 125, 306
- Francis et al. (2001) Francis, P. J., et al. 2001, ApJ, 554, 1001
- Fumagalli et al. (2011) Fumagalli, M., Prochaska, J. X., Kasen, D., et al. 2011, MNRAS, 418, 1796
- Fynbo et al. (1999) Fynbo, J. U., Møller, P., & Warren, S. J. 1999, MNRAS, 305, 849
- Gawiser et al. (2006) Gawiser, E., et al. 2006, ApJS, 162, 1
- Geach et al. (2009) Geach, J. E., et al. 2009, ApJ, 700, 1
- Genzel et al. (2011) Genzel, R., Newman, S., Jones, T., et al. 2011, ApJ, 733, 101
- Goerdt et al. (2010) Goerdt, T., Dekel, A., Sternberg, A., Ceverino, D., Teyssier, R., & Primack, J. R. 2010, MNRAS, 933
- Guaita et al. (2013) Guaita, L., Francke, H., Gawiser, E., et al. 2013, A&A, 551, A93
- Haiman & Rees (2001) Haiman, Z., & Rees, M. J. 2001, ApJ, 556, 87
- Haiman, Spaans, & Quataert (2000) Haiman, Z., Spaans, M., & Quataert, E. 2000, ApJ, 537, L5
- Harrington (1973) Harrington, J. P. 1973, MNRAS, 162, 43
- Hashimoto et al. (2013) Hashimoto, T., Ouchi, M., Shimasaku, K., et al. 2013, ApJ, 765, 70
- Hayes et al. (2011) Hayes, M., Scarlata, C., & Siana, B. 2011, Nature, 476, 304
- Hayes et al. (2013) Hayes, M., Östlin, G., Schaerer, D., et al. 2013, ApJ, 765, L27
- Hennawi et al. (2009) Hennawi, J. F., Prochaska, J. X., Kollmeier, J., & Zheng, Z. 2009, ApJ, 693, L49
- Keel et al. (1999) Keel, W. C., Cohen, S. H., Windhorst, R. A., & Waddington, I. 1999, AJ, 118, 2547
- Kelson (2003) Kelson, D. D. 2003, PASP, 115, 688
- Kereš et al. (2005) Kereš, D., Katz, N., Weinberg, D. H., & Davé, R. 2005, MNRAS, 363, 2
- Kereš et al. (2009) Kereš, D., Katz, N., Fardal, M., Davé, R., & Weinberg, D. H. 2009, MNRAS, 395, 160
- Kimm et al. (2011) Kimm, T., Slyz, A., Devriendt, J., & Pichon, C. 2011, MNRAS, 413, L51
- Kollmeier et al. (2010) Kollmeier, J. A., Zheng, Z., Davé, R., Gould, A., Katz, N., Miralda-Escudé, J., & Weinberg, D. H. 2010, ApJ, 708, 1048
- Kulas et al. (2012) Kulas, K. R., Shapley, A. E., Kollmeier, J. A., et al. 2012, ApJ, 745, 33
- Latif et al. (2011) Latif, M. A., Schleicher, D. R. G., Spaans, M., & Zaroubi, S. 2011, MNRAS, 413, L33
- Lehmer et al. (2005) Lehmer, B. D., Brandt, W. N., Alexander, D. M., et al. 2005, ApJS, 161, 21
- Luo et al. (2008) Luo, B., Bauer, F. E., Brandt, W. N., et al. 2008, ApJS, 179, 19
- Martin et al. (2014) Martin, D. C., Chang, D., Matuszewski, M., et al. 2014, arXiv:1402.4809
- Matsuda et al. (2004) Matsuda, Y., et al. 2004, AJ, 128, 569
- Matsuda et al. (2006) Matsuda, Y., Yamada, T., Hayashino, T., Yamauchi, R., & Nakamura, Y. 2006, ApJ, 640, L123
- Matsuda et al. (2011) Matsuda, Y., Yamada, T., Hayashino, T., et al. 2011, MNRAS, 410, L13
- McLinden et al. (2011) McLinden, E. M., Finkelstein, S. L., Rhoads, J. E., et al. 2011, ApJ, 730, 136
- McLinden et al. (2013) McLinden, E. M., Malhotra, S., Rhoads, J. E., et al. 2013, ApJ, 767, 48
- Møller et al. (1998) Møller, P., Warren, S. J., & Fynbo, J. U. 1998, A&A, 330, 19
- Nakajima et al. (2012) Nakajima, K., Ouchi, M., Shimasaku, K., et al. 2012, ApJ, 745, 12
- Neufeld (1990) Neufeld, D. A. 1990, ApJ, 350, 216
- Newman et al. (2012b) Newman, S. F., Genzel, R., Förster-Schreiber, N. M., et al. 2012, ApJ, 761, 43
- Nilsson et al. (2006) Nilsson, K. K., Fynbo, J. P. U., Møller, P., Sommer-Larsen, J., & Ledoux, C. 2006, A&A, 452, L23
- Ohyama et al. (2003) Ohyama, Y., et al. 2003, ApJ, 591, L9
- Ouchi et al. (2009) Ouchi, M., et al. 2009, ApJ, 696, 1164
- Prescott et al. (2008) Prescott, M. K. M., Kashikawa, N., Dey, A., & Matsuda, Y. 2008, ApJ, 678, L77
- Prescott et al. (2009) Prescott, M. K. M., Dey, A., & Jannuzi, B. T. 2009, ApJ, 702, 554
- Prescott et al. (2012a) Prescott, M. K. M., Dey, A., & Jannuzi, B. T. 2012, ApJ, 748, 125
- Prescott et al. (2012b) Prescott, M. K. M., Dey, A., Brodwin, M., et al. 2012, ApJ, 752, 86
- Rauch et al. (2011) Rauch, M., Becker, G. D., Haehnelt, M. G., et al. 2011, MNRAS, 418, 1115
- Rix et al. (2004) Rix, H.-W., et al. 2004, ApJS, 152, 163
- Rosdahl & Blaizot (2012) Rosdahl, J., & Blaizot, J. 2012, MNRAS, 423, 344
- Saito et al. (2006) Saito, T., Shimasaku, K., Okamura, S., Ouchi, M., Akiyama, M., & Yoshida, M. 2006, ApJ, 648, 54
- Saito et al. (2008) Saito, T., Shimasaku, K., Okamura, S., Ouchi, M., Akiyama, M., Yoshida, M., & Ueda, Y. 2008, ApJ, 675, 1076
- Scarlata et al. (2009) Scarlata, C., et al. 2009, ApJ, 706, 1241
- Schaerer & Verhamme (2008) Schaerer, D., & Verhamme, A. 2008, A&A, 480, 369
- Shapiro et al. (2009) Shapiro, K. L., Genzel, R., Quataert, E., et al. 2009, ApJ, 701, 955
- Shapley et al. (2003) Shapley, A. E., Steidel, C. C., Pettini, M., & Adelberger, K. L. 2003, ApJ, 588, 65
- Smith & Jarvis (2007) Smith, D. J. B., & Jarvis, M. J. 2007, MNRAS, 378, L49
- Soto et al. (2012) Soto, K. T., Martin, C. L., Prescott, M. K. M., & Armus, L. 2012, ApJ, 757, 86
- Steidel et al. (2000) Steidel, C. C., Adelberger, K. L., Shapley, A. E., Pettini, M., Dickinson, M., & Giavalisco, M. 2000, ApJ, 532, 170
- Steidel et al. (2004) Steidel, C. C., Shapley, A. E., Pettini, M., Adelberger, K. L., Erb, D. K., Reddy, N. A., & Hunt, M. P. 2004, ApJ, 604, 534
- Steidel et al. (2010) Steidel, C. C., Erb, D. K., Shapley, A. E., et al. 2010, ApJ, 717, 289
- Taniguchi et al. (2001) Taniguchi, Y., Shioya, Y., & Kakazu, Y. 2001, ApJ, 562, L15
- Taniguchi & Shioya (2000) Taniguchi, Y. & Shioya, Y. 2000, ApJ, 532, L13
- Verhamme et al. (2006) Verhamme, A., Schaerer, D., & Maselli, A. 2006, A&A, 460, 397
- Verhamme et al. (2008) Verhamme, A., Schaerer, D., Atek, H., & Tapken, C. 2008, A&A, 491, 89
- Vernet et al. (2011) Vernet, J., Dekker, H., D’Odorico, S., et al. 2011, A&A, 536, A105
- Weidinger et al. (2004) Weidinger, M., Møller, P., & Fynbo, J. P. U. 2004, Nature, 430, 999
- Weijmans et al. (2010) Weijmans, A.-M., Bower, R. G., Geach, J. E., et al. 2010, MNRAS, 402, 2245
- Westmoquette et al. (2007) Westmoquette, M. S., Exter, K. M., Smith, L. J., & Gallagher, J. S. 2007, MNRAS, 381, 894
- Wilman et al. (2005) Wilman, R. J., Gerssen, J., Bower, R. G., Morris, S. L., Bacon, R., de Zeeuw, P. T., & Davies, R. L. 2005, Nature, 436, 227
- Yamada et al. (2012) Yamada, T., Matsuda, Y., Kousai, K., et al. 2012, ApJ, 751, 29
- Yang et al. (2009) Yang, Y., Zabludoff, A., Tremonti, C., Eisenstein, D., & Davé, R. 2009, ApJ, 693, 1579
- Yang et al. (2010) Yang, Y., Zabludoff, A., Eisenstein, D., & Davé, R. 2010, ApJ, 719, 1654
- Yang et al. (2011) Yang, Y., Zabludoff, A., Jahnke, K., et al. 2011, ApJ, 735, 87
- Yang et al. (2014) Yang, Y., Walter, F., Decarli, R., et al. 2014, ApJ, 784, 171
Appendix A Decomposition of [O III] profiles
To test if two velocity components are needed to fit our spectrally-resolved [O III] profiles and to extract the line parameters, we employ the [O III] profiles with two Gaussian functions using a Markov Chain Monte Carlo (MCMC) technique. We use the emcee software (Foreman-Mackey et al., 2013) to sample the distributions of six parameters: line center, width, and fluxes for the two Gaussian profiles. We require that (1) the line widths of both components are larger than the instrumental line width (31 km s-1 ; the vertical dotted lines in Figure 11), (2) the peak of each component should be at least 5% of the observed peak intensity, and (3) the peak of the narrow component is higher than that of the broad component. The latter two priors are imposed to prevent the MCMC chains from getting stuck in parameter spaces with extremely broad lines but with negligible fluxes.
In Figure 11, we show the likelihood distributions of the line widths of the two components: and . Note that we exclude CDFS-LAB10 in this analysis because its neighboring galaxy (CDFS-LAB10A) makes it difficult to reliably extract its profile (see Sections 3.5.3 and 3.7). Except for CDFS-LAB11, the likelihood distributions of the two line-widths do not overlap significantly, and the peaks of the joint 2–D distributions are not located near the = line (the dashed line). Therefore, we conclude that the remaining four systems (CDFS-LAB06, 07, 13, 14) are likely to consist of two components. The uncertainties of the parameters are determined from the 68.2% confidence interval of the marginalized distribution.
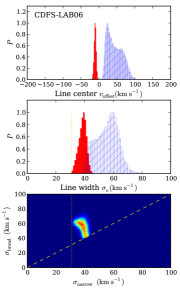
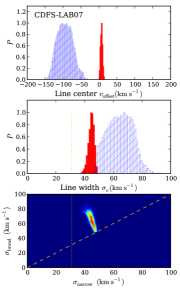
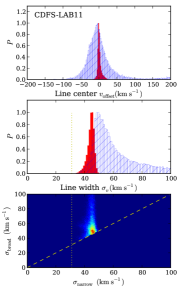
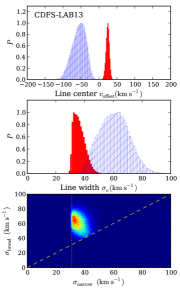
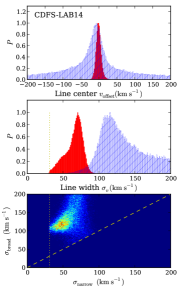
| Name | (Ly)aaLy Luminosity and EW within an isophot of 5.5 erg s-1 cm-2 arcsec-2. | EW(Ly)aaLy Luminosity and EW within an isophot of 5.5 erg s-1 cm-2 arcsec-2. | Coordinate | Date | Airmass | Seeing | (UVB) | (NIR) | |
|---|---|---|---|---|---|---|---|---|---|
| ( erg s-1) | (Å) | R.A. | decl. | (arcsec) | (hour) | (hour) | |||
| CDFS-LAB06 | 1.57 0.07 | 56 3 | 03:32:19.78 | -27:47:31.5 | 2011-01-07 | 1.07 | 0.80 | 0.76 | 0.80 |
| CDFS-LAB07 | 1.14 0.05 | 58 3 | 03:32:03.36 | -27:45:24.4 | 2011-01-06 | 1.05 | 0.77 | 0.76 | 0.80 |
| 2011-01-06 | 1.18 | 0.98 | 0.76 | 0.80 | |||||
| 2011-01-28 | 1.12 | 0.81 | 0.76 | 0.80 | |||||
| CDFS-LAB10 | 0.71 0.04 | 318 36 | 03:32:37.45 | -28:02:05.7 | 2010-11-06 | 1.00 | 0.71 | 0.76 | 0.80 |
| 2010-11-07 | 1.00 | 0.68 | 0.76 | 0.80 | |||||
| 2010-11-07 | 1.08 | 1.13 | 0.76 | 0.80 | |||||
| 2010-11-08 | 1.08 | 1.23 | 0.76 | 0.80 | |||||
| CDFS-LAB11 | 1.02 0.04 | 120 10 | 03:32:43.25 | -27:42:58.3 | 2011-01-08 | 1.07 | 0.75 | 0.76 | 0.80 |
| 2011-01-08 | 1.23 | 0.85 | 0.76 | 0.80 | |||||
| CDFS-LAB13 | 0.94 0.04 | 184 25 | 03:32:32.75 | -27:39:06.4 | 2011-01-07 | 1.22 | 0.79 | 0.76 | 0.80 |
| 2011-01-08 | 1.01 | 0.70 | 0.76 | 0.80 | |||||
| CDFS-LAB14 | 0.93 0.05 | 67 5 | 03:32:32.29 | -27:41:26.4 | 2011-01-09 | 1.07 | 0.80 | 0.76 | 0.80 |
| 2011-01-09 | 1.24 | 0.73 | 0.76 | 0.80 | |||||
| CDFS-LAB01 | 8.02 0.24 | 512 50 | |||||||
| CDFS-LAB02 | 2.88 0.12 | 43 2 | |||||||
Note. — Observations for CDFS-LAB01 and CDFS-LAB02 were presented in Yang et al. (2011).
| Red Peak | Blue Peak | |||||||
|---|---|---|---|---|---|---|---|---|
| Name | aaCorrected for the intrumental profile in the UVB ( 39 km s-1). | Flux | aaCorrected for the intrumental profile in the UVB ( 39 km s-1). | Flux | ProfilebbLine morphology: (1) single (red) peak, (2) double peaked profile with a stronger red peak, (3) double peaked profile with similar intensity peaks. | |||
| ( km s-1) | ( km s-1) | ( erg s-1 cm-2) | ( km s-1) | ( km s-1) | ( erg s-1 cm-2) | |||
| CDFS-LAB01 | 65 20 | 228 14 | 45.2 1.6 | (1) ccThe profiles of CDFS-LAB01 and 11 are not significantly broader than the [O III] lines. | ||||
| CDFS-LAB11 | 84 6 | 79 3 | 26.5 0.7 | (1) ccThe profiles of CDFS-LAB01 and 11 are not significantly broader than the [O III] lines. | ||||
| CDFS-LAB10 | 247 147 | 425 97 | 18.7 2.4 | (1) ddThe profile of CDFS-LAB10 is composed of multiple components (Figure 4). Here the total integrated profile is used for the fit. | ||||
| CDFS-LAB13 | 152 14 | 100 9 | 13.7 0.7 | 277 8 | 43 8 | 4.0 0.5 | (2) | |
| CDFS-LAB06 | 123 15 | 150 13 | 25.7 1.3 | (1) | ||||
| CDFS-LAB02 | 211 43 | 192 35 | 8.2 0.9 | 342 117 | 273 137 | 3.3 1.3 | (2) | |
| CDFS-LAB07 | 181 15 | 168 10 | 22.2 0.8 | (1) | ||||
| CDFS-LAB14 | 371 34 | 202 24 | 18.0 1.2 | 404 17 | 176 18 | 12.4 1.1 | (3) | |
| Name | aa The line widths ( and ) are not corrected for the intrumental profile, because some of the line widths are comparable to the intrumental resolution ( 31 km s-1in the NIR). | bb and are the fluxes in the broad and narrow components of the [O III] emision line, respectively. | cc + . | dd The maximum blueshifted velocity . For CDFS-LAB06 where the broad component is redshifted, we list . | ||
|---|---|---|---|---|---|---|
| ( km s-1) | ( km s-1) | ( km s-1) | ( km s-1) | |||
| CDFS-LAB06 | 38 3 | 39 27 | 55 10 | 0.51 | 0.35 0.17 | 152 15 |
| CDFS-LAB07 | 44 2 | 97 23 | 64 10 | 0.44 | 0.32 0.12 | 222 11 |
| CDFS-LAB13 | 35 5 | 56 21 | 60 11 | 0.84 | 0.46 0.13 | 174 18 |
| CDFS-LAB14 | 67 16 | 12 71 | 125 40 | 0.47 | 0.33 0.20 | 262 75 |
| CDFS-LAB10 | 71 1 | |||||
| CDFS-LAB11 | 47 1 |