FUSE Observations of a Full Orbit of Scorpius X-1
Abstract
We obtained UV spectra of X-ray binary Scorpius X-1 in the 900–1200Å range with the Far Ultraviolet Spectroscopic Explorer over the full 0.79 day binary orbit. The strongest emission lines are the doublet of O VI at 1032,1038Å and the C III complex at 1175Å. The spectrum is affected by a multitude of narrow interstellar absorption lines, both atomic and molecular. Examination of line variability and Doppler tomograms suggests emission from both the neighborhood of the donor star and the accretion disk. Models of turbulence and Doppler broadened Keplerian disk lines Doppler shifted with the orbit of the neutron star added to narrow Gaussian emission lines with undetermined Doppler shift fit the data with consistent values of disk radius, inclination, and radial line brightness profile. The Doppler shift of the narrow component with the orbit suggests an association with the donor star. We test our line models with previously analyzed near UV spectra obtained with the Hubble Space Telescope Goddard High Resolution Spectrograph and archival spectra obtained with the HST Cosmic Origins Spectrograph.
1 Introduction
Sco X-1 is prototype for the “Z sources” that trace out Z-shaped tracks in X-ray color-color diagrams. These neutron stars accreting from low mass companions typically do not show X-ray pulsations, but some may display instead bursts due to runaway nuclear burning of accreted gas, confirming the identification of the compact objects as neutron stars with the measurement of radii from the burst blackbody spectra.
Searches for X-ray periodicities have instead revealed multiple broad power spectral peaks from Hz, the Quasi-Periodic Oscillations, as well as a complex and variable noise continuum. The neutron stars in the Z sources and similar atoll sources may have lower magnetic fields than the neutron stars in pulsars, leading the inner accretion disk to penetrate closer to the surface of the neutron star. The kHz QPO phenomenon probably results from some interaction of a rapidly spinning neutron star and the rapid rotation of the inner accretion disk. Models of the QPOs promise to measure the mass and radius of the neutron star (and thus constrain the equation of state of the degenerate interior) but different QPO models lead to different results.
Studies of spectral variability could help to confirm or refute some of the QPO models. For example, the mass of the neutron star could be bounded by orbital Doppler shifts from the disk and donor star, limits on the inclination, or through Keplerian velocities in the accretion disk. Sco X-1 is close (2.8 kpc from parallax measurements with the VLBA, Bradshaw, Fomalont & Geldzahler 1999) and as a Z source is expected to emit near the Eddington limit for a neutron star ( erg s-1). Yet the accretion kinematics and system parameters are not as well known as for Cataclysmic Variables (CVs), more common (and thus closer) accreting white dwarf systems, or for X-ray binaries with pulsars or with a high enough inclination for eclipses and X-ray dips. We still remain ignorant of the shape of the accretion disk, whether it is warped and precesses, and the role, if any, of winds from the disk and companion star that might be caused by the X-ray illumination.
The optical counterpart was found by Sandage et al. (1966), and the orbital period of 0.787 days is detected in optical variability (Gottlieb, Wright, & Liller 1975). The optical spectrum includes variable lines of He II (Cowley & Crampton 1975) and a complex of lines from N III and C III near 4640Å which result from the Bowen fluorescence process in which He II Lyman pumps EUV O III lines which in turn excite N III (Bowen, 1934, 1935; Willis et al. 1980; Schachter, Filippenko, & Kahn 1989).
The UV waveband is particularly well suited for the study of the accretion disks in X-ray binaries, as the multiple resonance lines, with greater flux than the optical lines, can be used to diagnose the gas density, temperature, ionization stage, and optical depth. Vrtilek et al. (1991) used simultaneous GINGA and IUE observations to relate the X-ray state to the UV line and continuum strength. Kallman, Boroson, & Vrtilek (1998) used the Goddard High Resolution Spectrograph on the Hubble Space Telescope to study the UV lines (with resolution up to ) and continuum and perform cross-correlations with X-rays observed simultaneously with the Rossi X-ray Timing Explorer.
Sco X-1 has not been previously observed in the far UV (900-1200Å). This wavelength range is of particular interest because of the O VI doublet at 1031.9 and 1037.6Å. Along with the N V and C IV doublets in the near UV that can be seen with HST (Kallman, Boroson, & Vrtilek 1998), these are the strongest line signatures from X-ray ionization of the accretion disk. The O VI ion has a slightly higher ionization potential than the near UV ions, and a wider doublet separation which rules out overlap between the line components for most velocities expected from the accretion disk. Other important lines in this wavelength region include a blend of C III at 1175Å and an N III line at 991Å that is involved in the Bowen fluorescence process that causes the 4640Å lines.
Reconstruction techniques such as Doppler tomography, which has been applied to CVs, and echo mapping, which has been applied to both CVs and AGN, have also been applied to Sco X-1 (Steeghs & Casares 2002, Muñoz-Daries et al. 2007). These studies resulted in the first spectroscopic measurement of the motion of the donor star and a limit on the mass ratio (Steeghs & Casares 2002).
In order to investigate for the first time the far UV spectral lines, and to extend the mapping techniques to infer the system and accretion kinematics, we used the Far Ultraviolet Spectroscopic Explorer (FUSE) to obtain the spectra at times evenly spaced throughout the binary orbit. This time coverage allows us to construct Doppler tomograms and model orbital variations.
We have presented an analysis of the far UV spectrum of the X-ray binary Hercules X-1 as recorded over a binary orbit (Boroson et al. 2007). The methods we applied in that case are generally applicable to Sco X-1 as well. Since Sco X-1 does not eclipse we cannot apply eclipse-mapping techniques but we can apply tomography. Unfortunately, Sco X-1 is also behind a much greater column density of interstellar gas, which we have to model in order to reach conclusions about the variable emission from the system itself.
This paper is organized as follows. In Section 2, we describe the observations in detail. In Section 3, we analyze the extensive signatures of interstellar absorption on the spectrum, including absorption lines from both atoms and molecular hydrogen. Accounting for the interstellar absorption is neccessary for accurate modeling of the intrinsic source spectrum. In Section 4, we describe the Doppler tomography of the lines, and in Section 5 we describe more detailed models of the emission line variability. In Section 6, we model the continuum.
2 FUSE Observations
FUSE was a NASA Origins mission operated by The Johns Hopkins University. The spectral coverage is between 900 and 1190Å, with a resolution of Å. Four aligned telescopes feed two identical far-UV spectrographs with resolution R. The FUSE mission is described in more detail in Moos et al. (2000) and its on-orbit performance is described in Sahnow et al. (2000).
Our FUSE observations began on August 19, 2001 at 5:59 UT. Table 1 shows the log of exposures, each of which is integrated over each FUSE orbit of the Earth, with gaps when Sco X-1 goes below the horizon. We use the orbital ephemeris of Steeghs & Casares (2002) to determine the orbital phases (in the Sco X-1 system) of our observation, which we also present in Table 1. To convert to orbital phases according to the updated ephemeris of Galloway et al. (2014), subtract 0.011 from the phases displayed. We supplement the FUSE observations with observations using the Cosmic Origins Spectrograph (COS) on the Hubble Space Telescope in 2010. The log of these observations is shown in Table 2.
We used the CalFUSE pipeline software version 3.2.1 to extract and calibrate the data from all four FUSE telescopes. Below 1100Å, where emission features are sharp, we added an offset to each wavelength scale, in intervals of 0.025Å, so that the absorption and emission features from each detector best agreed. We tested our wavelength calibration against the interstellar Si II absorption line, which we found to have a mean heliocentric velocity of km s-1. The standard deviation of the centroid of this line from orbit to orbit was Å or km s-1.
The S/N of the data was per 0.1Å pixel in the continuum in the region Å and near 1100Å. The S/N within the O VI line had greater variation with orbital phase, as the doublet changed both in shape and in strength. At , the peak S/N within the doublet was per 0.1Å pixel, while at , the peak S/N was per pixel.
In Figure 1, we show the average observed FUSE spectrum and compare it with the continuum model we developed based on near-UV observations (Vrtilek et al. 1991). We indicate the same prominent stellar emission lines in the far UV as Robert et al. (2003): S IV at 1062.7Å,1073.0Å, and 1073.5Å, C III multiplet at 1175.6Å, P V at 1128.0Å, Si IV at 1128.3 Å, and the O VI doublet at 1031.9 and 1037.6Å.
We mark geocoronal (airglow) lines produced in the Earth’s atmosphere as given by Feldman et al. (2001): H I Lyman- at 973Å, O I at 989Å, and H I Lyman-+O I from 1026-1027Å.
3 COS observations
Spectra of Scorpius X-1 in the 1300–1450Å range were taken in October 22, 2010 using the Cosmic Origins Spectrograph (COS, Osterman et al. 2011) aboard the Hubble Space Telescope. We present a time-averaged spectrum, binned by 9 pixels, in Figure 2. While the UV lines are known to vary with the X-ray state of the neutron star (Vrtilek et al. 1991), spectra with this high resolution and sensitivity may help constrain the models we develop to understand the FUSE spectra.
4 Interstellar absorption features
We fit the H2 lines to a broad range of the spectrum and only fit individual atomic absorption lines in the vicinity of the O VI doublet. Precise modeling of the interstellar absorption lines is necessary for interpretation of the emission features intrinsic to Sco X-1.
To fit the molecular lines, we use line templates from McCandliss (2003), which are based on Abgrall et al. (1993a, 1993b). We include all rotational states from to , and allow two independent absorption components. Each component has its own fixed velocity width parameter and centroid offset, with column densities free from to . The continuum is assumed to be linear, and only the wavelength ranges from 1000Åto 1020Å, 1041Åto 1048Å, 1050Åto 1071Å, and 1080Å to 1120Åare used. These wavelength ranges were chosen to exclude prominent emission lines, which might vary and bias the measurement of interstellar absorption features.
The best fit total column density ( to ) is 6.7 cm-2 and 1.0 cm-2 in the two components. Using and levels with statistical weights and the energy difference K, we find the first component is at K, consistent with H2 towards disk stars, whereas the second, weaker component is consistent with the high temperature limit (Gillmon et al. 2006).
The saturated interstellar H Lyman line at 1026.7Å provides a measure of interstellar absorption, and its placement near the O VI doublet requires that the O VI emission lines and Ly line be modeled together. We describe our model of the emission lines (from both accretion disk and donor star) in §6.
The Ly line was fit to a Voigt profile and was found to have a column density N cm-2. Kallman, Boroson, & Vrtilek (1998) found N cm-2 from the Ly line at 1216Å, observed with the GHRS. Kallman, Raymond, & Vrtilek (1991) found N cm-2 from fits to the Ly absorption observed with IUE. Scaling from the H absorption to the expected reddening using the relation of Diplas & Savage (1994), NE cm-2 mag-1, we find E. However, we note that there are deviations from the relation between E and NH.
5 Doppler tomography
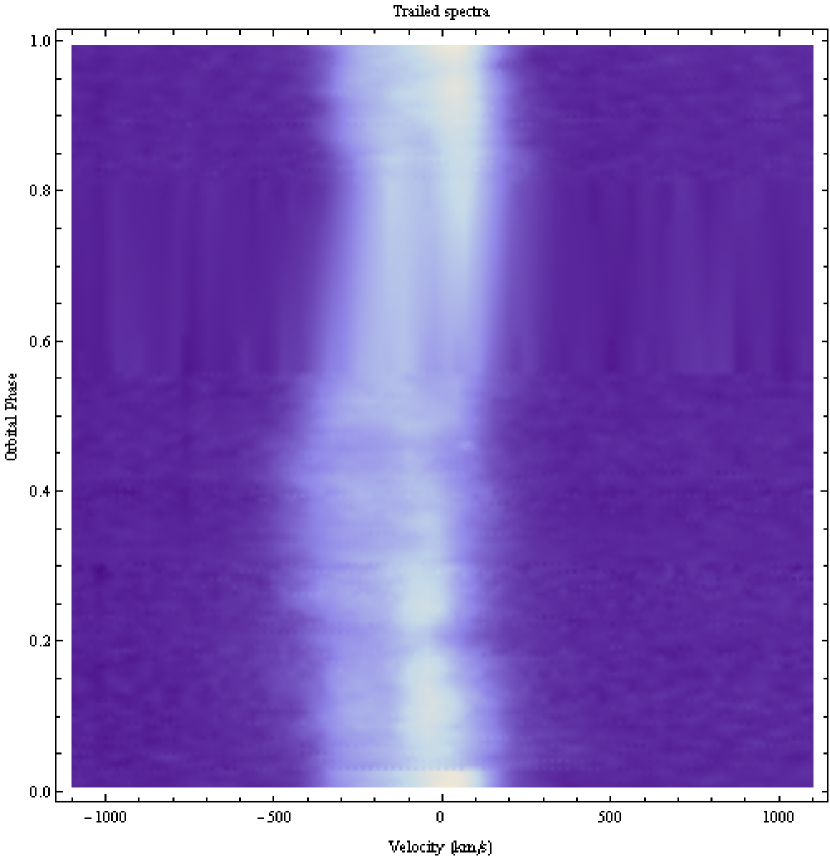
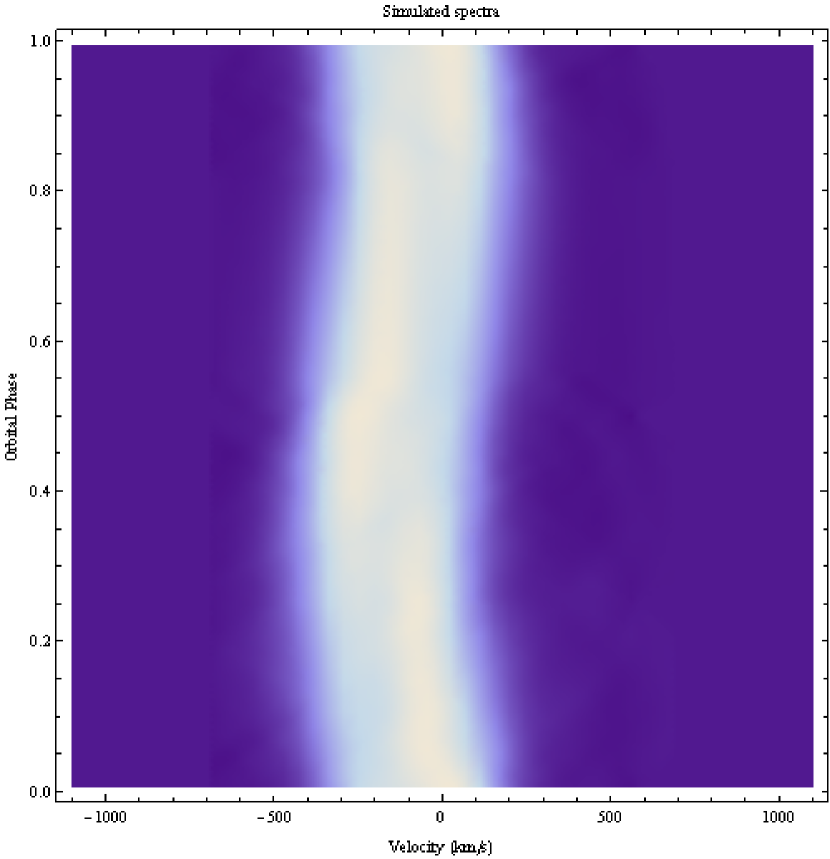
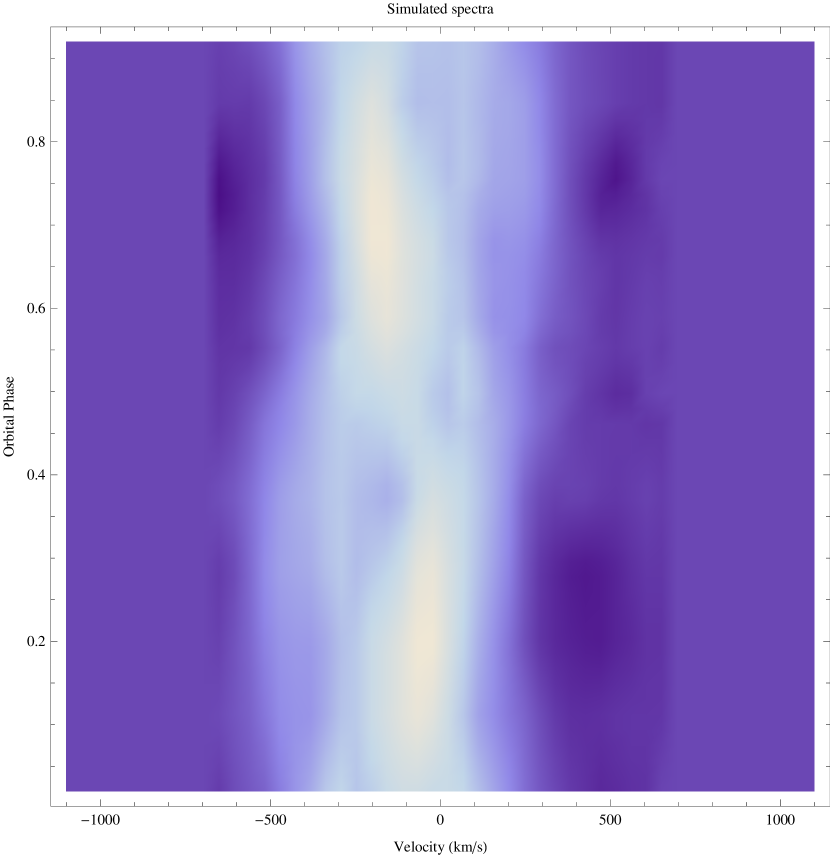
The Doppler tomography method, developed by Marsh and Horne (Marsh & Horne 1988, Marsh 2005) takes as input an emission line which is broadened by line of sight motion. The line must be observed over a good sampling of the binary orbit.
We determine the tomograms using Fourier-Filtered Back Projection. This involves applying the Fourier transform to each spectrum, multiplying by a ramp filter and a Wiener filter based on the noise level, and then taking the inverse Fourier transform. The resulting spectra were then back-projected, or integrated, to provide a tomogram. We did not apply Maximum Entropy regularization.
As a test that our filtering technique does not introduce artifacts, we have obtained (Steeghs, D., personal communication) the optical spectra of Sco X-1 presented in Steeghs & Casares (2002). Our tomograms of the optical lines (presented in Figures 3) give similar results to the Maximum Entropy Method used by Steeghs & Casares for the lines that we both analyzed. We have assumed a systemic velocity of km s-1 for the Sco X-1 system (Steeghs & Casares 2002).
The Doppler tomograms are limited by our phase coverage (15 time-separated spectra) and by the reconstruction of the underlying spectrum by correction for interstellar absorption lines (§4), but the exercise is valuable in rendering the system independent of particular models.
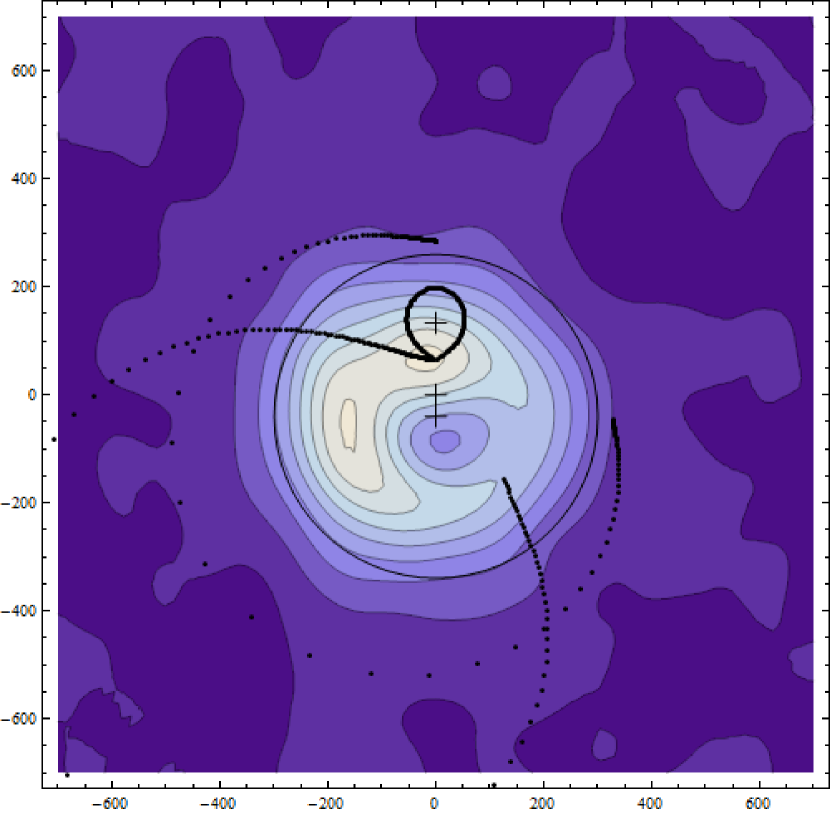
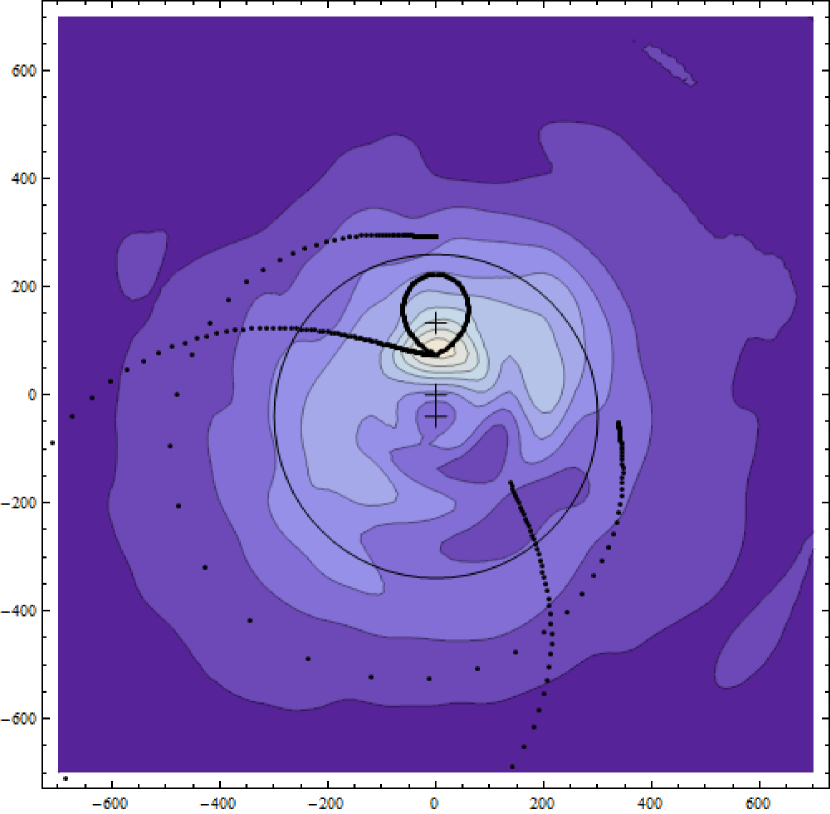
In Figure 4 we show a Doppler tomogram of the blue component of the O VI doublet, which is less affected by interstellar absorption. We have interpolated between orbital phases for the integration, which we perform between and . A compact bright spot on the tomogram overlaps with emission expected from the Roche lobe of the donor star. There is also a suggestion of an incomplete ring surrounding the position of the neutron star in the tomogram.
The continuum model developed prior to the observations was scaled to the continuum at each FUSE orbit and was subtracted from each spectrum. Where strong interstellar absorption lines of molecular hydrogen were present, we have adjusted for their presence. We fit the H2 absorbers to the entire FUSE spectrum (section 4), and divide the spectrum by this model. In the vicinity of the O VI doublet, we correct also for atomic Lyman absorption, using a simultaneous model for the emission and absorption lines (see section 6). Thus the tomograms near O VI corrected for interstellar lines are not entirely model-independent. We interpolate over any resulting data points that have significance to avoid magnifying the uncertain flux near the trough of saturated absorption lines. There may be some remaining unidentified and uncorrected interstellar features that overlap with O VI. There may be absorption from interstellar O VI itself, perhaps enhanced by photoionization of the surrounding ISM by Sco X-1 (McCray, Wright, & Hatchett, 1977), but we could not identify such lines unambiguously.
6 Detailed Line Models
In addition to Doppler tomography, which makes no assumptions about the location of the emission, we also fit to the emission lines detailed empirical models that make use of what is known from other studies.
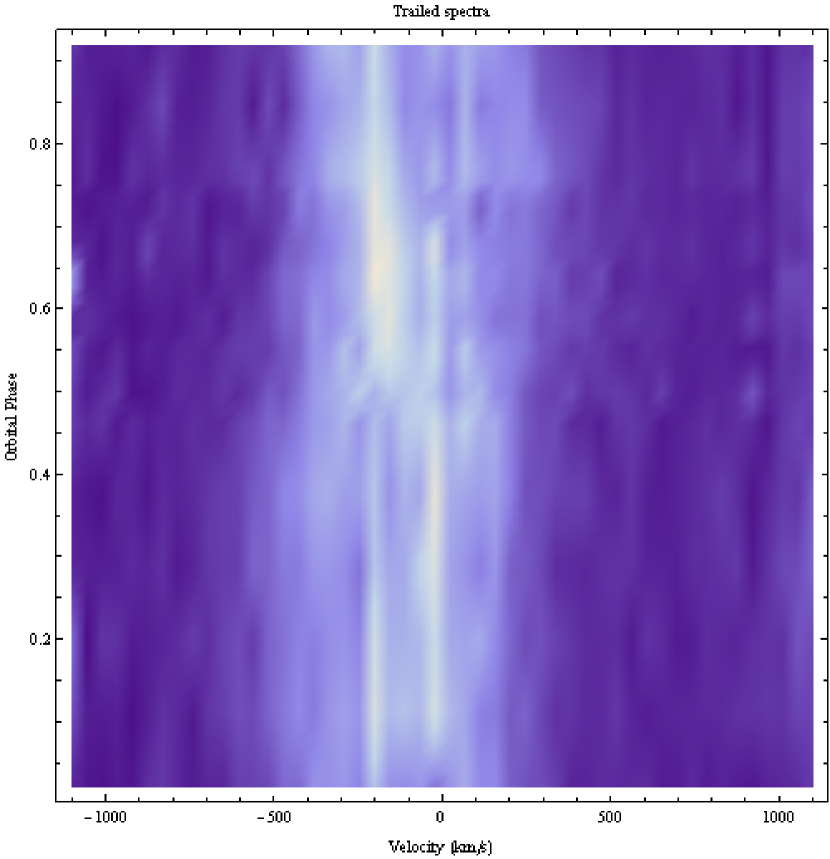
As a preliminary, we fit the lines with a single broad emission component (with a Gaussian or Lorentzian shape), subject to interstellar absorption, at each orbital phase. The centroid of the lines matched closely the expected orbital velocity of the disk (Steeghs & Casares 2002). The tomograms suggest that emission is also present from a more compact region. However, models with line width, centroid, and normalization of both narrow and broad components left as free parameters were not constrained by the data.
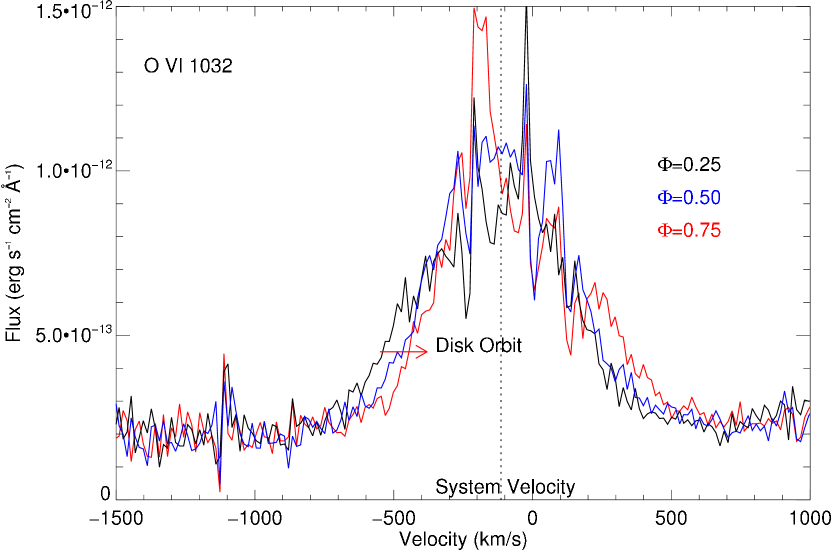
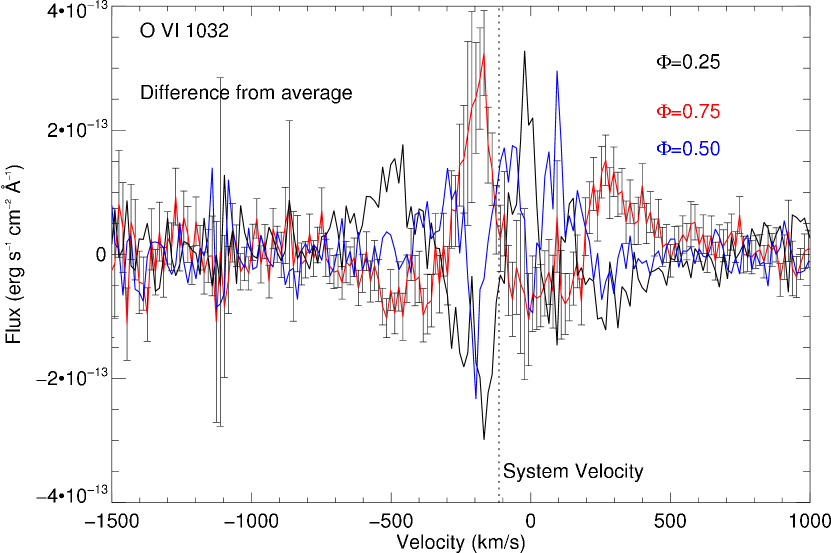
As further evidence that the lines contain a component emitted in the disk we show in Figure 5 that the average O VI line near displays a trend of Doppler shift as expected from the neutron star. Looking at the differences between the line spectra at from the average (Figure 6) highlights the presence of a narrow emission component.
To fit a detailed model of both disk and narrow line emission, we fixed the centroids of disk emission to those expected based on the mass ratio and velocity curve of Steeghs & Casares (2002). The disk line is modelled using the method presented in Boroson et al. (2007), based on Horne (1995), allowing for turbulence and Keplerian shear. We set the components of the Mach turbulence matrix MRR and Mθθ to 1, and MRθ to 0.5. This results in line profiles that are not sharply double-peaked. Horne (1995) mentions that the MZR component of the turbulence matrix produces effects that are hard to distinguish from the MRR component, and that correlated Z and R motion is similar to a radial wind rising above the disk. Thus the effects of the turbulence model we assume may mimic the result of an accretion disk wind. The models of Chiang (2001) show that a disk wind model can fit the UV line profiles of Hercules X-1, which do not show clear double-peaked structure.
The stellar line is assumed to be a Gaussian with the same width at each orbital phase. The width is left as a free parameter of the fit. Although the Gaussian shape is not motivated by physical considerations, it is a useful parameterization that allows us to check our assumption of an emission component arising on the normal star, and to obtain a crude measure of the width, flux, and variability in such a component. In an earlier study of Hercules X-1 (Boroson et al. 2000) we fit both the disk and donor star components using Gaussians. The continuum at each phase is scaled from the model we prepared before obtaining the observations. The normalizations of the disk and stellar lines are allowed to vary at each orbital phase.
We use a Nelder & Mead (1965) downhill simplex method to fit the spectra in the neighborhood of the bright emission lines. The best-fit parameters obtained by this method are shown in Table 3. For each line, we present fits obtained with the mass accretion rate fixed to give the Eddington luminosity for a 1.4 M⊙ neutron star, L M⊙ yr-1, and fits with as a free parameter. The fits depend strongly on the inclination and the radius of the disk edge combined in the disk edge velocity , and only weakly on the inclination itself. In our fits, we have frozen the inclination to as found for the inclination of the radio jet by Fomalont et al. (2001), and present only in Table 3.
For the brightest emission line feature, the O VI doublet, the ratio of the narrow emission features (1032Å line to 1038Å line) is allowed to vary, while the ratio for the disk lines is determined from the disk models. The interstellar H2 absorption is determined from fits to other spectral ranges, while interstellar atomic absorption from Si II, O I, C II and O I are fit along with the emission lines, though they are constrained to be constant over time. The saturated H Ly line at 1026.7Å is also fit along with the emission lines.
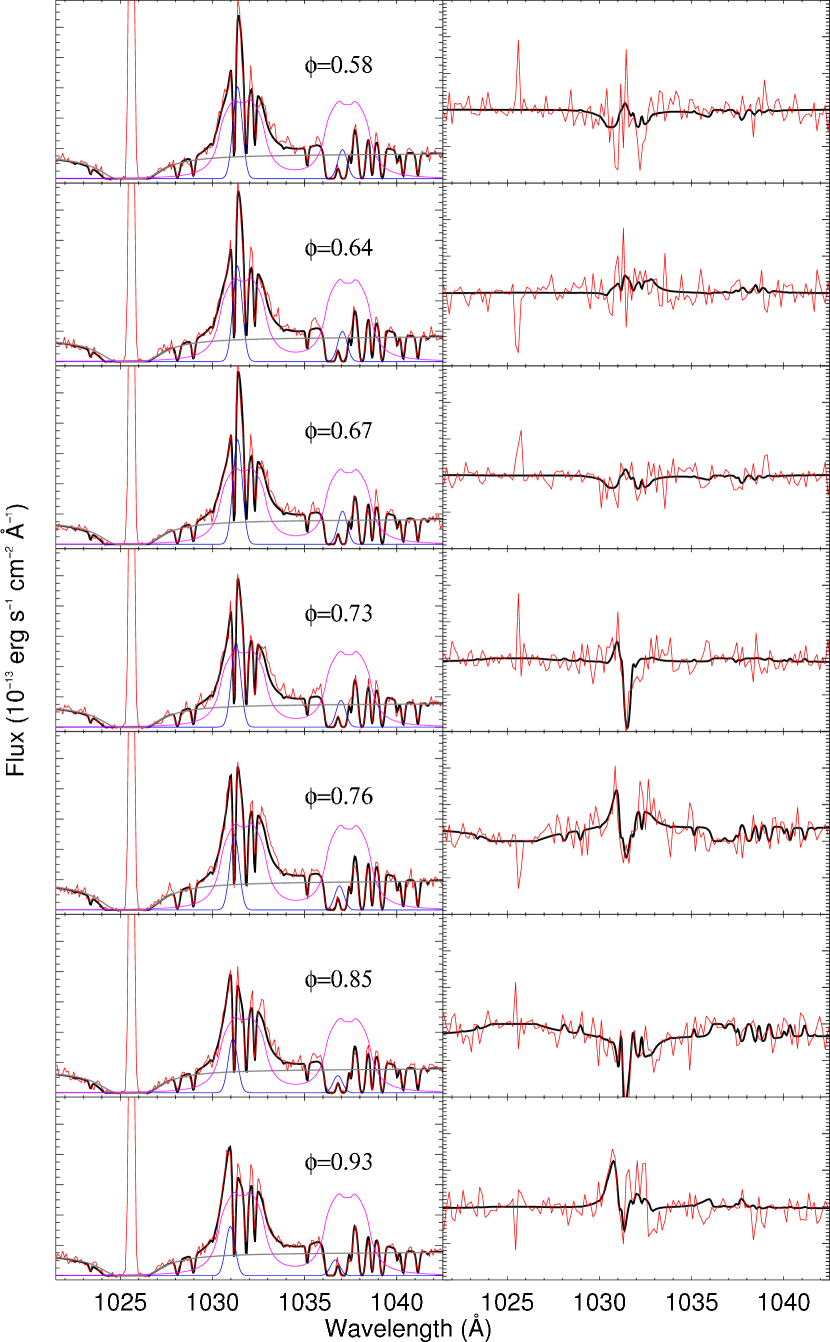
We plot the results in Figure 7. The formal for the fit is with degrees of freedom, or a reduced of . The narrow Gaussian lines from the normal star appear to be much weaker near , so that in spite of the low inclination of the system, the heated spot on the donor star may be obscured.
The best-fit projected velocity at the outer edge of the accretion disk, km s-1, implies a disk radius cm for . While significantly smaller than the result of 2.5 cm found from fits to C IV and N V lines by Kallman et al. (1998), this is still unphysical as it is comparable to the distance of the L1 point from the neutron star, cm. The average radius of the Roche lobe of the neutron star should be 1.5 cm. If the disk inclination is 38∘, or 1 below the measured value of the jet inclination as favored for the orbital inclination by Steeghs & Casares (2002) from orbital constraints, then the outer disk radius implied by the best-fit is 1.5 cm.
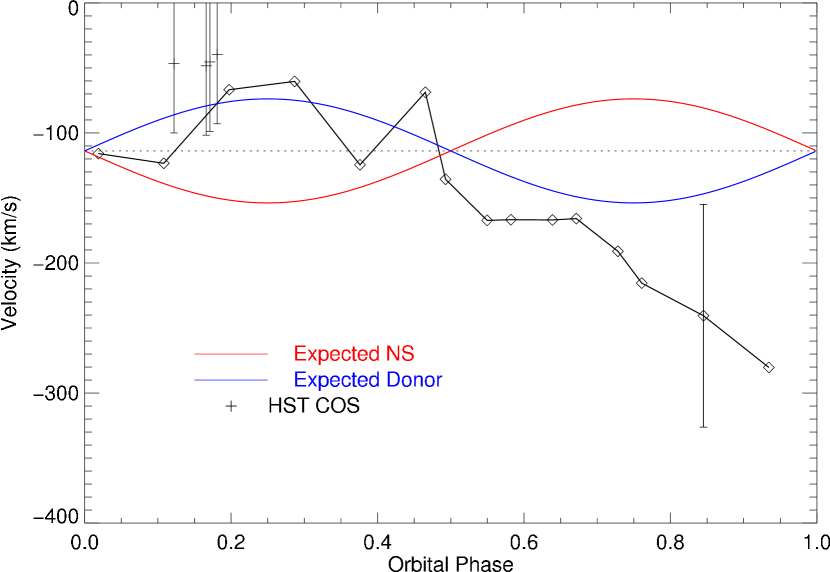
In Figure 8 we show the total flux in the disk and narrow lines as a function of orbital phase and in Figure 9 we show the velocities of the Doppler shifts of the centroids of the narrow emission components of O IV as a function of orbital phase.
The results of the fit to O VI should be treated with caution because of the extensive modeling of interstellar lines required to match the data. The choice of a Gaussian shape for the stellar component probably does not have much of an effect on our conclusions about the accretion disk. When we use a Lorentzian shape instead, the average disk flux only differs by 3% and the disk flux at the 15 phases observed, as determined by both fits in which the stellar component has a Gaussian or Lorentzian shape, have a cross-correlation coefficient of 0.93. If instead we fit our model to only half of the observations, we still obtain a disk edge velocity of 200 km s-1 and a radial emissivity power law constant of -0.98. Thus our fitted parameter values appear not very sensitive either to our choice of the emission profile from the donor star or from our sampling of the data. Comparing the parameters obtained when the mass-accretion rate parameter is fixed to the value giving the Eddington luminosity also gives a sense of how sensitive our fits are to assumptions made about the system.
We test the model by applying it to the C III lines at 1175Å. While there are no clear interstellar absorption features near 1175Å, either atomic or molecular, the interaction between the 6 components of the lines may present complications. We calculate the line profiles using the oscillator strengths presented in Sokolov (2011), based on the Vienna Atomic Line Database (VALD-D, Kupka et al. 1999). A first fit, assuming the narrow components were optically thin, predicted that all emission was from the disk and none from the heated stellar surface, and the outer disk radius was twice as large (2.2 cm) than the fits to O VI suggested. Because of the effective broadening of the multiplet components in C III, it is more difficult for narrow stellar emission features to stand out against the disk line, and a larger disk size (slower Keplerian velocities) could compensate for neglected stellar components.
To test whether the narrow stellar components suggested by the O VI fits could also be accomodated by the C III lines, we fixed the ratio of narrow stellar to broad disk emission at each phase to that found for O VI (the fit with the mass accretion rate through the disk as a free parameter). This fit did not improve on the fit with all emission from the disk. At some phases, the narrow features would stick above the disk line and be noticeable. However, if we dropped the assumption that the narrow C III lines were optically thin, we obtained good fits, with a reduced and a disk edge velocity of km s-1.
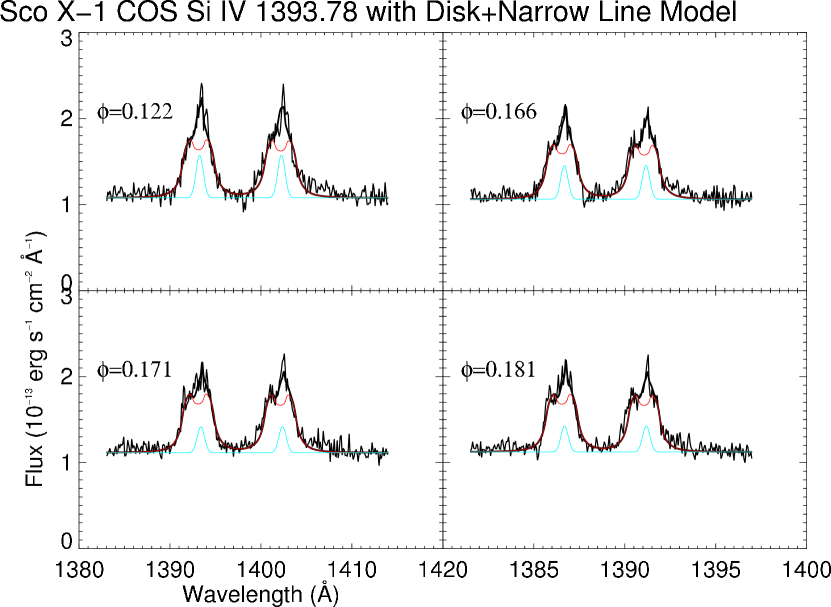
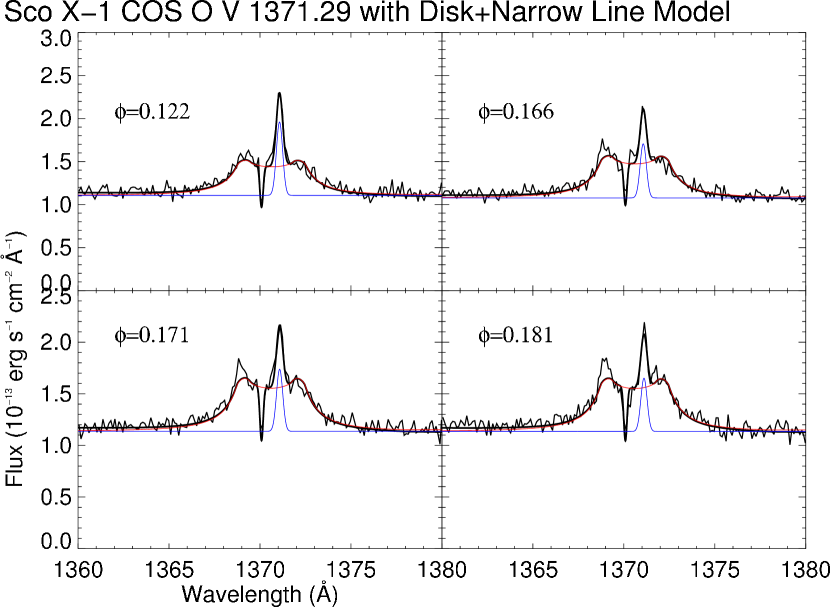
We fit the model to the Si IV doublet at 1393 and 1403Å and the O V line at 1371Å observed in 2010 with the HST COS. The lines from Sco X-1 are subject to interstellar absorption from Ni II at 1370.13Å, and Si IV itself. The model fits the spectra well (Figures 10 and 11), with similar values for disk radius, narrow line width, and narrow line velocity. The O V line shows a clearer double-peak structure than the Si IV doublet components. In contrast to the other lines, O V at 1371Å is not a resonance line; the lower level of the transition is an excited level. As such, O V is less likely to absorb or scatter radiation. This may explain why the disk line is more clearly double-peaked and why the O V stellar line is more narrow than for the other transitions. We obtained a better fit for O V at 1371Å by allowing as free parameters Mach turbulence matrix elements MRR and Mθθ and setting M.
We also fit the N V doublet at 1239,1243Å and the C IV doublet at 1549,1551Å observed with the HST GHRS, and confirm the result of Kallman, Boroson, & Vrtilek (1998) that disk models assuming standard parameters do not fit well. Our models match the spectra best for radial emissivity exponents and narrow line components with Gaussian width far greater than in the fits to FUSE or COS spectra (Å instead of Å).
We include estimates of total line flux in Table 4, but we do not include the unphysical parameters of the fits to these lines in Table 3. The fluxes in Table 4 have been corrected for overlapping interstellar absorption lines but should not otherwise depend strongly on our models for the emission lines.
7 Bowen fluorescence and N III emission
The Bowen Fluorescence process (Schachter, Filippenko, & Kahn 1989) arises because of the nearly perfect coincidence of the He II Ly and the O III 2p2 – 2p3d resonance line (304), resulting in O III near–UV primary cascades at 3133, 3444 and secondary cascades at 374 back to the ground state. If conditions are right, an additional fluorescence occurs, since the O III374 line is almost coincident with the two N III 2p – 3d resonance lines, resulting in N III optical primary cascades at 4634, 4641, 4642. The emission in all of these cascades is completely dominated by the Bowen process; detection of any of them is a clear confirmation.
In Boroson et al. (2007), we observed the N III990 line, an analogous ground-state Bowen cascade produced as a result of the N III primary cascades. This detection confirmed the presence of the Bowen process and set limits on the size of the emitting region.
The intensity of N III resulting from Bowen fluorescence is related to the intensity of the Bowen lines at 4640 Åby
| (1) |
where is the branching ratio of 2p-2s2p2 2D versus 3p-3s. From CHIANTI, we take and . The remainder of the line intensity is therefore from collisional excitation and is given by . Our measurement of the intrinsic 991Å line flux depends on the E(B-V) reddening value we adopt, as well as our reconstruction of the interstellar molecular and atomic absorption lines that overlap with the 991Åline. We take I(4640) from Schachter, Filippenko, & Kahn (1989), although the observations were not contemporaneous. From our estimate that without absorption lines the N III line flux would be erg cm-1 s-1, we find that the Bowen process would have contributed 17% of this amount. For E(B-V), the Bowen contributions to the dereddened line would be 4%, 0.8%, 0.2%, and 0.04%, respectively.
Another consequence of the N III cascade should be a multiplet near 1184Å. The 2p3 2P states that feed the 2s2p2 2D state also decay to the 2s2p2 2S and 2D states, resulting in unobservable lines at 772.9Å and 1006Å. Lines at 1182.97,1183.03,1184.51, and 1184.57Å, with relative strengths of 0.21, 0.33, 0.42, and 0.16, respectively, might be observed at the long-wavelength edge of the FUSE detectors. The photon flux in the 1184Å multiplet should be 67% of the contribution to the 991Å line. As shown in Figure 1, there is no hint of an upturn in flux near 1184Å.
In Boroson et al. (2007), we also considered the ratio of N III at 991Å to C III at 977Å as a diagnostic of the Bowen process contribution to the 991Å line. For Sco X-1, this is rendered difficult by the larger interstellar absorbing column. The C III line overlaps both a saturated absorption line from interstellar C III and also an O I line at 976.448Å. Raymond (1993) found ratios between the N III line excited collisionally and C III of assuming cosmic abundance. If instead abundances enhanced by the CNO process were assumed, the ratio would be . For Her X-1 the ratio of did not require enhancement by Bowen fluorescence. In the case of Sco X-1, our attempts to fit the C III line suggest .
Given that even for E(B-V)=0, we expect from non-contemporaneous observations of N III lines at 4640Å that only 17% of the line flux arises from the Bowen process, and that the fluorescence lines at 1184Å were not observed, it seems likely that Bowen fluorescence cannot explain the large ratio. Instead, we suggest either that CNO processing has enhanced the N/C ratio beyond that assumed by Raymond (1993), or that our models have underestimated the C III flux at 977Å, which may be concentrated at wavelengths that overlap with saturated interstellar absorption. This conclusion depends on the suitability of the non-contemporaneous observations for comparison. The optical lines at 4640Å and UV lines at 991Å may be highly variable, and the values we have adopted could have been measured when the source was in extreme states of line flux.
8 Discussion
UV emission line variability, whether investigated through differences from the mean spectrum, through Doppler tomography, or through detailed line models, suggests that a portion of the emission arises from the accretion disk and that in addition, narrower emission lines are present. For much of the binary orbit, the narrow lines appear to move as expected from the X-ray heated face of the normal star. The spectra and models are not sufficient to determine whether deviations are the result of scattering of the resonance lines, perhaps in an outflowing wind, or whether another source of emission, for example a hot spot where the gas stream strikes the disk, may contribute.
When we compare the line fluxes with those predicted by Raymond (1993), as shown in Table 4, we find the rms difference is at a minimum for E(B-V), but that the Pearson correlation is highest (for either the COS model with cosmic abundances or the CNO enhanced model) for E(B-V), with the CNO model providing a higher correlation to the observed line fluxes (observed at 3 separate times with 3 different instruments) than the COS model. For E(B-V), the dereddened line fluxes observed are greater than predicted by Raymond (1993). Some of this may be explained by the larger disk radius that we find.
We also note that the emission lines were not observed contemporaneously. Table 4 presents line fluxes measured at separate times using FUSE (N III, O VI, and C III), GHRS (N V and C IV), and COS (Si IV and O V). The Si IV line flux in the COS model is greater than the flux observed for E(B-V)=0.1, whereas the O VI flux is under-predicted. If the mass accretion rate were higher during the FUSE observation than the COS observation, this could explain both the higher O VI flux compared with the model and the greater disk radius.
The interpretation of the lines depends not only on the uncertain mass accretion rate and amount of interstellar extinction (we show fluxes dereddened for E(B-V)) but also on the details of the reddening curve in the far UV range. We have assumed the CCM reddening curve (Cardelli, Clayton, & Mathis, 1989), scaling between E(B-V) and A(V) by using , but there the column towards Sco X-1 may have unusual reddening in the far UV, similar to Sco (Schachter, Filippenko, & Kahn 1989). We examined the reddening curves fit by Gordon, Cartledge, & Clayton (2009) to 75 sight lines using FUSE spectra, and find in particular that the sample star closest to Sco X-1, HD 147888, does not require a weaker correction for far UV wavelengths than typical, although the difference in the fit parameter that determines this effect, , is only . Still, we find that the details of the redening curve may contribute some systematic uncertainty to the line estimates beyond the uncertainty in the quantity of reddening. For example, for E(B-V)=0.1, using the CCM model, the dereddening of N III at 991Å is 2.2 times greater than the dereddening of C IV at 1550Å. Using instead the parameters for HD 147888, including , the dereddening is only 1.8 times great for N III.
Our disk line models very crudely estimate the mass flow through the accretion disk. The optical depths of the lines follow from the density determined by and our assumed atomic abundance and ion fraction. We do not model the ionization in the disk, but assume the peak fraction given by Model 5 of the photoionization calculations of Kallman & McCray (1982). The N III lines near 990Å give a lower estimate than the other lines, but this blend includes a non-resonance line.
The Bowen process does not appear to contribute to the N III line, either based on the strength of the feature expected from the optical lines or on the absence of features near 1184Å. The strength of the N III line relative to the C III line at 977Å provides more circumstantial evidence for CNO enhancement, although the 977Å line, in common with much of the spectrum observed with FUSE, coincides with saturated instellar absorption features.
9 Conclusions
Although the far UV spectrum of Sco X-1 is subject to many interstellar molecular and atomic absorption features, the emission lines may be resolved into components similar to those seen in Hercules X-1 (Boroson et al. 2007): narrow lines associated with the X-ray illuminated face of the donor star and broad lines associated with the accretion disk around the compact object. In further work (Boroson et al. 2014, in preparation), we will present similar results for the Z-source Cygnus X-2, observed with the HST COS.
The broad emission lines do not display a clear double-peaked shape. Our models show that turbulence or a disk wind could blur out these peaks.
For some emission lines the fits are not good or imply a disk larger than the Roche lobe of the neutron star. The widths of the broad lines are easier to accomodate if the inclination of the disk is at the low end of the jet inclination range of 44. Among the idealizations we have made in our disk model is the assumption that the disk is flat and not warped. A warped disk, as generally accepted in the Her X-1 system as an explanation of its 35-day X-ray cycle, would present different inclinations at different radii. A disk warp may shield portions of the disk from direct X-ray illumination as well. The current observations cannot constrain the full three-dimensional variable shape of the disk to confirm models of a disk warp.
We find no clear P Cygni absorption feature from a disk wind or an X-ray induced wind from the donor star, as we found in Her X-1 (Boroson et al. 2001). Sco X-1 has a lower inclination so such winds may not cover the line of sight towards emitting regions. Furthermore, X-rays from the neutron star may remove ions responsible for the UV resonance lines outside of the shadow of the accretion disk. The low inclination of Sco X-1 also limits how much of the accretion disk shadow covers the emitting regions.
Much remains to be learned about accretion in Sco X-1: the extent and role of disk winds versus turbulence, why some lines are fit poorly or require a disk too large, and the extent of disk warping, and what is changing as the X-rays move along the Z track. The low orbital inclination prevents the use of eclipse mapping as a tool. Instead, the response of the UV emission lines to the stochastic variability of the X-ray source may probe both the X-ray variability (for example, how isotropic it is) and the varying shape and physical conditions of the UV reprocessing regions. Future observations coordinating simultaneous X-ray and UV spectroscopy are encouraged.
References
- (1) Abgrall, H., Roueff, E., Launay, F., Roncin, J.Y., Subtil, J.L. 1993, A&AS, 101, 273
- (2) Abgrall, H., Roueff, E., Launay, F., Roncin, J.Y., & Subtil, J.L. 1993, A&AS, 101, 323
- (3) Boroson, B., Kallman, T., Vrtilek, S.D., Raymond, J., Still, M., Bautista, M., & Quaintrell, H. 2000, ApJ, 529, 414
- (4) Boroson, B., Kallman, T., & Vrtilek, S.D. 2001, ApJ, 562, 925
- (5) Boroson, B., Vrtilek, S.D., Raymond, J., & Still, M. 2007, ApJ, 667, 1087
- (6) Bowen, I.S. 1934, PASP, 46, 146
- (7) Bowen, I.S. 1935, ApJ, 81, 1
- (8) Cardelli, J.A., Clayton, G.C., & Mathis, J.S. 1989, ApJ, 345, 245
- (9) Bradshaw, C.F., Fomalont, E.B., & Geldzahler, B.J. 1999, ApJ, 512, L121
- (10) Cowley, A.P. & Crampton, D. 1975, ApJ, 201, L65
- (11) Diplas, A., & Savage, B.D. 1994, ApJ, 427, 274
- (12) Feldman, P.D., Sahnow, D.J., Kruk, J.W., Murphy, E.M., & Moos, H.W. 2001, JGR, 106, 8119
- (13) Galloway, D., Premachandra, S., Steeghs, D., Marsh, T., Casares, J., & Cornelisse, R. 2014, ApJ, 781, 14
- (14) Gillmon, K., Shull, J.M., Tumlinson, J., & Danforth, C. 2006, ApJ, 636, 891
- (15) Gordon, K.D., Cartledge, S., & Clayton, G.C. 2009, ApJ, 705, 1320
- (16) Gottlieb, E.W., Wright, E.L., & Liller, W. 1975, ApJ, 195, L33
- (17) Horne, K. 1995, A&A, 297, 273
- (18) Kallman, T., Boroson, B., & Vrtilek, S.D. 1998, ApJ, 502, 441
- (19) Kallman, T.R., & McCray, R. 1982, ApJS, 50, 263
- (20) Kallman, T.R., Raymond, J.C., & Vrtilek, S.D. 1991, ApJ, 370, 717
- (21) Kupka, F., Piskunov, N., Ryabchikova, T.A., Stempels, H.C, & Weiss, W.W. 1999, A&AS, 138, 119
- (22) McCandliss, S.R. 2003, PASP, 115, 651
- (23) McCray, R., Wright, C., & Hatchett, S. 1977, ApJ, 211, 29
- (24) Marsh, T.R., & Horne, K. 1988, MNRAS, 235, 269
- (25) Marsh, T.R. 2005, A&SS, 296, 403
- (26) Moos, H.W., Cash, W.C., Cowie, L.L., Davidsen, A.F., Dupree, A.K., Feldman, P.D., Friedman, S.D., Green, J.C., et al. 2000, ApJ, 538, L1
- (27) Muñoz-Darias, T., Martìnez-Pais, I.G., Casares, J., Dhillon, V.S., Marsh, T.R., Cornelisse, R., Steeghs, D., & Charles, P.A. 2007, MNRAS, 379, 1637
- (28) Nelder, J.A., & Mead, R. 1965, CompJ, 7, 308
- (29) Osterman, et al. 2011. Ap&SS, 335, 257
- (30) Raymond, J.C. 1993, ApJ, 412, 267
- (31) Robert, C., Pellerin, A., Aloisi, A., Leitherer, C., Hoopes, C., & Heckman, T.M. 2003, ApJS, 144, 21
- (32) Sahnow, D.J., Moos, H.W., Ake, T.B., Andersen, J., Anderson, B.-G., Andre, M., Artis, D., Berman, A.F., Blair, W.P., Brownsberger, K.R., et al. 2000, ApJ, 538, L7
- (33) Sandage, A.R., et al. 1966, ApJ, 146, 316
- (34) Schachter, J., Filippenko, A.V., & Kahn, S.M. 1989, ApJ, 340 1049
- (35) Sokolov, N.A. 2011, astro-ph/10107.1894
- (36) Steeghs, D., & Casares, J. 2002, ApJ, 568, 273
- (37) Vrtilek, S.D., Raymond, J.C., Garcia, M.R., Verbunt, F., Hasinger, G., & Kurster, M. 1990, A&A, 235, 162
- (38) Vrtilek, S.D., Penninx, W., Raymond, J.C., Verbunt, F., Hertz, P., Wood, K., Lewin, W.H.G., & Mitsuda, K. 1991, ApJ, 376, 278
- (39) Willis, A.J. et al. 1980, ApJ, 237, 596
- (40)
| Orbit | File Identifier | MJD (start) | MJD (end) | Duration (s) | Orbital Phase |
|---|---|---|---|---|---|
| 1 | B0060101001 | 52140.2496 | 52140.2669 | 1490. | 0.493 |
| 2 | B0060101002 | 52140.3191 | 52140.3363 | 1485. | 0.582 |
| 3 | B0060101003 | 52140.3882 | 52140.4057 | 1509. | 0.671 |
| 4 | B0060101004 | 52140.4577 | 52140.4751 | 1503. | 0.761 |
| 5 | B0060101005 | 52140.5273 | 52140.5444 | 1482. | 0.845 |
| 6 | B0060101006 | 52140.5965 | 52140.6138 | 1496. | 0.934 |
| 7 | B0060101007 | 52140.6658 | 52140.6832 | 1508. | 0.019 |
| 8 | B0060101008 | 52140.7352 | 52140.7526 | 1506. | 0.108 |
| 9 | B0060101009 | 52140.8046 | 52140.8220 | 1504. | 0.197 |
| 10 | B0060101010 | 52140.8740 | 52140.8914 | 1505. | 0.287 |
| 11 | B0060101011 | 52140.9433 | 52140.9608 | 1508. | 0.376 |
| 12 | B0060101012 | 52141.0128 | 52141.0302 | 1501. | 0.465 |
| 13 | B0060101013 | 52141.0822 | 52141.0996 | 1506. | 0.550 |
| 14 | B0060101014 | 52141.1515 | 52141.1690 | 1513. | 0.639 |
| 15 | B0060101015 | 52141.2209 | 52141.2372 | 1408. | 0.728 |
| Orbit | File Identifier | MJD (start) | MJD (end) | Duration (s) | Orbital Phase |
|---|---|---|---|---|---|
| 1 | lb2m01iwq | 55369.5198 | 55369.5247 | 422. | 0.122 |
| 2 | lb2m01iyq | 55369.5563 | 55369.5612 | 422. | 0.166 |
| 3 | lb2m01j0q | 55369.5630 | 55369.5678 | 422. | 0.171 |
| 4 | lb2m01j2q | 55369.5697 | 55369.5746 | 422. | 0.181 |
| Ion | ,aaAssumed atomic abundance and ion fraction, respectively | vedgebbThe projected velocity at the outer edge of the accretion disk. Based on two parameters of the fit, the disk radius and inclination, which only have a weak effect on the line model individually. | ccRadial power law index of disk emissivity | ddGaussian width of narrow line (not resolved for N III) | Narrow | Disk | , | |
|---|---|---|---|---|---|---|---|---|
| (Å) | (km/s) | (km s-1) | Fraction | (M⊙ yr-1) | ||||
| N III | 990 | 9.1(-5),0.3 | 140 | -1.44 | 0.01 | 1.2(-8) | 0.91,4129 | |
| N III | 990 | 9.1(-5),0.3 | 150 | -1.44 | 0.01 | 1.7(-9) | 0.91,4130 | |
| O VI | 1035 | 7(-4),0.1 | 220 | -1.07 | 90 | 0.11 | 1.2(-8) | 1.22,8897 |
| O VI | 1035 | 7(-4),0.1 | 210 | -0.98 | 100 | 0.09 | 6.3(-8) | 1.16,8896 |
| C III | 1175 | 3.3(-4),0.5 | 180 | -0.93 | 140 | 0.11 | 1.2(-8) | 1.10,4434 |
| C III | 1175 | 3.3(-4),0.5 | 190 | -1.02 | 140 | 0.11 | 4.3(-9) | 1.10,4433 |
| O V | 1371 | 7(-4),0.3 | 280 | -1.07 | 50 | 0.10 | 1.2(-8) | 1.14, 8002 |
| O V | 1371 | 7(-4),0.3 | 330 | -1.08 | 50 | 0.10 | 1.6(-8) | 1.12, 8001 |
| Si IV | 1400 | 3.3(-5),0.3 | 250 | -0.92 | 120 | 0.16 | 1.2(-8) | 1.31,12413 |
| Si IV | 1400 | 3.3(-5),0.3 | 240 | -0.82 | 120 | 0.12 | 4.5(-8) | 1.29,12412 |
Note. — Lines with wavelengths were observed with FUSE and lines with were observed with the HST COS.
| E(B-V) | N III | O VI | C III | N V | O V | Si IV | C IV |
|---|---|---|---|---|---|---|---|
| (990Å) | (1035Å) | (1175Å) | (1240Å) | (1371Å) | (1400Å) | (1550Å) | |
| 0.0 | 5.0(-13) | 3.4(-12) | 1.95(-12) | 4.5(-12) | 2.9(-13) | 5.6(-13) | 4.4(-12) |
| 0.1 | 2.3(-12) | 1.3(-11) | 5.6(-12) | 1.2(-11) | 6.7(-13) | 1.3(-12) | 9.3(-12) |
| 0.2 | 1.1(-11) | 5.3(-11) | 1.6(-11) | 3.1(-11) | 1.5(-12) | 2.8(-12) | 1.9(-11) |
| 0.3 | 5.1(-11) | 2.1(-10) | 4.7(-11) | 8.2(-11) | 3.5(-12) | 6.7(-12) | 4.1(-11) |
| 0.4 | 2.4(-10) | 8.3(-10) | 1.4(-10) | 2.1(-10) | 8.1(-12) | 1.4(-11) | 8.6(-11) |
| COSaaCOS and CNO are fluxes based on Raymond (1993) and a distance of 2.8 kpc to Sco X-1, assuming cosmic and CNO processed abundances, respectively | 2.9(-12) | 7.1(-12) | 3.8(-12) | 4.2(-12) | 2.3(-13) | 2.0(-12) | 4.0(-12) |
| CNO | 1.6(-12) | 3.4(-12) | 1.8(-12) | 2.3(-12) | 1.7(-13) | 6.2(-13) | 2.0(-12) |
Note. — Fluxes in the emission lines as observed by FUSE (), the HST COS (O V and Si IV) and the HST GHRS (N V and C IV), and dereddened based on the CCM model (Cardelli, Clayton, & Mathis, 1989).
![[Uncaptioned image]](/html/1407.6790/assets/x1.png)
![[Uncaptioned image]](/html/1407.6790/assets/x2.png)
![[Uncaptioned image]](/html/1407.6790/assets/x3.png)
![[Uncaptioned image]](/html/1407.6790/assets/x4.png)
![[Uncaptioned image]](/html/1407.6790/assets/x5.png)
![[Uncaptioned image]](/html/1407.6790/assets/x6.png)


![[Uncaptioned image]](/html/1407.6790/assets/x18.png)