Raman scattering investigation of the electron-phonon coupling in superconducting Nd(O,F)BiS2
Abstract
We have performed polarized Raman scattering measurements on the newly discovered superconductor Nd(O,F)BiS2 ( K). We observe 2 Raman active modes, with frequencies in accordance with first-principles calculations. One A1g phonon mode at 112.4 cm-1 exhibits a Fano line shape due to electron-phonon coupling. We find a resonance for this mode at 2.45 eV excitation energy. We estimate a 0.68 contribution of this mode to the electron-phonon coupling constant . Our Raman results suggest that the BiS2-based superconductors are possibly phonon-mediated BCS superconductors.
pacs:
74.70.-b, 74.25.nd, 74.25.Kc, 71.38.-kDespite low superconducting (SC) critical temperatures (’s) of 3 K - 10 K in Bi4O4S3 and (La/Nd/Ce/Pr)O0.5F0.5BiS2 Mizuguchi et al. (2012); Singh et al. (2012); T. Yajima, K. Nakano, F. Takeiri, T. Ono, Y. Hosokoshi, Y. Matsushita, J. Hester, Y. Kobayashi and H. Kageyama (2012); Nagao et al. (2013); Tan et al. (2012); Awana et al. (2013); Deguchi et al. (2013); Xing et al. (2012); Kajitani et al. (2014); Mizuguchi et al. (2014); Selvan et al. (2013), the BiS2-based superconductors are often regarded as possible high-temperature superconductor candidates. Indeed, their square BiS2 layers are quite similar to the CuO2 layers in high- cuprate superconductors Bednorz and Müller (1986) and the FeAs planes in the iron-based superconductors Kamihara et al. (2008). First-principles calculations Wan et al. (2013); Li et al. (2013a) indicate that LaO0.5F0.5BiS2 evolves from a band insulator to a bad metal upon doping. Interestingly, a large electron-phonon coupling constant is predicted, leading to a value of 10.6 K from the Allen-Dynes formula Allen and Dynes (1975); McMillan (1968) that is compatible with experiments, suggesting a phonon-mediated pairing mechanism. Recent angle-resolved photoemission spectroscopy (ARPES) data were also interpreted in terms of the presence of polarons Zeng et al. (2014). However, a neutron scattering work Lee et al. (2013) suggests that the electron-phonon coupling in LaO0.5F0.5BiS2 is weaker than expected and a strong SC paring exceeding the limit of simple phonon mediated scenarios was proposed from upper critical field and magnetoresistance measurements Li et al. (2013b). Consequently, whether phonons are the paring glue for the BiS2-based superconductors is still under debate.
In this paper we use Raman scattering to investigate directly the crystallographic structure and the electron-phonon coupling in Nd(O,F)BiS2 single-crystals. We report 2 Raman active modes, with frequencies in accordance with first-principles calculations. A photon energy resonance at about 2.45 eV for the 112.4 cm-1 phonon mode is observed and assigned to an electronic transition. The asymmetric phonon spectral profile of this mode indicates a strong electron-phonon coupling and suggests that phonons are possibly the paring glue in the BiS2-based superconductors.
The Nd(O,F)BiS2 single-crystals used in our Raman scattering measurements were grown by a flux method with KCl/LiCl as the flux Wang et al. (2014). Energy-dispersive X-ray spectroscopy (EDX) measurements performed on several pieces of samples with K give an averaged composition of Nd0.95±0.02O0.56±0.1F0.44±0.1Bi0.94±0.02S2 Wang et al. (2014). The crystals were cleaved in air to obtain flat surfaces and then quickly transferred into a low-temperature cryostat ST500 (Janis) for the Raman measurements between 5 and 300 K under a working vacuum better than mbar. Raman scattering measurements were performed using Argon-Krypton laser lines in a back-scattering micro-Raman configuration with a triple-grating spectrometer (Horiba Jobin Yvon T64000) equipped with a nitrogen-cooled CCD camera. For resonance Raman investigations different ions gas laser lines (1.8 eV - 2.7 eV, 457.9 - 676.4 nm) were used with a constant power of P = 3 mW. Spectra obtained with different laser lines were corrected for the instrumental spectral response. The beam power was reduced to avoid local heating, and was kept below 3 mW during our measurements at low temperature. In this manuscript, we define and as the directions along the or axes, oriented along the Bi-Bi bounds, while and are defined at 45∘ from the Bi-Bi bounds. The direction corresponds to the -axis perpendicular to the BiS2 planes.
| Sym. | Act. | Exp. | Cal. | Main atom displacements |
|---|---|---|---|---|
| Eu | IR | 41.4 | Nd(xy),Bi(-xy) | |
| Eg | Raman | 43.3 | Bi(xy),S2(xy) | |
| A2u | IR | 59.9 | S2(z) | |
| A1g | Raman | 52.6 | 70.2 | Bi(z) |
| Eg | Raman | 76.0 | Nd(xy) | |
| Eg | Raman | 101.9 | S2(xy) | |
| A1g | Raman | 112.4 | 108.3 | S2(z) |
| A2u | IR | 118.1 | Bi(z),S2(z) | |
| Eu | IR | 120.2 | S2(xy) | |
| Eu | IR | 143.0 | S1(xy) | |
| Eg | Raman | 146.6 | S1(xy) | |
| Eg | Raman | 160.8 | Nd(z) | |
| Eu | IR | 214.1 | O(xy) | |
| B1g | Raman | 259.5 | O(z) | |
| A2u | IR | 274.5 | O(z) | |
| A1g | Raman | 328.5 | S1(z) | |
| Eg | Raman | 396.3 | O(xy) | |
| A2u | IR | 399.2 | O(z) |
S1 in the Bi-S layer; S2 out of the Bi-S layer
The crystal structure of the parent compound NdOBiS2 is characterized by the space group D(P4/nmm). A simple group symmetry analysis E. Coumarou, M. I. Arroyo, J. M. Perez Cato, A. Kirov, C. Candelillas, S. Revanche and H. Chandrasekhar (2003) indicates that the phonon modes at the Brillouin zone (BZ) center decompose into [4A1g+B1g+5Eg]+[4A2u+4Eu]+[A2u+Eu], where the first, second and third terms represent the Raman-active modes, the infrared (IR)-active modes and the acoustic modes, respectively. To estimate the phonon frequencies, we performed first-principles calculations in the non-magnetic phase of the phonon modes at the BZ center in the framework of the density functional perturbation theory (DFPT) S. Baroni, S. de Gironcoli, A. Dal Corso and P. Giannozzi (2001), using the experimental lattice parameters Å and Å for the parent compound Nagao et al. (2013), and the Wyckoff positions Nd 2c, Bi 2c, S 2c, O 2a. We used the Vienna ab initio simulation package (VASP) G. Kresse and J. Furthmüller (1996) with the generalized gradient approximation (GGA) of Perdew-Burke-Ernzerhof J. P. Perdew, K. Burke, and M. Ernzerhof (1996)for the exchange-correlation functions. The projector augmented wave (PAW) P. E. Blöchl (1994) method was employed to describe the electron-ion interactions. A plane wave cutoff energy of 520 eV was used with a uniform Monkhorst-Pack -point mesh for integrations over the BZ. The frequencies and displacements of the phonon modes were derived from the dynamical matrix generated by the DFPT method S. Baroni, S. de Gironcoli, A. Dal Corso and P. Giannozzi (2001). The calculated frequencies, the optical activity of the phonon modes and the main atomic displacements of the Raman-active phonon modes are summarized in Table 1. For the electronic band structure calculations, we performed first-principles calculations of the electronic structure using the full-potential linearized-augmented plane-wave (FP-LAPW) method implemented in WIEN2K package for the real crystal structure of NdO0.5F0.5BiS2. The exchange-correlation potential was treated using the generalized gradient approximation (GGA) based on the Perdew-Burke-Ernzerhof (PBE) approach J. P. Perdew, K. Burke, and M. Ernzerhof (1996). The spin-orbit coupling (SOC) was included as a second variational step self-consistently. The radii of the muffin-tin sphere were 2.30 Bohr for Nd, 2.36 Bohr for Bi, 2.36 Bohr for S and 2.04 Bohr for O. A -point mesh has been utilized in the self-consistent calculations. The truncation of the modulus of the reciprocal lattice vector , which was used for the expansion of the wave functions in the interstitial region, was set to .
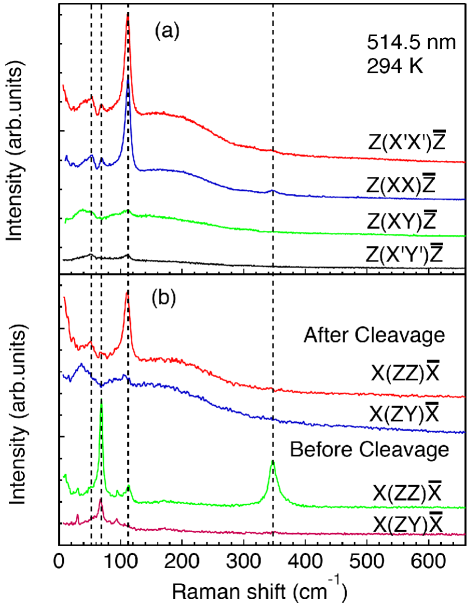
In Fig. 1(a) and 1(b), we show the Raman spectra of Nd(O,F)BiS2 recorded at room temperature under various polarization configurations in the plane and in the plane, respectively. The symmetry of the modes observed are determined by the Raman tensors corresponding to the symmetry group, which are expressed as:
For perfectly aligned crystals, pure A1g symmetry is obtained in the configuration. In this channel, we detect a sharp peak at 112.4 cm-1 and a weak peak at 52.6 cm-1. As summarized in Table 1, they correspond to -axis vibrations of out-of-plane S atoms and Bi atoms, respectively. In Fig.1(a), we also show that these two A1g peaks survive in the and configurations, for which the A1g signal is mixed with signals from the B1g and B2g channels, respectively. In the Eg configuration, we observe a weak peak at 36.5 cm-1, which is also seen in the B2g channel. Although the origin of this mode remains uncertain, it may relate to a Nd3+ crystal-field excitation, the local symmetry of the Nd3+ ions implying different selection rules for such transitions. We also observe a broad hump at 200 cm-1 in the four in-plane polarization configurations as well as in the plane measurements, that we tentatively associate to impurities or inhomogeneity. In addition, two phonon peaks at 68.6 cm-1 and 346.7 cm-1 in the and configurations are observed in samples before cleavage and are attributed to an impurity phase at the surface of the samples.
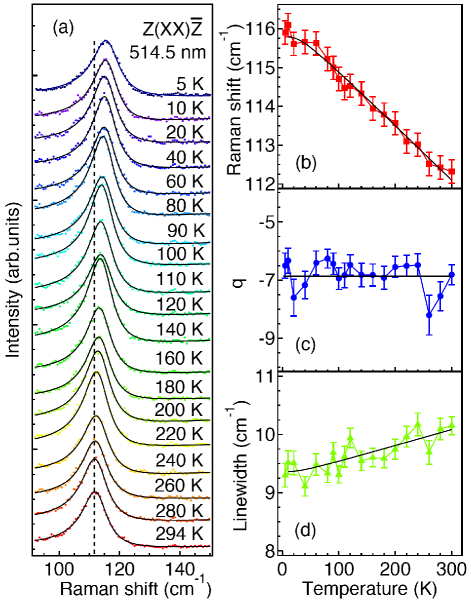
To investigate the possible role of the electron-phonon coupling in the SC transition, we cooled the samples down to 5 K. In Fig. 2(a), we display the temperature dependence of the A1g peaks at 112.4 cm-1. As expected, this peaks become a little harder (3.8 cm-1) and sharper (0.64 cm-1) with temperature decreasing. A remarkable feature is an asymmetric line shape at all temperatures that suggests an electron-phonon coupling in this system. We found that the Breit-Wigner-Fano (BWF) Klein.M.V (1982) resonance line shape (in short Fano resonance line shape) can fit the A1g peak 112.4 cm-1 better than the Lorentzian or Gaussian line shape. The Fano resonance effect originates from a quantum interference between a discrete state (in this case a phonon mode) and an electron continuum, in which the excited eigenstates are a mixture of the discrete and continuum states Fano (1961). The Fano line shape is described by the equation:
| (1) |
where is the intensity, is the renormalized phonon frequency in the presence of the coupling, is the asymmetry parameter, and is the linewidth parameter, which is related to the phonon lifetime. The peak maximum is located at and its full-width at half-maximum (FWHM) is . Usually, is referred to as the coupling strength. In the limit of , the Fano resonance line shape reduces to the Lorentzian line shape.
In Fig. 2(a), we display the BWF fits to the Raman spectra at different temperatures ranging from 5 K to 294 K. In Figs. 2(b)-2(d), we display the fit results of the peak position, asymmetry parameter and the linewidth of the A1g peak at 112.4 cm-1, respectively. The peak position and linewidth can be fit well by Eqs. (2) and (3), which describe the temperature dependences derived from a model with anharmonic phonons decaying into acoustic phonons with the same frequencies and opposite momenta P. G. Klemens (1966); J. Menéndez and M. Cardona (1984):
| (2) |
| (3) |
where is the Boltzmann constant, and are positive constants, is the bare phonon frequency, and is a residual, temperature-independent linewidth. From the fits, we extract cm-1, cm-1, cm-1 and cm-1. The asymmetry parameter recorded in this configuration is nearly independent of temperature and averages to -7.
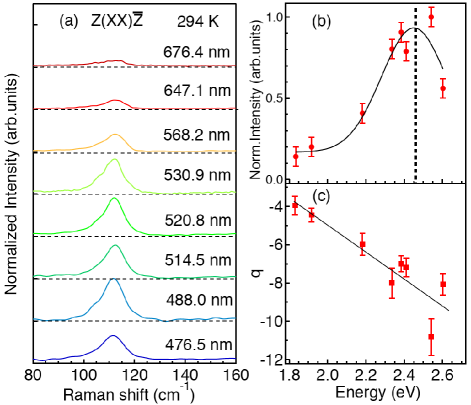
We also studied the 112.4 cm-1 mode using different incident laser energies, as shown in Fig. 3(a). We observe a strong dependence of the Raman intensity as a function of the laser excitation, as illustrated in Fig. 3(b). More precisely, a maximum of intensity is observed for an energy of 2.45 eV (506 nm), as deduced from a Gaussian fit. The intensity at the maximum is about 6 times higher than for a 1.8 eV laser excitation. Interestingly, this resonance energy is quite similar to the plasma frequency determined from optical measurements on the same batch of samples Wang et al. (2014). Based on the 7% doping electron per Bi atom deduced from ARPES data Zeng et al. (2014) also recorded on samples from the same batch, the optical spectra were interpreted in terms of several interband transitions, including one at about 2.1 eV related to O and Bi bands. In any case, the resonance observed here for our Raman data likely has an electronic origin, reinforcing the assumption of an electron-phonon coupling. We also found that the asymmetry parameter decreases almost linearly with the excitantion energy increasing, as shown in Fig. 3(c).
The electron-phonon coupling constant associated to a particular mode can be estimated from the Allen formula Allen and Dynes (1975); Allen (1972), which relates the linewidth of the phonon mode to the dimensionless electron-phonon coupling constant Varma et al. (1991); Rodriguez et al. (1990); Zhou et al. (1993):
| (4) |
where is the electronic density of states at the Fermi level per eV per spin per unit cell, is the mode degeneracy and is the bare frequency in the absence of electron-phonon interaction. In our Raman spectra, the A1g mode at 112.4 cm-1 shows the largest asymmetry line shape, which is relevant in the context of conventional superconductivity. Since the peak position of this mode varies only slightly with temperature, we take the bare frequency as 112.4 cm-1. With for a A1g mode, cm-1 as deduced from Fig. 2(d) and states/eV/spin/unit cell from our band structure calculations of NdO0.5F0.5BiS2, we get , a value close to estimated from calculations Wan et al. (2013); Li et al. (2013a). We caution though that several factors may affect this value in one way or the other. For example, ARPES results Zeng et al. (2014); Ye et al. (2014) suggest that the actual doping level might be smaller than that inferred from the nominal concentration, which would lead to a larger coupling strength. In contrast, our analysis may underestimate the contribution of impurities to the linewidth, which would result in a smaller coupling strenght.
Within the BCS framework, can be estimated Zhou et al. (1993); Kortus et al. (2001a); Shukla et al. (2003) from the experimental and the McMilan relation McMillan (1968) modified by Allen and Dynes Allen and Dynes (1975):
| (5) |
where is the logarithmic average of all the phonon frequencies, is the electron-phonon coupling constant and is the unretarded screened Coulomb interaction. Unfortunately, here our experimental knowledge of the phonon frequencies and their contributions to the electron-phonon coupling constant is very limited. Limiting ourselves to the mode at 112.4 cm-1 and using as commonly used for similar materials Kortus et al. (2001b), we found K, which is similar to the experimental value of 4 K. Although our approximations remain quite rough, our experimental observation of an electron-phonon coupling with a strength compatible with the one expected for a phonon-driven pairing mechanism suggests that Nd(O,F)BiS2 is possibly a conventional superconductor, in agreement with a penetration depth that follows an exponential temperature dependence well below Jiao et al. (2014).
In summary, we have performed polarized Raman scattering measurements on the newly discovered superconductor Nd(O,F)BiS2 ( K). We observe 2 Raman active modes, with frequencies in decent agreement with first-principles calculations. The phonon spectra reveal a photon energy resonance at 2.45 eV and a Fano line shape suggestive of an electron-phonon coupling. Our results suggest that the BiS2 based superconductors are possibly phonon-mediated BCS superconductors.
This work was supported by grants from CAS (2010Y1JB6), MOST (2010CB923000, 2011CBA001000, 2011CBA00101, 2012CB821403 and 2013CB921703) and NSFC (11004232, 11034011/A0402, 11234014 , 11274362 and 11274356) from China.
References
- Mizuguchi et al. (2012) Y. Mizuguchi, H. Fujihisa, Y. Gotoh, K. Suzuki, H. Usui, K. Kuroki, S. Demura, Y. Takano, H. Izawa, and O. Miura, Phys. Rev. B 86, 220510 (2012).
- Singh et al. (2012) S. K. Singh, A. Kumar, B. Gahtori, G. Sharma, S. Patnaik, and V. P. S. Awana, J. Am. Chem. Soc. 134, 16504 (2012).
- T. Yajima, K. Nakano, F. Takeiri, T. Ono, Y. Hosokoshi, Y. Matsushita, J. Hester, Y. Kobayashi and H. Kageyama (2012) T. Yajima, K. Nakano, F. Takeiri, T. Ono, Y. Hosokoshi, Y. Matsushita, J. Hester, Y. Kobayashi and H. Kageyama, J. Phys. Soc. Jpn. 81, 103706 (2012).
- Nagao et al. (2013) M. Nagao, S. Demura, K. Deguchi, A. Miura, S. Watauchi, T. Takei, Y. Takano, N. Kumada, and I. Tanaka, J. Phys. Soc. Jpn. 82, 113701 (2013).
- Tan et al. (2012) S. G. Tan, P. Tong, Y. Liu, W. J. Lu, L. J. Li, B. C. Zhao, and Y. P. Sun, Eur. Phys. J. B 85, 414 (2012).
- Awana et al. (2013) V. Awana, A. Kumar, R. Jha, S. K. Singh, A. Pal, Shruti, J. Saha, and S. Patnaik, Solid State Commun. 157, 21 (2013).
- Deguchi et al. (2013) K. Deguchi, Y. Mizuguchi, S. Demura, H. Hara, T. Watanabe, S. J. Denholme, M. Fujioka, H. Okazaki, T. Ozaki, H. Takeya, T. Yamaguchi, O. Miura, and Y. Takano, Europhys. Lett. 101, 17004 (2013).
- Xing et al. (2012) J. Xing, S. Li, X. Ding, H. Yang, and H.-H. Wen, Phys. Rev. B 86, 214518 (2012).
- Kajitani et al. (2014) J. Kajitani, T. Hiroi, A. Omachi, O. Miura1, and Y. Mizuguchi, arXiv:1404.6361 (2014).
- Mizuguchi et al. (2014) Y. Mizuguchi, T. Hiroi, J. Kajitani, H. Takatsu, H. Kadowaki, and O. Miura, J. Phys. Soc. Jpn. 83, 053704 (2014).
- Selvan et al. (2013) G. K. Selvan, M. Kanagaraj, S. E. Muthu, R. Jha, V. P. S. Awana, and S. Arumugam, Physica Status Solidi RRL 7, 510 (2013).
- Bednorz and Müller (1986) J. G. Bednorz and K. A. Müller, Z. Phys. B 64, 189 (1986).
- Kamihara et al. (2008) Y. Kamihara, T. Watanabe, H. Masahiro, and H. Hideo, J. Am. Chem. Soc. 130, 3296 (2008).
- Wan et al. (2013) X. Wan, H.-C. Ding, S. Y. Savrasov, and C.-G. Duan, Phys. Rev. B 87, 115124 (2013).
- Li et al. (2013a) B. Li, Z. W. Xing, and G. Q. Huang, Europhys. Lett. 101, 47002 (2013a).
- Allen and Dynes (1975) P. B. Allen and R. C. Dynes, Phys. Rev. B 12, 905 (1975).
- McMillan (1968) W. L. McMillan, Phys. Rev. 167, 331 (1968).
- Zeng et al. (2014) L. K. Zeng, X. B. Wang, J. Ma, P. Richard, S. M. Nie, H. M. Weng, N. L. Wang, Z. Wang, T. Qian, and H. Ding, arXiv:1402.1833 (2014).
- Lee et al. (2013) J. Lee, M. B. Stone, A. Huq, T. Yildirim, G. Ehlers, Y. Mizuguchi, O. Miura, Y. Takano, K. Deguchi, S. Demura, and S.-H. Lee, Phys. Rev. B 87, 205134 (2013).
- Li et al. (2013b) S. Li, H. Yang, J. Tao, X. Ding, and H.-H. Wen, Sci. China-Phys. Mech. Astron. 56, 2019 (2013b).
- Wang et al. (2014) X. B. Wang, S. M. Nie, H. P. Wang, P. Zheng, P. Wang, T. Dong, H. M. Weng, and N. L. Wang, arXiv:1406.5851 (2014).
- E. Coumarou, M. I. Arroyo, J. M. Perez Cato, A. Kirov, C. Candelillas, S. Revanche and H. Chandrasekhar (2003) E. Coumarou, M. I. Arroyo, J. M. Perez Cato, A. Kirov, C. Candelillas, S. Revanche and H. Chandrasekhar, Phase Transitions 76, 155 (2003).
- S. Baroni, S. de Gironcoli, A. Dal Corso and P. Giannozzi (2001) S. Baroni, S. de Gironcoli, A. Dal Corso and P. Giannozzi, Rev. Mod. Phys. 73, 515 (2001).
- G. Kresse and J. Furthmüller (1996) G. Kresse and J. Furthmüller, Phys. Rev. B 54, 11169 (1996).
- J. P. Perdew, K. Burke, and M. Ernzerhof (1996) J. P. Perdew, K. Burke, and M. Ernzerhof, Phys. Rev. Lett. 77, 3865 (1996).
- P. E. Blöchl (1994) P. E. Blöchl, Phys. Rev. B 50, 17953 (1994).
- Klein.M.V (1982) Klein.M.V, Light Scattering in Solids,Topics in Applied Physcis 2nd edition (Spinger, 1982).
- Fano (1961) U. Fano, Phys. Rev. 124, 1866 (1961).
- P. G. Klemens (1966) P. G. Klemens, Phys. Rev. 148, 845 (1966).
- J. Menéndez and M. Cardona (1984) J. Menéndez and M. Cardona, Phys. Rev. B 29, 2051 (1984).
- Allen (1972) P. B. Allen, Phys. Rev. B 6, 2577 (1972).
- Varma et al. (1991) C. M. Varma, J. Zaanen, and K. Raghavachari, Science 254, 989 (1991).
- Rodriguez et al. (1990) C. O. Rodriguez, A. I. Liechtenstein, I. I. Mazin, O. Jepsen, O. K. Andersen, and M. Methfessel, Phys. Rev. B 42, 2692 (1990).
- Zhou et al. (1993) P. Zhou, K.-A. Wang, P. C. Eklund, G. Dresselhaus, and M. S. Dresselhaus, Phys. Rev. B 48, 8412 (1993).
- Ye et al. (2014) Z. R. Ye, H. F. Yang, D. W. Shen, J. Jiang, X. H. Niu, D. L. Feng, Y. P. Du, X. G. Wan, J. Z. Liu, X. Y. Zhu, H. H. Wen, and M. H. Jiang, arXiv:1402.2860 (2014).
- Kortus et al. (2001a) J. Kortus, I. I. Mazin, K. D. Belashchenko, V. P. Antropov, and L. L. Boyer, Phys. Rev. Lett. 86, 4656 (2001a).
- Shukla et al. (2003) A. Shukla, M. Calandra, M. d’Astuto, M. Lazzeri, F. Mauri, C. Bellin, M. Krisch, J. Karpinski, S. M. Kazakov, J. Jun, D. Daghero, and K. Parlinski, Phys. Rev. Lett. 90, 095506 (2003).
- Kortus et al. (2001b) J. Kortus, I. I. Mazin, K. D. Belashchenko, V. P. Antropov, and L. L. Boyer, Phys. Rev. Lett. 86, 4656 (2001b).
- Jiao et al. (2014) L. Jiao, Z. F. Weng, J. Z. Liu, J. L. Zhang, G. M. Pang, C. Y. Guo, F. Gao, X. Y. Zhu, H. H. Wen, and H. Q. Yuan, arXiv:1406.6791 (2014).