The Distribution of Satellites Around Central Galaxies in a Cosmological Hydrodynamical Simulation
Abstract
Observations have shown that the spatial distribution of satellite galaxies is not random, but rather is aligned with the major axes of central galaxies (CGs). The strength of the alignment is dependent on the properties of both the satellites and centrals. Theoretical studies using dissipationless -body simulations are limited by their inability to directly predict the shape of CGs. Using hydrodynamical simulations including gas cooling, star formation, and feedback, we carry out a study of galaxy alignment and its dependence on the galaxy properties predicted directly from the simulations.We found that the observed alignment signal is well produced, as is the color dependence: red satellites and red centrals both show stronger alignments than their blue counterparts. The reason for the stronger alignment of red satellites is that most of them stay in the inner region of the dark matter halo where the shape of the CG better traces the dark matter distribution. The dependence of alignment on the color of CGs arises from the halo mass dependence, since the alignment between the shape of the central stellar component and the inner halo increases with halo mass. We also find that the alignment of satellites is most strongly dependent on their metallicity, suggesting that the metallicity of satellites, rather than color, is a better tracer of galaxy alignment on small scales. This could be tested in future observational studies.
Subject headings:
dark matter — galaxies: formation — galaxies: halo — methods: numerical —methods: statistical1. Introduction
Observations over the past decades have clearly shown that satellite galaxies (SGs) are not randomly distributed, but rather are anisotropically distributed around centrals. This characteristic is observed from our Milky Way Galaxy (e.g., Holmberg, 1969; Kroupa et al., 2005), the neighboring M31 (Grebel & Guhathakurta, 1999; Koch & Grebel, 2006; Ibata et al., 2013), to large samples of local galaxies, and even in the Virgo cluster(Lee et al., 2014). In particular, both the results of 2dFGRS and Sloan Digital Sky Survey (SDSS) have shown that satellites are preferentially distributed along the major axes of centrals. This phenomenon is known as galaxy alignment (e.g., Sales & Lambas, 2004; Brainerd, 2005; Yang et al., 2006). The alignment strength also depends on the properties of both the satellites and centrals such that red satellites show stronger alignment with centrals than blue satellites, and red centrals have stronger alignment with their satellites than blue centrals. Such an alignment is also observed for high-redshift galaxies (Wang et al., 2010; Nierenberg et al., 2012).
Several groups have used theoretical arguments and numerical work to explain the origin of this alignment. Studies of the Milky Way and M31 have focused on the nature of the thin disk-like configuration of the satellites (e.g., Kang et al., 2005; Libeskind et al., 2005, 2007; Font et al., 2011; Metz et al., 2007; Libeskind et al., 2012), but debate exists concerning the rareness of such a distribution in the CDM model due to the limited number of satellites and host systems observed (e.g., Bahl & Baumgart, 2014; Ibata et al., 2014). More converged conclusions are reached in the studies of galaxy alignment found in the SDSS survey (e.g., Kang et al., 2007; Faltenbacher et al., 2007; Bailin et al., 2008; Agustsson & Brainerd, 2010; Zhang et al., 2013; Wang et al., 2014a). The preferential distribution of satellites along the major axes of centrals is found to be common in the cold dark matter (CDM) model and arises from the non-spherical nature of dark halos (e.g., Jing & Suto, 2002).
However, most studies so far have used -body simulations where one has to make assumptions about how the shapes of central galaxies (CGs) are related to the shapes of their host halos. In most cases, the predicted alignment signal is larger than observed if the CG shape follows the overall shape of the dark halo. Furthermore, to explain the dependence of alignment on the galaxy properties, one needs to adopt different assumptions for the shape of centrals with blue and red color (Kang et al., 2007; Agustsson & Brainerd, 2010). To directly predict the alignment signal, one should use simulations which can self-consistently model the shapes of the centrals and the distributions of the satellites (rather than the sub-halos).
Wang et al. (2014a) used -body simulations to study the dependence of alignment strength on halo assembly history. Due to the limited resolution and the lack of gas physics, most sub-halos suffered from strong tidal stripping and rarely survived in the central regions of the host halos. In this paper, we will study galaxy alignment using a smoothed-particle-hydrodynamics (SPH) simulation which includes gas cooling, metal recycling, star formation, and supernova feedback. As the stellar component is included, the shape of the CG is properly determined by the physics of gravity. The color of galaxies can be easily obtained from the star formation history and metal evolution from the simulation, using a stellar population synthesis model and an assumed stellar initial mass function. Compared to -body simulations, SPH simulations typically resolve more SGs in the halo center, enabling the study of galaxy alignment on smaller scales. This is because the gas cooling and subsequent star formation results in a more compact mass distribution (than dark matter only simulations) which is better able to survive the strong tidal force in the host halo (Schewtschenko & Macciò, 2011).
There are a few studies which used SPH simulations to explore the galaxy alignment. For example, Libeskind et al. (2007) used high-resolution simulations of nine Milky Way like halos to study the spatial distribution of satellites, but mainly focused on their spatial configuration (polar disk). Deason et al. (2011) have investigated the alignment between the satellites’ positions and CG using zoomed-in simulations, however, they focused on low-mass halos and did not explore the dependence of alignment on satellite properties or compare with the data. Recently, Tenneti et al. (2014) utilized a high-resolution simulations with active galactic nucleus (AGN) feedback, but they only studied the shape correlation between dark matter halos and the stellar component. In this study, we will focus on the galaxy alignment with a dependence on the galaxy properties directly from our simulation, and also compare the model results with observational data (Yang et al. 2006) to understand what is the origin of the observed dependence.
2. The simulation
The cosmological simulation used in this paper was run using the non-public version (including gas physics) of the massive parallel code Gadget-2 (Springel, 2005). It is evolved from redshift to the present epoch in a cubic box of with of dark matter and gas particles, assuming a flat “concordance” cosmology with , , , and . A Plummer softening length of was adopted. Each dark matter particle has a mass of . The initial mass of gas particles is and one gas particle can turn into two star particles later on. The simulation includes the processes of radiative cooling, star formation, supernova feedback, and outflows by galactic winds, as well as a sub-resolution multiphase model for the interstellar medium. The readers are referred to Springel & Hernquist (2003) for more details about the treatment of gas physics.
Dark matter halos were found using the standard friends-of-friends (FoF) algorithm with a linking length of 0.2 times the mean particle separation, while the ‘galaxies’ were defined as the stellar FoF groups with a linking length of (c.f. Jiang et al., 2008). The CG was identified as the most massive galaxy (in stars) in the FoF halo; we call the other galaxies in the halo SGs. To ensure the accurate determination of the shape of centrals and to exclude spurious satellites, only those centrals and satellites with more than and star particles, respectively, are included in our sample.
For each star particle, we record its formation time and the metallicity ([Fe/H]) of the cold gas at that time. The luminosity of each star particle at is calculated using the stellar population synthesis model of Bruzual & Charlot (2003) assuming the initial mass function from Chabrier (2003). The sum of all the stellar particles gives the total luminosity of each galaxy. In our simulation, we calculate the magnitudes in the SDSS and bands.
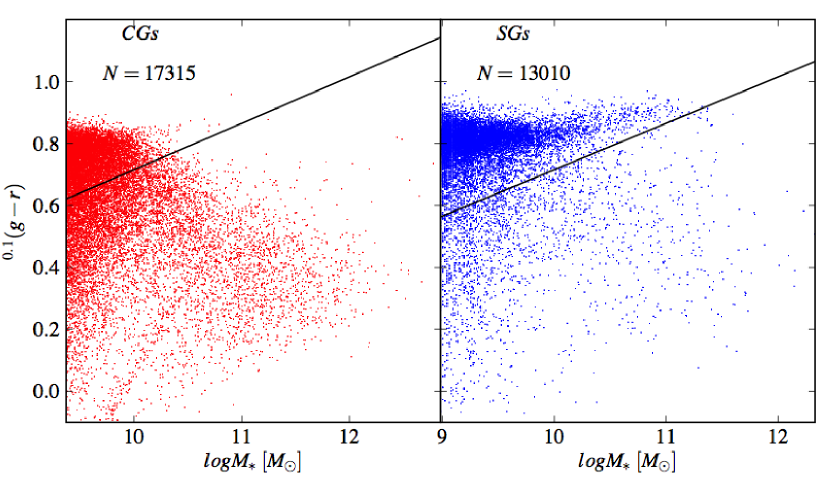
Figure 1 shows the predicted color-stellar mass diagram from our simulation. The left and right panels are for the centrals and satellites, respectively. Here, is the galaxy color using filters redshifted to and computed from using the method described in Yang et al. (2006). Here we do not apply any dust extinction to the model galaxies. The solid line is the fit to the SDSS data by van den Bosch et al. (2008) which divides galaxies into red and blue. Compared to observations, the massive centrals in the simulation are too blue. This is a well-known problem of galaxy formation models; without additional feedback, the gas cooling and star formation in massive halos is too efficient, resulting in massive centrals that are too blue (e.g., Saro et al., 2006). With the inclusion of AGN feedback, the galaxy stellar masses and colors in massive halos can be reproduced (Vogelsberger et al., 2013).
The right panel shows that the majority of satellites in our simulation are red. It is known that the main mechanisms for halting star formation in satellites are ram-pressure stripping and the intrinsic starvation by star formation using up the available gas, both of which are included in our simulations.
Yang et al. (2006) studied the dependence of galaxy alignment on color. They simply adopted to divide galaxies into red and blue. In fact, it is more reasonable that the division between red and blue galaxies is stellar mass dependent (e.g., Baldry et al. 2006; van den Bosch et al.2008; Kang & van den Bosch 2008). Thus, in our work, we divide the galaxies into red and blue using the fitting line of van den Bosch et al. (2008; the solid line in Figure 1).
3. Results
To compare with the data more consistently, we measure the alignment signal in projection. We project the model galaxies along one axis of the simulation box and obtain the reduced inertia tensor of CGs from their stellar particles with where is the position of the th stellar particle in the halo center coordinates and . The eigenvectors of define the orientation of the galaxy, and with this form of the inertia tensor the major axis corresponds to the vector with the large eigenvalue. The angle () is defined as the angle on the projection plane between the off-center vector of the satellite position and the major axis of the CG. The distribution probability of is defined as where and are the number of central-satellite pairs in the simulation sample and random samples. An alignment is found if is less than . The bootstrapping method is used to derive by randomly selecting 100 sub-samples from the overall data.
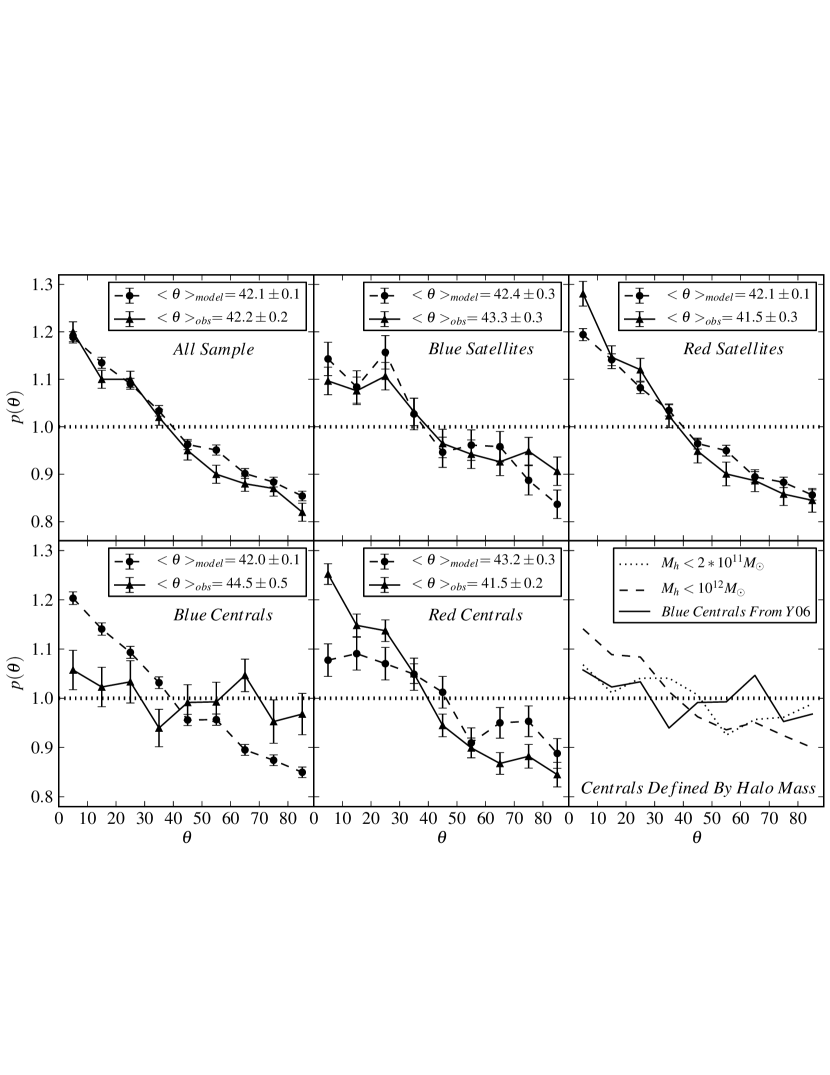
The predicted alignment and comparisons with data are shown in Figure 2. The triangles with solid lines are the observational results of Yang et al. (2006) and model results are plotted with circles connected by dashed lines. The upper left panel shows that the predicted alignment effect for all galaxies agrees well with the data. For satellites, the model predictions roughly agree with the data, but slightly overpredict the alignment for blue satellites and underpredict the alignment for red satellites. However, the predicted alignment for centrals is inconsistent with the data. The lower left and middle panels show that the blue centrals have stronger alignment than the red ones, contrary to the observed dependence on color.
As seen in Figure 1 and the discussion above, there are too many massive blue galaxies in our simulation due to absence of an effective quenching mechanism in massive haloes (such as AGN feedback). It is commonly believed that these massive galaxies should be red and exist in massive halos. Both theoretical and observational works suggest that there should be a critical halo mass below which most of the centrals are blue, and above which most are red (Yang et al., 2008; Kereš et al., 2005). However, this critical halo mass is not well determined, ranging from (e.g., Kereš et al., 2005) to (e.g., Cattaneo et al., 2008). To simply illustrate this effect, in the lower right panel, we show the predicted alignment for blue centrals that have a halo mass less than , where (dotted line) and (dashed line). It is found that the predicted alignment for blue centrals is close to the data with , and it increases with increasing critical halo mass. To avoid overlapping, we do not plot the lines for red centrals whose halo mass are larger than . The results are close to the observational one and the lines for the two critical mass are almost identical, since massive halos have more satellites than low-mass halos and thus dominate the signal.
The exercise presented in the lower right panel of Figure 2 suggests that the observed alignment dependence on CG color is mainly determined by the host halo mass. Later, we will see that the halo mass dependence is rooted in the correlation between the shapes of the CG and the host halo.
In Figure 3, we further show the dependence of alignment on galaxy properties (metallicity, color, stellar mass, and halo mass) from the simulation. The solid and dashed lines are for the centrals and satellites, respectively. The upper panels show that the satellite alignment depends on the metallicity and color, with a stronger dependence on metallicity for which metal-rich satellites have very strong alignment. The lower left panel shows that the dependence on stellar mass is weak and fainter satellites have slightly weaker alignment, in broad agreement with the finding in Y06. Note that the error-bar for the point at the greatest mass bin is large due to the small number statistics. The halo mass dependence in the lower right panel is close to the dependence from the data – there is stronger alignment in more massive halos, which is also consistent with the dependence on stellar mass for centrals in the left panel.
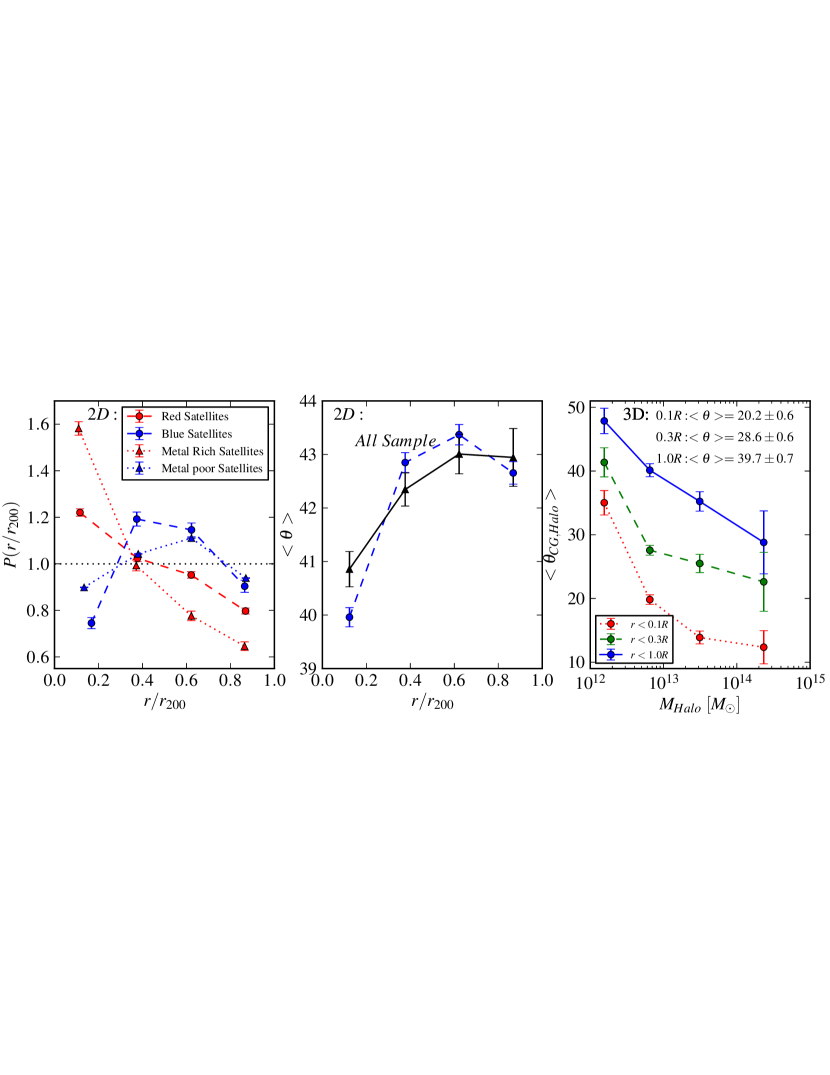
In addition to the dependence of galaxy alignment on color, observations have shown that the alignment angle is a strong function of radial distance to the centrals (Brainerd, 2005; Yang et al., 2006). In the left panel of Figure 4, we show the radial spatial distribution of satellites in the dark halo, together with the dependence on color and metallicty. It is found that both metal-rich (top 30% by order ranking) and red satellites are distributed predominately in the central halo. In general, this distribution agrees with the observational facts that galaxy properties, such as color, metallicity, or morphology, depend strongly on environment/local density (e.g., Wang et al. 2014b and reference therein). Such trends are expected since metal recycling and star formation quenching are more efficient in the inner halo (Weinmann et al., 2010). The middle panel in Figure 4 shows the alignment of satellites as a function of the radius. The observational results of Y06 are shown with triangles and a solid line, which show that satellites residing in the inner halo have stronger alignment with the CG than their counterparts residing in the outer halo. Our simulation results (blue circles and dashed line) are in good agreement with these observations.
To understand the origin of satellite alignment with respect to the CG, theoretical work using -body simulations often assumed that the shape of the CG follows the shape of the overall dark matter halo. However, this assumption leads to a stronger alignment than observed (e.g., Kang et al., 2007). To decrease the predicted signal, one has to introduce some degree of mis-alignment between the CG and that of the dark matter halo (Kang et al., 2007; Agustsson & Brainerd, 2010). A more physical solution is that the CG follows the shape of dark matter in the central region. This model is better at reproducing the alignment (Faltenbacher et al., 2009; Wang et al., 2014a), however, the dependence on galaxy color has not been reproduced.
As our SPH simulation includes the stellar component, we can directly predict the shape of the CG and test the assumption. The right panel of Figure 4 shows the average alignment angle between the major axis of the CG and the shape of the dark matter halo as a function of the halo mass. Results are shown for halo shapes calculated within three radii: for the “whole halo” inside of (blue solid), the “intermediate halo” inside of (green dashed), and the “inner halo” inside of (red dotted). Here, is the spherically averaged virial radius. It is found that the shape of the CG better traces that of the inner halo, and this alignment increases with halo mass. The mean mis-alignment angle varies from for halos with a mass of . Similar results are also found in recent work (e.g, Tenneti et al., 2014).
The results in Figure 4 clearly explain the observed galaxy alignment dependence on galaxy properties. The most metal rich and reddest satellites are distributed in the inner region of the host halo, and their spatial distribution should closely follow that of dark matter. On the other hand, the stellar component of centrals is also greatly shaped by the gravitational force of the dark matter in the inner halo. The combination of these two effects leads to a better alignment for the metal-rich/red satellites than their metal-poor/blue counterparts. As to the dependence on color of centrals, this is related to the halo mass of the centrals – bluer centrals most likely reside in relatively lower-mass halos where the alignment between the central stellar component and the inner halo shape becomes weaker.
4. Conclusion and Discussion
In this Letter, we carry out a study of galaxy alignment using a cosmological simulation including gas cooling, star formation, and supernova feedback, which enables a direct prediction for the shape of CGs and the galaxy properties. We find that the predicted alignment between the CG and the distribution of satellites agrees with the observations. Furthermore, with a simple assumption about the halo mass of blue and red centrals, the dependence on color for both centrals and satellites is also reproduced. We also identify that the strongest dependence of the alignment is with metallicity of satellites, which should be testable using future data.
The main source of galaxy alignment is the non-spherical nature of CDM halos, as shown by many previous studies (e.g., Agustsson & Brainerd, 2006a, b; Kang et al., 2007). However, the predicted strength of the alignment is too strong if the shape of the CG follows the overall shape of the dark matter halo. From our study, we find that the shape of the CG better follows the halo in the inner region, and the average mis-alignment is about (see Figure 4), similar to the expected or inferred values in previous studies (e.g., Wang et al., 2008; Faltenbacher et al., 2009). As the most red/metal-rich satellites stay in the inner halo, they naturally follow the shape of the dark matter halo in that region. This leads to a strong alignment between red satellites with centrals. Furthermore, as the alignment between the CG and inner halo increases with halo mass and red centrals predominately populate massive halos, it explained the observed fact that red central shows stronger alignment with satellites than blue centrals. Although the prediction for the alignment of blue centrals using our simulation fails because of the too blue colors of the most massive central galaxies, the exercises for the alignment dependence on halo mass have given hints that simulations with AGN feedback (e.g., Vogelsberger et al., 2013; Tenneti et al., 2014) should be helpful to solve this problem.
The non-spherical nature of dark matter halos is one the most prominent features of structure formation in a CDM universe, as the mass accretion and mergers predominately occur along the cosmic web or the filament (e.g., Wang et al., 2005). It also naturally produces the galaxy alignment on very large scales up to (Li et al., 2013). Accurate predictions for galaxy alignment on large scales is crucial to cosmological applications, such as estimating the systematic error used in weak lensing measurements. With the proper modeling of galaxy shapes from hydrodynamical simulation, we will be able to make predictions for galaxy alignment on large scales in a forthcoming paper.
References
- Agustsson & Brainerd (2006a) Agustsson, I., & Brainerd, T. G. 2006a, ApJ, 650, 550
- Agustsson & Brainerd (2006b) Agustsson, I., & Brainerd, T. G. 2006b, ApJL, 644, L25
- Agustsson & Brainerd (2010) Agustsson, I., & Brainerd, T. G. 2010, ApJ, 709, 1321
- Bahl & Baumgart (2014) Bahl, H., Baumgardt, H., 2014, MNRAS, 438, 2916
- Bailin et al. (2008) Bailin, J., Power, C., Norberg, P., et al., 2008, MNRAS, 390, 1133
- Baldry et al. (2006) Baldry, I.K., Balogh, M.L., Bower, R.G., et al., 2006, MNRAS, 373, 469
- Brainerd (2005) Brainerd, T. G. 2005, ApJL, 628, L101
- Bruzual & Charlot (2003) Bruzual, G., & Charlot, S. 2003, MNRAS, 344, 1000
- Cattaneo et al. (2008) Cattaneo, A., Dekel, A., Faber, S. M., & Guiderdoni, B. 2008, MNRAS, 389, 567
- Chabrier (2003) Chabrier, G., 2003, PASP, 115, 763
- Deason et al. (2011) Deason, A. J., McCarthy, I. G., Font, A. S., et al. 2011, MNRAS, 415, 2607
- Faltenbacher et al. (2007) Faltenbacher, A., Li, C., Mao, S., et al. 2007, ApJL, 662, L71
- Faltenbacher et al. (2009) Faltenbacher, A., Li, C., White, S. D. M., et al. 2009, RAA, 9, 41
- Font et al. (2011) Font, A. S., McCarthy, I. G., Crain, R.A., et al., 2011, MNRAS, 416, 2802
- Grebel & Guhathakurta (1999) Grebel, E.K., & Guhathakurta, P., 1999, ApJL, 511, L101
- Holmberg (1969) Holmberg, E. 1969, ArA, 5, 305
- Ibata et al. (2014) Ibata, R., Ibata, N. G., Lewis, G. F., et al. 2014, ApJ, 784, 6
- Ibata et al. (2013) Ibata, R., et al., 2013, Nature, 493, 62
- Jiang et al. (2008) Jiang, C.Y., Jing, Y.P., Faltenbacher, A., et al., 2008, ApJ, 675, 1095
- Jing & Suto (2002) Jing, Y. P., & Suto, Y. 2002, ApJ, 574, 538
- Kang et al. (2005) Kang, X., Mao, S., Gao, L., & Jing, Y.P., 2005, å, 437, 383
- Kang et al. (2008) Kang, X. & van den Bosch, F. C., 2008, ApJL, L101
- Kang et al. (2007) Kang, X., van den Bosch, F. C., Yang, X., et al. 2007, MNRAS, 378, 1531
- Kereš et al. (2005) Kereš, D., Katz, N., Weinberg, D. H., & Davé, R. 2005, MNRAS, 363, 2
- Koch & Grebel (2006) Koch, A., & Grebel, E.K., 2006, AJ, 131, 1405
- Kroupa et al. (2005) Kroupa, P., Theis, C., & Boily, C. M., 2005, MNRAS, 431, 507
- Lee et al. (2014) Lee, J., Rey, S.-C., & Kim, S. 2014, ApJ, 791, 15 (arXiv:1406.5250)
- Libeskind et al. (2007) Libeskind, N.I., Cole, S., Frenk, C.S., Okamoto, T., & Jenkins, A., 2007, MNRAS, 374, 16
- Libeskind et al. (2005) Libeskind, N.I., Frenk, C. S., Cole, S., et al., 2005, MNRAS, 363, 146
- Libeskind et al. (2012) Libeskind, N. I., Hoffman, Y., Knebe, A., et al. 2012, MNRAS, 421, L137
- Li et al. (2013) Li, C., Jing, Y. P., Faltenbacher, A., & Wang, J. 2013, ApJL, 770, L12
- Metz et al. (2007) Metz, M., Kroupa, P., & Jerjen, H., 2007, MNRAS, 374, 1125
- Nierenberg et al. (2012) Nierenberg, A. M., Auger, M. W., Treu, T., et al., 2012, ApJ, 752, 19
- Sales & Lambas (2004) Sales, L., & Lambas, D. G. 2004, MNRAS, 348, 1236
- Saro et al. (2006) Saro, A., Borgani, S., Tornatore, L., et al., 2006, MNRAS, 337, 397
- Schewtschenko & Macciò (2011) Schewtschenko, J. A., Macciò, A. V., 2011, MNRAS, 413, 878
- Springel (2005) Springel, V., 2005, MNRAS, 364, 1105
- Springel & Hernquist (2003) Springel, V., & Hernquist, L., 2003, MNRAS, 339, 312
- Tenneti et al. (2014) Tenneti, A., Mandelbaum, R., Di Matteo, T., et al., 2014, MNRAS, 441, 470
- van den Bosch et al. (2008) van den Bosch, F. C., Aquino, D., Yang, X.H., et al. 2008, MNRAS, 387, 79
- Vogelsberger et al. (2013) Vogelsberger, M., Genel, S., Sijacki, D., et al., 2013, MNRAS, 436, 3031
- Wang et al. (2005) Wang, H. Y., Jing, Y. P., Mao, S., & Kang, X. 2005, MNRAS, 364, 424
- Wang et al. (2014a) Wang, O. Y., Lin, W.P., Kang, X., et al., 2014a, ApJ, 786, 8
- Wang et al. (2014b) Wang W., Sales, L., Henriques B., & White S.D.M., 2014b, MNRAS, 442, 1363
- Wang et al. (2010) Wang, Y., Park, C., Hwang, H. S., & Chen, X. 2010, ApJ, 718, 762
- Wang et al. (2008) Wang, Y., Yang, X., Mo, H. J., et al. 2008, MNRAS, 385, 1511
- Weinmann et al. (2010) Weinmann, S. M., Kauffmann, G., von der Linden, A. & De Lucia, G., 2010, MNRAS, 406, 2249
- Yang et al. (2008) Yang, X., Mo, H.J., & van den Bosch, F.C., 2008, ApJ, 676, 248
- Yang et al. (2006) Yang, X., van den Bosch, F. C., Mo, H. J., et al. 2006, MNRAS, 369, 1293 (Y06)
- Zhang et al. (2013) Zhang, Y., Yang, X., Wang, H., et al. 2013, ApJ, 779, 160