Highly directed emission from self-assembled quantum dots into guided modes in disordered photonic crystal waveguides
Abstract
We explore the dynamics and directionality of spontaneous emission from self-assembled In(Ga)As quantum dots into TE-polarised guided modes in GaAs two-dimensional photonic crystal waveguides. The local group velocity of the guided waveguide mode is probed, with values as low as measured close to the slow-light band edge. By performing complementary continuous wave and time-resolved measurements with detection along, and perpendicular to the waveguide axis we probe the fraction of emission into the waveguide mode (-factor). For dots randomly positioned within the unit cell of the photonic crystal waveguide our results show that the emission rate varies from close to the slow-light band edge to within the two-dimensional photonic bandgap. We measure an average Purcell-factor of for dots randomly distributed within the waveguide and maximum values of close to the slow light band edge. Spatially resolved measurements performed by exciting dots at a well controlled distance from the waveguide facet highlight the impact of disorder on the slow-light dispersion. Although disorder broadens the spectral width of the slow light region of the waveguide dispersion from to , we find that emission is nevertheless primarily directed into propagating waveguide modes. The ability to control the rate and directionality of emission from isolated quantum emitters by placing them in a tailored photonic environment provides much promise for the use of slow-light phenomena to realise efficient single photon sources for quantum optics in a highly integrated setting.
I Introduction
Many of the existing proposals for optically based quantum information technologies rely on the availability of efficient sources of single photons Knill et al. (2001); Claudon et al. (2010); Reimer et al. (2012) and the ability to enhance the strength of light-matter interactions to a level where few photon non-linearities appear in the optical response O’Brien et al. (2009). To date, such quantum optical non-linearities have been demonstrated for several free-space and cavity-QED systems including atoms in high finesse optical resonators Turchette et al. (1995); Nogues et al. (1999), semiconductor quantum dots (QDs) embedded within high-Q (Q = quality factor) solid state nano-cavities Englund et al. (2007); Fushman et al. (2008); Englund et al. (2010); Volz et al. (2012); Englund et al. (2012) and individual dye molecules subject to polychromatic excitation Hwang et al. (2009). In the light of these impressive demonstrations, several groups have already turned their attention to integrated geometries Honjo et al. (2004); Takesue and Inoue (2005); O’Brien et al. (2009) whereby cavities, waveguides and quantum emitters can be combined on the same chip to realise new types of quantum sources Muñoz et al. (2014). High- photonic crystal (PhC) defect cavities can be readily fabricated next to waveguides to effectively direct quantum light into propagating modes on a chip Yao and Hughes (2009). However, in-situ frequency control is required to tune the QD-emitter and cavity mode into resonance. In contrast, a broadband spontaneous emission rate enhancement can be achieved using PhC waveguides close to the low group velocity (slow light) regions of the dispersion relation for TE-guided modes Rao and Hughes (2007a); Hughes (2004); Viasnoff-Schwoob et al. (2005); Lecamp et al. (2007); Vlasov et al. (2005) with measured coupling efficiencies of the emission to the waveguide mode approaching unity Lund-Hansen et al. (2008); Thyrrestrup et al. (2010); Dewhurst et al. (2010); Ba Hoang et al. (2012). Moreover, a recent theoretical proposal Gao et al. (2008) has indicated that the enhanced light-matter interaction close to slow light modes in PhC waveguides may become sufficiently strong such as to result in single photon non-linearities. However, the low group velocity region of the propagating mode is inevitably impacted by disorder effects that can result in Anderson localisation close to bandedges Gao et al. (2013); Savona (2011); Huisman et al. (2012); Lagendijk et al. (2009), potentially hindering the practical use of slow-light phenomena.
In this paper we combine continuous wave (CW) and time-resolved photoluminescence (PL) spectroscopy to probe the coupling of QDs randomly distributed throughout a PhC W1 waveguide to the TE-polarised guided modes. We measure the local group velocity at specific points within the waveguide dispersion, obtaining values as low as close to the bandedge. This enables us to directly correlate the measured local spontaneous emission rate with the spectrum of the radiation detected along two orthogonal axes; parallel to the waveguide axis and normal to the plane of the two-dimensional (2D) PhC. Our results show that the average spontaneous emission rate varies from for dots emitting close to the slow-light region of the waveguide dispersion to within the 2D photonic bandgap. For dots randomly positioned within the unit cell of the PhC waveguide we measure a position averaged Purcell-factor up to and spontaneous emission coupling factors into the guided waveguide mode up to . Finally, spatially resolved measurements directly elucidate the impact of fabrication disorder on the slow light edge of the dispersion relation. We observe pronounced optical localisation for random positions along the photonic crystal waveguide. The slow light waveguide mode band edge is fluctuating over an energy interval due to the presence of disorder.
II Fabrication & Experimental Setup
The sample investigated was grown using molecular beam epitaxy on a thick [100] GaAs wafer. Growth began with a thick sacrificial layer of Al0.8Ga0.2As grown on a GaAs buffer, followed by an thick nominally undoped GaAs waveguide that contained a single layer of In0.5Ga0.5As QDs at its midpoint. The growth conditions used for the QD layer are known to produce dots with an areal density m-2, emitting over the spectral range . After growth, a hexagonal lattice of air holes was defined in a ZEP -A soft mask and deeply etched using a SiCl4 based inductively coupled plasma to form a 2D PhC. By omitting a single row of air holes in the PhC lattice we established a waveguide that was subsequently cleaved to gain optical access via the side facet. As a final step the AlGaAs layer was selectively removed with hydrofluoric acid to establish a free standing membrane.
After fabrication the sample was cooled to in a liquid He flow-cryostat for optical studies using a two-axis confocal microscope that facilitates the study of the optical response both perpendicular and parallel to the sample surface. The QDs were excited with a pulsed laser diode emitting at ( repetition frequency, pulse duration, Pico Quant, model P-650) along an axis normal to the plane of the waveguide. The signal was detected either via the same objective (NA), perpendicular to the plane of the PhC and waveguide axis, or from the side along the waveguide axis using a second (NA) objective. The diameter of the excitation spot was measured to be such that QDs are excited directly. We spectrally dispersed the QD emission using a imaging monochromator and detected with a liquid nitrogen cooled CCD camera. For time-resolved measurements a Si-avalanche photodiode was used, providing a temporal resolution of .
Figure 1 (a) shows selected scanning electron microscope (SEM) images of a structure that is nominally identical to the one used for optical studies.
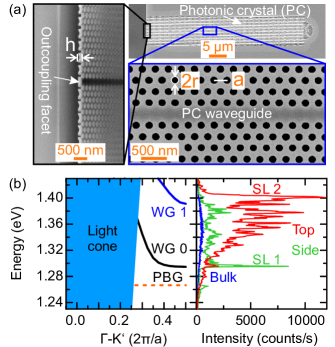
From such SEM images we determined the air hole radius to be , where is the nominal periodicity of the PhC, the slab thickness and the waveguide length . Using the extracted geometrical parameters and the refractive index for GaAs of , we performed three-dimensional calculations of the photonic bandstructure RSoft . Selected examples of such calculations are presented in the leftmost panel of Fig. 1 (b) that shows the dispersion for TE-like modes along the - direction in the first Brillouin zone Johnson et al. (2000); Dorfner et al. (2008). The fundamental () and first () order waveguide modes are labelled 0 (black line) and 1 (blue line), respectively, while the light blue shaded region marks the light cone and the orange dashed line marks the position of the edge of the 2D photonic bandgap. Clearly, the fundamental waveguide mode is expected to be guided in the spectral range , below the light-line and the order waveguide mode from , within the 2D photonic bandgap.
The rightmost panel of Fig. 1 (b) shows typical QD PL spectra recorded by exciting a specific position on the waveguide from the cleaved facet and detecting emission either from the facet (green spectrum), or normal to the plane of the waveguide at the excitation position (red spectrum). The blue spectrum shows a typical emission spectrum recorded using nominally identical conditions from the unprocessed region of the sample, with a near featureless form reflecting the comparatively large number of QDs excited. In contrast, the spectra recorded from the waveguide exhibit a narrow peak close to the slow light region of the fundamental waveguide mode at , labelled in Fig. 1 (b). The energy of the peak is in excellent agreement with our photonic bandstructure simulations and the feature is observed for both top- and side- detection geometries. Similarly, a weaker additional feature, labelled in Fig. 1 (b), is observed only for the top detection geometry at . We identify as arising from the order waveguide mode, its absence in the side detection geometry is most probably a result of the higher propagation losses of the higher energy waveguide mode. The characteristic form of the emission spectrum clearly indicates that the tailored photonic mode density experienced by QDs strongly modifies the directionality of the spontaneous emission, as expected.
III Results and Discussion
In this section we present a detailed study of the modified quantum dot emission properties, the decreased group velocity and the impact of disorder on the slow light cut-off energy. To gain insight into the quantum dot emission dynamics we performed time-resolved PL measurements to directly probe the local photonic mode density experienced by the dots within the waveguide. The modified photonic mode density is expected to strongly influence the radiative decay rate according to the effective Purcell factor which is given by:
| (1) |
where is the effective mode area and the local group velocity of the waveguide mode Rao and Hughes (2007a). The enhanced density of propagating modes close to the slow light regions of the waveguide dispersion are expected to influence the directionality of the spontaneous emission. We measured the frequency dependence of the spontaneous emission rate spanning the energy range between and , overlapping with the 2D photonic bandgap and the waveguide modes. Hereby, we used the spectrometer as a spectral filter with a bandpass of and recorded decay transients in steps of via the waveguide facet with the excitation laser positioned on the waveguide away from the facet.
Typical intrinsic decay rates for QDs within the unpatterned region of the GaAs membrane lie in the range , increasing monotonically toward higher emission energies presumably as a consequence of the large coherence volume in more strongly confined dots. In strong contrast, the spectral evolution of the measured emission rate from dots within the waveguide exhibits considerably more complex decay dynamics with a much richer spectral dependance. Typical representative data are presented in Fig. 2 (a) for the excitation spot positioned from the waveguide facet and a range of different detection energies; - outside the photonic bandgap (blue trace - Fig. 2 (a)), - within the photonic bandgap below the slow light region of the waveguide dispersion (green trace - Fig. 2 (a)), - at the slow light edge of the fundamental waveguide mode dispersion (red trace - Fig. 2 (a)) and - close to the guided, fast light region of the fundamental waveguide dispersion (black trace - Fig. 2 (a)). Careful examination of the data presented in Fig. 2 shows that all decay transients can be well described by either mono- or bi-exponential fits of the form , respectively ( for mono-exponential fits).
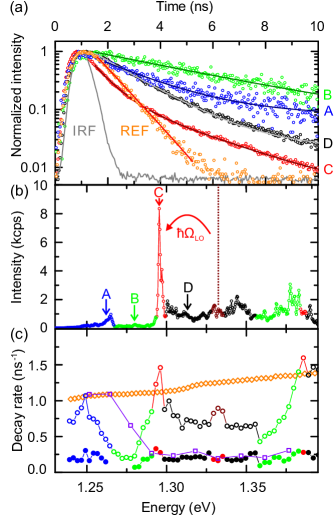
We now continue to discuss the form of these decay transients: Resonant with the slab mode continuum () we observe a bi-exponential decay from which we obtain a fast decay rate of and a slow component . Inside the photonic bandgap (), however, we measure a mono-exponential decay and observe a significant decrease of the spontaneous emission rate to . In contrast, resonant with the slow light region of the fundamental waveguide mode () we clearly observe again a bi-exponential decay transient with a fast component and a slow component . Finally, in the fast guided mode regime () we also find that a bi-exponential transient best accounts for the observed dynamics, extracting a fast decay rate of and a slow decay rate . The corresponding -PL spectrum recorded from the side whilst exciting via the top is plotted in figure Fig. 2 (b) for comparison. In Fig. 2 (c), we present the extracted QD spontaneous emission decay rate as a function of energy between and in steps of . The open orange diamonds represent reference data obtained from dots outside a tailored photonic environment and the color coded circles show the various decay rates measured from the W1 PhC waveguide. Whenever biexponential decay transients were observed we plot the high and low decay rates in Fig. 2 (c) by open and filled circles, respectively. By comparing the measured QD decay rate inside the waveguide at the slow light edge at with the reference decay rates in the unpatterned region of the sample at the same energy, we determine average Purcell-factors between for dots randomly positioned within the PhC unit cell, in good accord with expectations in the literature Laucht et al. (2012a). For the order waveguide mode, we observe a qualitatively similar behaviour, however, far less pronounced, which we attribute to the lower group index as compared to the fundamental mode. Besides the maximum in the decay rate at the slow light edge of the fundamental mode at , another weak peak is observed at . The energy separation between these two features is very close to the GaAs longitudinal optical phonon energy (), indicative of a phonon assisted QD-decay mechanism via the slow light mode Hohenester et al. (2009). To estimate the fraction of photons coupled to the PhC waveguide mode (-factor), we also measured the spontaneous emission rate for emission into the photonic bandgap. The result is presented by the purple squares in Fig. 2 (c) showing that typical decay rates for dots emitting into the photonic bandgap are . From the QD decay rates at the slow light edge and the rates of QDs emitting into the photonic bandgap at the same energy we estimated the single mode spontaneous emission coupling factor using
| (2) |
Here, is the QD decay rate into WG modes and is the intrinsic emission decay rate in the photonic bandgap Laucht et al. (2012b). Using the measured values of and , we estimate , in good agreement with previously published work Laucht et al. (2012b); Lecamp et al. (2007); Rao and Hughes (2007b); Thyrrestrup et al. (2010).
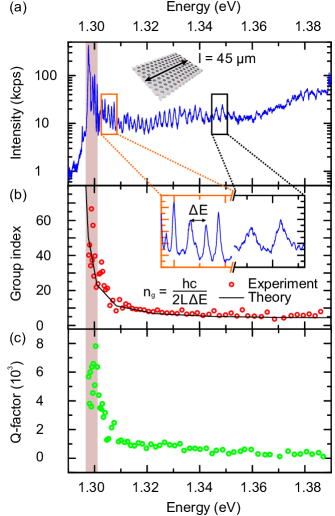
Purcell factors up to have been theoretically predicted to be within reach for a group index as high as , corresponding to wave vectors close to the slow light region of the waveguide mode () Rao and Hughes (2007b). However, in experiments an ideal spatial location of the emitter within the extended unit cell of the waveguide is crucial to reach these large values of Rao and Hughes (2007b). In order to estimate the expected Purcell factor of an ideally coupled QD emitting at we measured the group index of the propagating waveguide mode Ba Hoang et al. (2012) in PL measurements. Therefore, we excited with a high pump fluence (m2), far above the QD s-shell saturation. Under such excitation conditions, the finite length of the PhC waveguide () results in the appearance of clear Fabry-Perot oscillations in the waveguide emission. The local spacing of neighbouring Fabry-Perot maxima are , where is the mode group index and is the length of the PhC waveguide. In figure Fig. 3 (a) we present a typical high-power -PL spectrum, detected from the side facet while exciting from the top away from the facet. Fabry-Perot oscillations are clearly observed with a continuous reduction of the mode spacing (from down to ) when approaching the slow light edge (red shaded region) from the high energy side, reflecting the smaller group velocity when approaching the bandedge Ba Hoang et al. (2012). From the data presented in Fig. 3 we calculated the group index using
| (3) |
In Fig. 3 (b) we present the extracted group index as function of energy. The group index clearly rises from to when approaching the slow light edge of 0. From this we conclude that photons at the slow light edge propagate along the waveguide at only of the speed of light in vacuum. The calculated values extracted from the Fabry-Perot resonances are in very good agreement with the theoretical values obtained from the photonic bandstructure simulation (solid black line) confirming the accuracy of these simulations. Simultaneously, the Q-factor of the Fabry-Perot resonances increases from a few hundred in the fast light region of the waveguide dispersion up to close to the slow light edge as shown in Fig. 3 (c), reflecting the enhanced WG losses when approaching the light line.
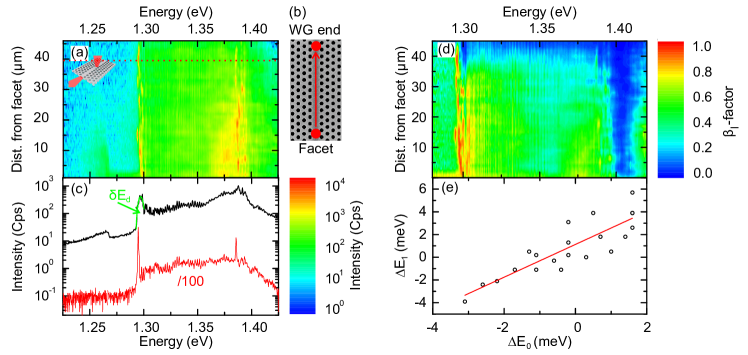
We continue to explore the impact of disorder on the guided modes close to the slow light edge of the waveguide mode. Fig. 4 (a) shows a false colour image of PL spectra detected from the side facet when moving the excitation spot along the waveguide axis from the facet in steps of (see Fig. 4 (b)). The spectra obtained clearly reveal a series of localised modes close to the slow light edge , the energy at which fluctuations occur as the excitation spot is shifted along the waveguide. We identify such features as being due to disorder induced localised modes close to the slow light edge Gao et al. (2013); Savona (2011). We note that the disorder induced cavity mode Q-factors ( to ) seem mainly to be limited by the in-plane optical confinement since photons still couple primarily to propagating waveguide modes, as demonstrated by the fact that we observe them most prominently in the side detection geometry. To quantitatively estimate the impact of disorder on the slow light cut-off energy, we compare in figure Fig. 4 (c) the averaged spectrum of all positions shown in Fig. 4 (a) (black curve) with a single spectrum detected from the side when exciting away from the facet (red curve). For an individual spectrum we observe a sharp resonance close to the energy of the slow light edge at , similar in form to many of the spectra at different positions along the waveguide. In strong contrast, in the position averaged spectrum we observe a broadened peak at with a full width at half maximum (FWHM) . This disorder bandwidth provides a measure of fabrication imperfections along the complete length of the PhC waveguide. Furthermore, we investigated the impact of disorder on the -factor by recording both side and top detection signals simultaneously. We excite at a position distant from the facet (data not shown) and define a quantity :
| (4) |
where and are the PL intensities detected from the side and top, respectively, and and are collection efficiencies in these two detection geometries. We assume and remain constant during the experiment and obtain . Using this result we obtain -factor using Eqn. 4 and plot the result in Fig. 4 (d). We observe a region around with -factors as high as which we identify to be the slow light region of 0. Along the complete waveguide we identify spatially localised hot spots with remarkably high -values, demonstrating that those spatial positions can be used to efficiently in-couple light into propagating waveguide modes. In the fast-guided region of the fundamental-mode we observe moderate -factors of , which slightly decrease as the excitation spot moves away from the facet (green region on Fig. 4 (d)). In contrast, we identify decreased -factors of close to 1 around which we attribute to the pronounced losses due to scattering into out-of-plane modes above the light line. Finally, we investigate if the influence of structural disorder impacts simultaneously both waveguide modes. Therefore, we define the energetic separation () of a disorder induced localized state with respect to its according average () for the () order mode. In Fig. 4 (d) we plot as a function of for selected disorder induced states distributed along the waveguide. We observe a strong correlation which is reflected by the linear fit and the Pearson-product-moment correlation coefficient is . However, the slope of indicates that the fabrication induced disorder has a larger impact on the order mode than on the fundamental mode.
IV Conclusions
In summary, we explored the radiative coupling of InGaAs QDs to the modified photonic environment of and order guided modes in PhC linear waveguides. The modified density of states in the PhC waveguide was found to have a strong influence on the directionality and rate of spontaneous emission. Average Purcell-factors up to , -factors and group indices up to were observed at specific locations along the waveguide axis. Moreover, the impact of disorder on the slow light mode was evidenced by the observation of localised cavity modes randomly positioned along the WG axis with a frequency close to the slow light mode. Here, disorder induced localisation resulted in high-Q modes that fluctuate with an energy bandwidth of around the slow light bandedge with -factors up to . Nevertheless, the most efficient radiative loss channel for the localised cavity modes was found to be radiation into propagating waveguide modes. Our results demonstrate that slow light phenomena can be exploited for future integrated quantum circuits but that design tolerances must be able to account for the disorder induced localisation and, thereby, mechanisms to tune the local electronic and photonic properties would still be needed.
Acknowledgements.
Many thanks to V. Savona and M. Minkov for useful discussions and we gratefully acknowledge financial support from the DFG via SFB- and the German excellence initiative via the Nanosystems Initiative Munich, the BMBF via project 16KIS0110, part of the Q.com-Halbleiter consortium and BaCaTeC via the project Integrated Quantum Optics. T.R. additionally acknowledges support of the TUM-GS.References
- Knill et al. (2001) E. Knill, R. Laflamme, and G. J. Milburn, Nature 409, 46 (2001).
- Claudon et al. (2010) J. Claudon, J. Bleuse, N. S. Malik, M. Bazin, P. Jaffrennou, N. Gregersen, C. Sauvan, P. Lalanne, and J.-M. Gérard, Nature Photonics 4, 174 (2010).
- Reimer et al. (2012) M. E. Reimer, G. Bulgarini, N. Akopian, M. Hocevar, M. B. Bavinck, M. A. Verheijen, E. P. Bakkers, L. P. Kouwenhoven, and V. Zwiller, Nature communications 3, 737 (2012).
- O’Brien et al. (2009) J. L. O’Brien, A. Furusawa, and J. Vučković, Nature Photonics 3, 687 (2009).
- Turchette et al. (1995) Q. A. Turchette, C. Hood, W. Lange, H. Mabuchi, and H. J. Kimble, Physical Review Letters 75, 4710 (1995).
- Nogues et al. (1999) G. Nogues, A. Rauschenbeutel, S. Osnaghi, M. Brune, J. Raimond, and S. Haroche, Nature 400, 239 (1999).
- Englund et al. (2007) D. Englund, A. Faraon, I. Fushman, N. Stoltz, P. Petroff, and J. Vučković, Nature 450, 857 (2007).
- Fushman et al. (2008) I. Fushman, D. Englund, A. Faraon, N. Stoltz, P. Petroff, and J. Vučković, Science 320, 769 (2008).
- Englund et al. (2010) D. Englund, B. Shields, K. Rivoire, F. Hatami, J. Vuckovic, H. Park, and M. D. Lukin, Nano letters 10, 3922 (2010).
- Volz et al. (2012) T. Volz, A. Reinhard, M. Winger, A. Badolato, K. J. Hennessy, E. L. Hu, and A. Imamoğlu, Nature Photonics 6, 605 (2012).
- Englund et al. (2012) D. Englund, A. Majumdar, M. Bajcsy, A. Faraon, P. Petroff, and J. Vučković, Physical review letters 108, 093604 (2012).
- Hwang et al. (2009) J. Hwang, M. Pototschnig, R. Lettow, G. Zumofen, A. Renn, S. Götzinger, and V. Sandoghdar, Nature 460, 76 (2009).
- Honjo et al. (2004) T. Honjo, K. Inoue, and H. Takahashi, Optics letters 29, 2797 (2004).
- Takesue and Inoue (2005) H. Takesue and K. Inoue, Optics express 13, 7832 (2005).
- Muñoz et al. (2014) C. S. Muñoz, E. del Valle, A. G. Tudela, K. Müller, S. Lichtmannecker, M. Kaniber, C. Tejedor, J. Finley, and F. Laussy, Nature Photonics (2014), doi:10.1038/nphoton.2014.114.
- Yao and Hughes (2009) P. Yao and S. Hughes, Physical Review B 80, 165128 (2009).
- Rao and Hughes (2007a) V. M. Rao and S. Hughes, Physical review letters 99, 193901 (2007a).
- Hughes (2004) S. Hughes, Optics letters 29, 2659 (2004).
- Viasnoff-Schwoob et al. (2005) E. Viasnoff-Schwoob, C. Weisbuch, H. Benisty, S. Olivier, S. Varoutsis, I. Robert-Philip, R. Houdré, and C. Smith, Physical review letters 95, 183901 (2005).
- Lecamp et al. (2007) G. Lecamp, P. Lalanne, and J. Hugonin, Physical review letters 99, 023902 (2007).
- Vlasov et al. (2005) Y. A. Vlasov, M. O’Boyle, H. F. Hamann, and S. J. McNab, Nature 438, 65 (2005).
- Lund-Hansen et al. (2008) T. Lund-Hansen, S. Stobbe, B. Julsgaard, H. Thyrrestrup, T. Sünner, M. Kamp, A. Forchel, and P. Lodahl, Physical review letters 101, 113903 (2008).
- Thyrrestrup et al. (2010) H. Thyrrestrup, L. Sapienza, and P. Lodahl, Applied Physics Letters 96, 231106 (2010).
- Dewhurst et al. (2010) S. Dewhurst, D. Granados, D. Ellis, A. Bennett, R. Patel, I. Farrer, D. Anderson, G. Jones, D. Ritchie, and A. Shields, Applied Physics Letters 96, 031109 (2010).
- Ba Hoang et al. (2012) T. Ba Hoang, J. Beetz, L. Midolo, M. Skacel, M. Lermer, M. Kamp, S. Hofling, L. Balet, N. Chauvin, and A. Fiore, Applied Physics Letters 100, 061122 (2012).
- Gao et al. (2008) J. Gao, F. Sun, and C. W. Wong, Applied Physics Letters 93, 151108 (2008).
- Gao et al. (2013) J. Gao, S. Combrie, B. Liang, P. Schmitteckert, G. Lehoucq, S. Xavier, X. Xu, K. Busch, D. L. Huffaker, A. De Rossi, et al., Scientific reports 3 (2013), doi:10.1038/srep01994.
- Savona (2011) V. Savona, Physical Review B 83, 085301 (2011).
- Huisman et al. (2012) S. Huisman, G. Ctistis, S. Stobbe, A. Mosk, J. Herek, A. Lagendijk, P. Lodahl, W. Vos, and P. Pinkse, Physical Review B 86, 155154 (2012).
- Lagendijk et al. (2009) A. Lagendijk, B. van Tiggelen, and D. S. Wiersma, Phys. Today 62, 24 (2009).
- (31) RSoft, http://optics.synopsys.com/rsoft/, [Online accessed: 24-July-2014].
- Johnson et al. (2000) S. G. Johnson, P. R. Villeneuve, S. Fan, and J. Joannopoulos, Physical Review B 62, 8212 (2000).
- Dorfner et al. (2008) D. Dorfner, T. Hurlimann, T. Zabel, L. H. Frandsen, G. Abstreiter, and J. Finley, Applied Physics Letters 93, 181103 (2008).
- Laucht et al. (2012a) A. Laucht, T. Günthner, S. Pütz, R. Saive, S. Frederick, N. Hauke, M. Bichler, M.-C. Amann, A. Holleitner, M. Kaniber, and J. Finley, Journal of Applied Physics 112, 093520 (2012a).
- Hohenester et al. (2009) U. Hohenester, A. Laucht, M. Kaniber, N. Hauke, A. Neumann, A. Mohtashami, M. Seliger, M. Bichler, and J. J. Finley, Physical Review B 80, 201311 (2009).
- Laucht et al. (2012b) A. Laucht, S. Pütz, T. Günthner, N. Hauke, R. Saive, S. Frédérick, M. Bichler, M.-C. Amann, A. Holleitner, M. Kaniber, and F. JJ, Physical Review X 2, 011014 (2012b).
- Rao and Hughes (2007b) V. M. Rao and S. Hughes, Physical Review B 75, 205437 (2007b).