Received on XXXXX; revised on XXXXX; accepted on XXXXX
Associate Editor: XXXXXXX
Mass spectrometry based protein identification with accurate statistical significance assignment
Abstract
1 Motivation:
Assigning statistical significance accurately has become increasingly important as meta data of many types, often assembled in hierarchies, are constructed and combined for further biological analyses. Statistical inaccuracy of meta data at any level may propagate to downstream analyses, undermining the validity of scientific conclusions thus drawn. From the perspective of mass spectrometry based proteomics, even though accurate statistics for peptide identification can now be achieved, accurate protein level statistics remain challenging.
2 Results:
We have constructed a protein ID method that combines peptide evidences of a candidate protein based on a rigorous formula derived earlier; in this formula the database -value of every peptide is weighted, prior to the final combination, according to the number of proteins it maps to. We have also shown that this protein ID method provides accurate protein level -value, eliminating the need of using empirical post-processing methods for type-I error control. Using a known protein mixture, we find that this protein ID method, when combined with the Sorić formula, yields accurate values for the proportion of false discoveries. In terms of retrieval efficacy, the results from our method are comparable with other methods tested.
3 Availability:
The source code, implemented in C++ on a linux system, is available for download at
ftp://ftp.ncbi.nlm.nih.gov
/pub/qmbp/qmbp_ms/RAId/RAId_Linux_64Bit
4 Contact:
yyu@ncbi.nlm.nih.govyyu@ncbi.nlm.nih.gov
5 Introduction
Peptide identifications (ID) via mass spectrometry (MS) have become the central component in modern proteomics; this component, combined with additional analyses, routinely yields pragmatic meta data, including protein ID, protein quantification, protein structure and protein associations (Zhang et al., 2013). These meta data, especially the associated statistical significance assignments, need to be as accurate as possible because they often form the building blocks for investigations at the systems biology level and influence the scientific conclusions drawn henceforth. In this paper, we focus on protein ID, in particular on improving the accuracy of statistical significance assigned to proteins identified.
The need for robust developments towards accurate statistical significance assignments has been advocated (Noble and MacCoss, 2012; Huang et al., 2012) despite the existence of many protein ID methods (McHugh and Arthur, 2008; Serang and Noble, 2012; Li and Radivojac, 2012). It has also been suggested (Spirin et al., 2011) that the primary cause of unreliable significance assignment for protein ID can be attributed to inaccurate significance assignment for peptide ID. Frequently used error-control/significance-assigning methods for peptide ID largely fall into two groups: proportion of false discovery (PFD), which is often incorrectly termed as false discovery rate (Benjamini and Hochberg, 1995), and spectrum-specific -value/-value (Fenyo and Beavis, 2003; Alves et al., 2007; Park et al., 2008). Methods belonging to the first group, controlling type-I error globally only, do not discriminate among identified peptides (Elias and Gygi, 2007). Methods belonging to the second group, capable of assigning per-spectrum per-peptide significance, can properly prioritize identified peptides when reported -/-values are accurate; but the needed statistical accuracy is often unattainable due to improper heuristics or unjustifiable distribution assumptions (Alves et al., 2007; Segal, 2008; Spirin et al., 2011).
Given a tandem MS (MS/MS) spectrum and a quality score cutoff , the -value should reflect the expected number of random peptides with scores the same as or better than . (Similarly, the -value reflects the probability of finding a random peptide with quality score .) In general, the -value is obtained by multiplying the -value by the total number of qualified peptides (whose masses fall in the range with being the precursor ion’s mass and the specified tolerance) in the database searched. Thus, besides providing the user with the numbers of false positives to anticipate, accurate -value assignments enable ranking of candidate peptides across different spectra and experiments. In database searches in proteomics, the goal of accurate statistics can be approached in at least two ways. First, one may devise a scoring function whose resulting score distribution can be analytically characterized and thus used to infer the statistical significance (Alves et al., 2007); if this is done correctly, the theoretical score distribution should fit well the bulk part of the normalized score histogram obtained from scoring all qualified peptides in the database of interest. Second, one may infer the spectrum-specific -value via the normalized score histogram obtained from scoring all possible peptides (APP) (Alves and Yu, 2008); in this case, the database dependence appears only in the -value, which is the -value multiplied by the number of qualified peptides associated with the specified precursor ion mass and mass error tolerance. Either way yields database-specific -values. Once a peptide -value is obtained, one may transform it into the peptide database -value (DPV) (Yu et al., 2006; Alves et al., 2008b), representing the likelihood of obtaining, in the database chosen, at least one peptide scoring equal to or better than the prescribed threshold. When combining -values of peptides associated with a candidate protein, we use the peptides’ DPVs.
Specifically, our proposed protein ID method combines peptide evidences of a candidate protein using a rigorous formula derived earlier (Alves and Yu, 2011); in this formula the DPV of every peptide is weighted, prior to the final combination, according to the number of proteins it maps to. Among the existing protein ID methods, the approach taken by Spirin et al. (2011) is closest to ours; both methods combine peptides’ spectrum-specific -values. There are, however, major differences between our method and that of Spirin et al. (2011). First, in our method, each candidate peptide of a query spectrum receives a DPV, allowing multiple matching peptides per spectrum. This is to take into account the possibility of peptide co-elution (Alves et al., 2008a). For the method of Spirin et al. (2011), only the best peptide match per spectrum is considered and the peptide DPV thus represents the probability of having the best match score no worse than the prescribed threshold when searching a database. Since each random protein database only contributes one best match score, searching many random protein databases is required for the -value assignment. Second, the candidate peptides’ -values are combined differently. Our method, down-weighting contributions of peptides mappable to multiple proteins, combines peptide DPVs directly using a rigorous formula (Alves and Yu, 2011); the method of Spirin et al. (2011) first transforms, for every candidate protein, the -values of its associated peptides into -scores, combines them using Stouffer’s formula (Whitlock, 2005), and then transforms the combined -score back to a final -value with multiple hypotheses testing correction. Third, the cutoff conditions for peptides’ -values are different. Our method approximates DPVs (Yu et al., 2006; Alves et al., 2008b) by -values, valid for small -values, and retains all peptides whose -values are less than one. That is, we have a global cutoff condition. For the method of Spirin et al. (2011), the peptide cutoff -value varies by candidate protein: given a candidate protein, its corresponding peptides’ -scores are first sorted in descending order; the th -score is chosen as the cutoff provided that the maximum combined -score is reached while combining the top -scores using the Stouffer’s formula.
There exist many other protein ID methods, for example, ProFound (Zhang and Chait, 2000), ProteinProphet (Nesvizhskii et al., 2003), DBParser (Yang et al., 2004), EBP (Price et al., 2007), PANORAMICS (Feng et al., 2007), PROVALT (McHugh and Arthur, 2008), X!Tandem (Fenyo et al., 2010), Scaffold (Searle, 2010) and npCI (Serang et al., 2013), to name just a few. We refer the readers to recent review papers (Huang et al., 2012; Serang and Noble, 2012) for details and more comprehensive listings of these methods. Although some of them do start with spectrum-specific peptide -values, they often assume certain parametric forms for the peptide score distributions when searching a random database; other methods, however, only process outputs of specific peptide identification tools, limiting their uses to certain platforms. By discarding all but the best few peptide scores per spectrum per database search, the method of Spirin et al. (2011) does not rely on the accuracy of the full peptide score distribution from searching a random database and in principle can accept input from various peptide identification tools. Our method is free from the aforementioned problems for different reasons. Founded on a derived analytical formula, our method can be applied in general and will yield accurate protein -values if the input peptide DPVs (or -values) are accurate. When using peptide -values reported by RAId_DbS, even though the parameters of the score distribution are determined via maximum-likelihood, the functional form of the score distribution is analytically derived (Alves et al., 2007) rather than assumed. When the statistical significances are obtained from RAId_aPS (Alves et al., 2010), for every scoring function implemented, the -values are inferred by scoring APP instead of assuming that the score histogram follows a specific form; the peptide -values are then obtained via multiplying the -values by the respective numbers of qualified peptides.
The paper is organized as follows. The mathematical underpinnings of our formalism will be described in the methods section. In the results section, comparisons of our method with other approaches will be made; the accuracy of the reported protein -value will be illustrated. Some technical but important issues will be addressed in the discussion section. To keep the paper focused, we relegate to supplementary information figures and tables that complement or corroborate the information contained in the main text.
6 Methods
6.1 Statistical Protocols
Weighting the contribution of each peptide in protein identification is important. It helps mitigate the issue of peptide degeneracy, where an identified peptide is a subsequence of multiple database proteins. The optimal weighting scheme, however, can depend on the protein ID methodology employed. For the purpose of our study, namely, devising a method that yields accurate protein -values, we opt for a simple weighting scheme: a peptide’s weight is inversely proportional to the number of database proteins it maps to. Within a sample, when multiple spectral searches identify the same peptide but with different significance levels, only the most significant assignment of that peptide is retained for further analyses.
The foundation of our method is built upon a rigorous formula (Mathai, 1983; Alves and Yu, 2011) that enables weighted combination of -values. When the weights are all identical, this formula reduces to Fisher’s formula (Fisher, 1932; Bahrucha-Reid, 1960); when the weights are all different, this formula reduces to the formula of Good (Good, 1955). A detailed derivation and generalization to incorporating nearly identical weights can be found in (Alves and Yu, 2011), whose notation will be used to briefly summarize the content of the formula.
Let us assume that a given protein contains identified peptides with -values. Let us further group these peptides, according to the number of database proteins a peptide maps to, into groups with . Within each group , the peptide -values are weighted equally; while peptide -values in different groups are weighted differently.
The weighting enters our formalism through the following quantities of interest
| (1) | |||||
| (2) |
where each represents a reported peptide -value, each represents a random variable drawn from an uniform, independent distribution over and each is a positive weight. The quantity of interest , representing the protein -value, was obtained earlier (Alves and Yu, 2011) and is repeated below for clarity.
Let , one may show that
| (3) | |||||
where is the number of proteins a group- peptide maps to, enumerates each set of nonnegative integers that satisfies the -dependent constraint , and the function is defined as
| (4) |
See the supplementary information for an example application of formula (3).
When searching a database with a prescribed peptide mass error tolerance , one often needs to score different numbers of database peptides for spectra with different precursor ion masses. That is, the number of tested hypotheses (database peptides in the mass range ) varies by the precursor ion mass . The effect of varying number of multiple hypotheses tested can be properly accounted for by using the peptide DPVs (Yu et al., 2006; Alves et al., 2008b) for -values () in eq. (1); given a quality score cutoff , the peptide DPV is defined as
| (5) |
where represents the expected number of peptides having score , and the DPV represents the probability of seeing one or more peptides in a given random database with quality scores . Another advantage of using DPV is that as a function of the quality score , the -value , determined by the search score histogram per spectrum and the number of qualified peptides (database-dependent), correctly takes into account both the spectrum-specificity and the database-specificity of scoring statistics.
Since the -value specifies the expected number of random database peptides having scores equal to or better than the given cut-off, a peptide with -value larger than one is more likely to be a false positive than a true positive. For this reason, when constructing the evidence peptide set for identification of a protein, we only include peptides with -values less than one. This implies that only peptide DPVs less than are considered, leading to a combination of truncated -values. Unfortunately, combining truncated -values, even though doable, is far more complicated than using eq. (3). However, two observations simplify the matter. First, it is evident from eq. (5) that the DPV approaches the -value when the -value is small. Second, we note that confidently identified proteins must contain evidence peptides with high identification confidences (or small -values). Therefore, for practical uses, we may approximate the DPV by its corresponding -value. Because only -values less than one are considered, the approximated DPVs (or simply the -values) now encompass the full range between zero and one. Consequently, it is unnecessary to combine truncated -values, and the simple formula (3) becomes applicable. The protein -value is then obtained via multiplying the protein -value by a Bonferroni correction factor; in this case, the Bonferroni factor is the number of protein clusters (described below) each having at least one evidence peptide with -value less than one.
We denote by a protein cluster a group of entangled proteins that share a substantial portion of evidence peptides. To avoid exaggerating the number of identified proteins, several existing methods (Huang et al., 2012) report those entangled proteins as one. Adopting the same idea, we implemented this strategy via a transitive approach described below. One first sorts the identified proteins by the number of identified evidence peptides in descending order and using the rank of a protein in the sorted list as that protein’s cluster index. Starting with the first protein as the reference protein, all other lower-ranking proteins sharing at least of evidence peptides with the first protein will have their cluster indexes changed to that of the reference protein. One then moves the reference point (from the first) to the second protein, all other lower-ranking proteins sharing at least of evidence peptides with the reference protein will have their cluster indexes changed to that of the reference protein. The reference point is then moved to the third protein and the process continues till the reference point moves through all proteins in the list. The protein with most significant -value within a cluster (containing one or more proteins) is called the head of that cluster, the other proteins members of that cluster. An exception to the aforementioned clustering rule, however, is introduced to appropriately emphasize a protein’s evidence peptides that are not shared by other proteins. We call evidence peptides of this kind unique peptides to a protein. When a protein has a unique evidence peptide with -value less than , our method doesn’t allow this protein to be a member protein of any cluster.
6.2 MS/MS Datasets
Sixty-three spectral datasets were categorized into four data groups. See supplementary tables (Table S1 to S4) for details. Protein mixtures giving rise to spectral datasets were reduced with iodoacetamide, resulting in the addition of the carbamidomethyl group (57.07 Da) to cystine residues. Each protein mixture was further digested with trypsin. Among these spectral datasets, there are also dataset-specific parameters such as the target database, the maximum number of missed cleavage sites allowed, the precursor-ion mass error tolerance and the product-ion mass error tolerance. The dataset-specific parameters are given in the figure caption to provide more information underlying the generation of the figures.
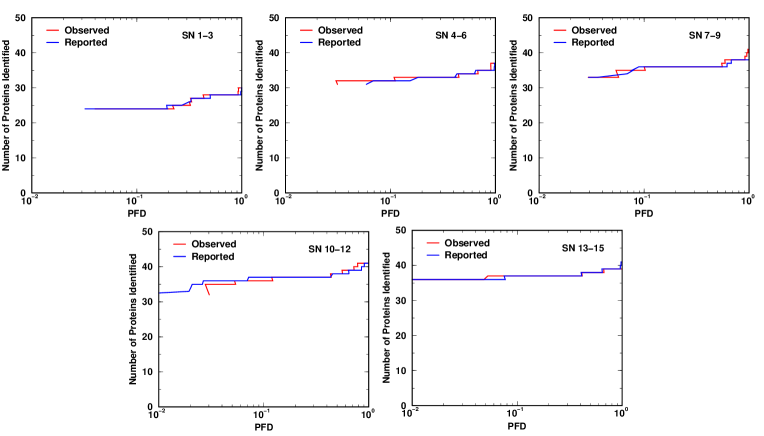
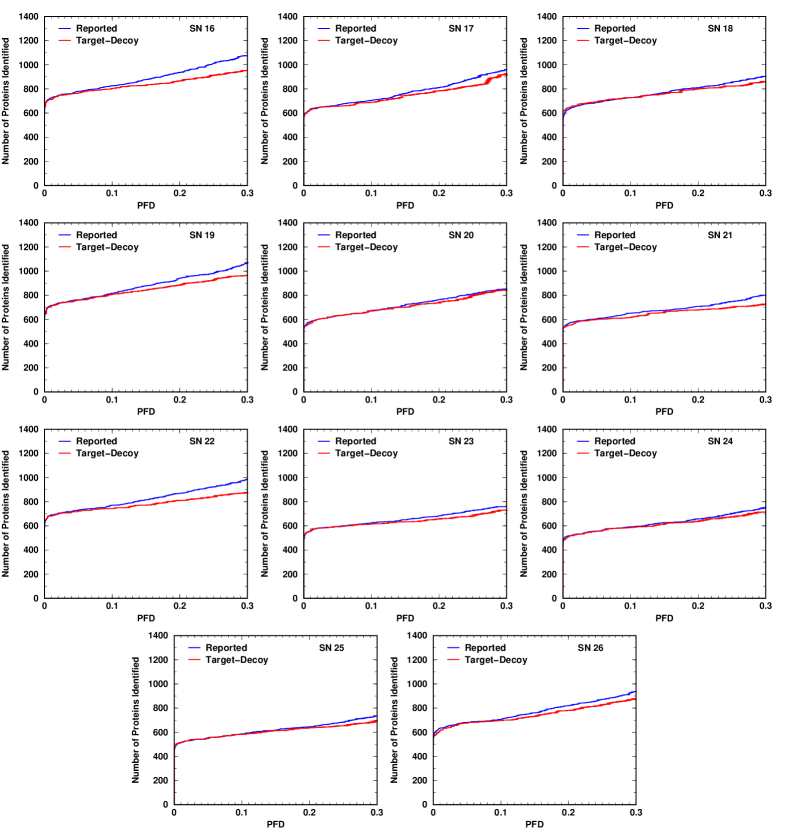
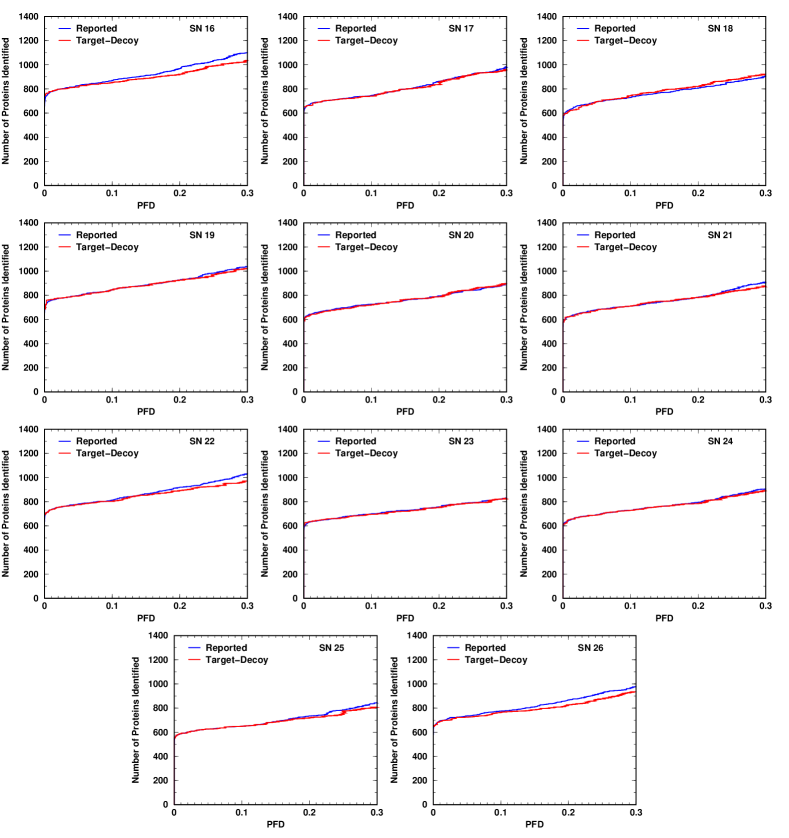
For brevity, we shall denote the MS/MS spectra obtained from a sample by SN followed by its sample index. For example, SN1 denotes the collection of MS/MS spectra acquired from mixture sample one. The first data group, SN1 through SN15, contained MS/MS spectra from replicates of different dilutions of Sigma49, a protein standard mixture composed of 49 know human proteins. The second data group, SN16 through SN26, was downloaded from the Pacific Northwest National Laboratory and contained spectra from eleven whole-cell-lysate samples of protein mixtures of Escherichia coli K-12. The third data group, SN27 through SN30, consisted of spectra from four in-house whole-cell-lysate samples of protein mixtures of Escherichia coli K-12. Downloaded from PeptideAtlas database, the fourth data group (SN31 through SN63) was composed of spectra from SDS-PAGE protein fractionation extractions of human lung cells.
6.3 Protein Databases and Random Databases
Because protein mixtures from Escherichia coli K-12 and Homo sapiens were analyzed using their corresponding MS/MS spectra, protein databases for both organisms were thus required. From UniProt \hrefhttp://www.uniprot.org/downloadshttp://www.uniprot.org/downloads, we downloaded 4,303 non-redundant protein sequences of Escherichia coli K-12. A non-redundant Homo sapiens protein database, containing protein sequences, was obtained from the NCBI site \hrefftp://ftp.ncbi.nlm.nih.gov/refseq/H_sapiens/mRNA_Prot/ftp://ftp.ncbi.nlm.nih.gov/refseq/H_sapiens/mRNA_Prot/.
When analyzing statistical significance, it is often required to have random (decoy) databases in addition to the organismal (target) databases. One common problem when using random databases is that for a given precursor ion mass the numbers of qualified peptides in the random database and in the organismal database may significantly differ. This causes an additional uncertainty in assessing statistical significance (Elias and Gygi, 2007; Wang et al., 2009). We can avoid this problem by ensuring that the numbers of qualified peptides per spectrum are identical for both the random and the organismal databases: for each qualified peptide in the organismal database, we generate a corresponding random peptide by randomly shuffling its amino acids.
7 Results
The results will be described in the following order. First, we illustrate that our -value assignments are accurate at both the peptide and the protein levels. We further show that using the formula proposed by Sorić (1989), our reported PFDs agree well with the target-decoy PFDs. Second, our protein -value accuracy is compared with that of using the formulas in (Spirin et al., 2011). By extending the formula of Sorić for the method of Spirin et al. (2011), we also evaluate the agreement between their reported PFDs and the target-decoy PFDs. Benchmarking with some of the existing protein ID methods will be described in the third part.
7.1 -value accuracy
The input peptide DPVs for our protein ID method are obtained via eq. (5) using the -values reported by RAId_DbS. For this reason, the input peptide DPVs (for protein ID) are synonymous with the reported peptide DPVs (from RAId_DbS). As mentioned earlier, the statistical accuracy of our protein ID method relies on the DPVs for the evidence peptides being accurate. We therefore start by comparing the input peptide DPV with its definition. In panel A of Figure 1, the abscissa records the peptide DPV, while the ordinate displays the observed DPV (i.e., fraction of spectra having at least one or more matching peptides with reported DPVs smaller than the specified threshold). The agreement between the observed DPV and the reported DPV indicates that the peptide DPVs used as input for our protein ID method are accurate.
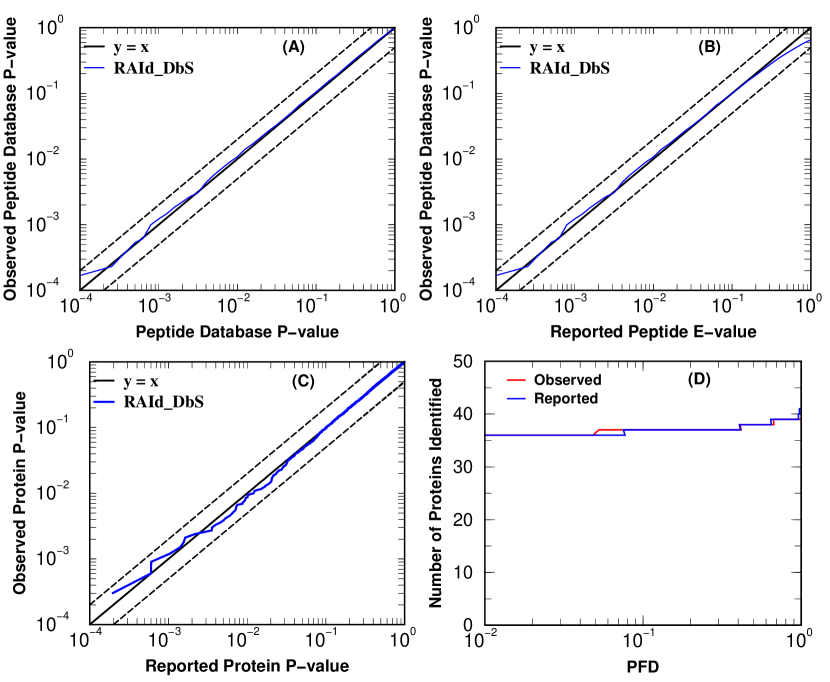
To assess whether approximating peptide DPVs by their corresponding -values for -values less than one is reasonable or not, we plot in panel B of Figure 1 the observed peptide DPVs versus -values. As expected, when -values are close to one, there is certain degree of disagreement; while for small -values, the agreement is excellent. To assess the accuracy of the protein -values reported by our eq. (3), we compare them with the observed protein -values. As described in the method section, the reported proteins appear in clusters, each represented by a head protein and its -value. The observed protein -value is defined as the fraction of identified protein clusters (whose member proteins each containing at least one evidence peptide with -value less than one) that have reported -values smaller than a given threshold. As shown in panel C of Figure 1, good agreement between the reported protein -value and the observed protein -value is obtained, indicating that our reported protein -values are accurate. More protein -value accuracy assessment examples can be found in Supplementary Figures S1, S2, and S3. With an accurate protein -value, one can also obtain its corresponding protein -value by multiplying it by the total number of protein clusters. In Supplementary Figure S4, we show that reported protein -values obtained this way are accurate.
By having accurate protein -values, one can avoid the uncertainty associated with using a decoy database (Gupta et al., 2011) while estimating the proportion of false discoveries. In panel D of Figure 1, we plot two PFD curves: one is computed using the reported protein -value to estimate the number of false identifications (hence the PFD), while the other is computed using the observed PFD obtained from known target protein content in the sample (Sigma49). The excellent agreement between the observed PFD and the reported PFD indicates that one should be able to trust the PFD estimated from accurate reported protein -values. More accuracy assessment examples of the reported PFD can be found in Supplementary Figure S5.
7.2 Comparison with an EVD-based method
Since the method of Spirin et al. (2011) is closest to ours, we also implemented their method and compute equivalent quantities for comparison. Following the Supplementary Material of (Spirin et al., 2011), we have implemented 100 random databases each containing 10,000 random amino acid sequences. However, instead of generating sequences of uneven length, we opt for uniform length (each sequence is of length 350) and generate these random sequences using the background amino acid frequencies of Robinson and Robinson (1991). The EVD parameters are obtained by using only the best score per database search and by applying standard procedures described in (Spirin et al., 2011). The effect of database size difference, leading to rescaling of the parameter, is done the same way as in (Spirin et al., 2011).
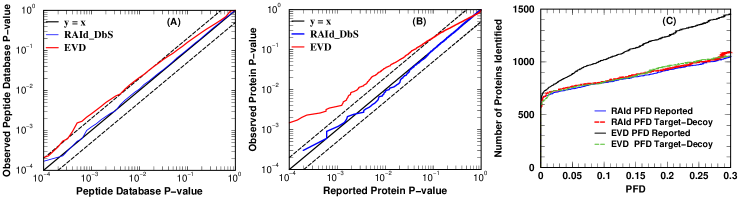
A moment of reflection reveals that the best match -value of (Spirin et al., 2011) is in fact the DPV (Yu et al., 2006; Alves et al., 2008b). We therefore plot in panel A of Figure 2 the reported peptide DPVs against the observed peptide DPVs. The result indicates that the peptide DPV reported by Spirin et al. (2011) is quite accurate, with an uncertainty of a factor of as reported by Spirin et al. (2011).
To have a fair assessment, the same procedure for clustering proteins is also applied to the proteins identified using protocols of Spirin et al. (2011). The observed protein -value is defined similarly. Database proteins that contain any of the best match peptides, one from each spectrum, form the effective protein set. The observed protein -value is simply the fraction of proteins in the effective protein set that have reported protein -values less than the specified threshold. The reported protein -value for the head protein of each cluster is obtained by applying the iterative procedure (involving uses of Stouffer’s formula) described in (Spirin et al., 2011). In panel B of Figure 2, the reported protein -values are plotted against the observed protein -values. The agreement between the reported protein -values and the observed protein -values is not as great as in the peptide case. The protein -value is then obtained by multiplying the protein -value by the total number of proteins in the effective protein set.
To construct a PFD curve, it is necessary to estimate the number of false identifications at a given significance threshold. The number of false identifications can be estimated either by using the reported protein -values or the number of identifications within the decoy databases. The latter is currently widely used mainly because accurate protein -values (or -values) are generally hard to attain. To investigate the agreement between the PFD curves obtained using decoy databases and using reasonably accurate protein -values, we use spectra acquired from dataset SN 26 and construct the PFD curves obtained using both approaches. The good agreement between our -value based PFD (Sorić, 1989) and the target-decoy based PFD, displayed in panel C of Figure 2, is expected because, as shown in panel D of Figure 1, we have already found that the reported PFD and the observed PFD (computed by using a known protein mixture) are nearly identical. The disagreement between the -value based PFD and the target-decoy based PFD using protocols of (Spirin et al., 2011) seems to indicate that the moderate uncertainty in DPV can influence the accuracy of the overall PFD estimate in a substantial manner.
For RAId_DbS, the agreement between our -value based PFD and the target-decoy based PFD is further tested using more spectral datasets (SN16-SN25), see supplementary Figure S6. In addition to RAId score, RAId_aPS allows other scoring functions: XCorr, Hyperscore, and Kscore. For completeness, we plot their corresponding protein -value accuracy assessments in supplementary Figures S7-S9; we also present the agreement tests between their -value based PFDs and the target-decoy based PFDs in supplementary Figures S10-S12.
7.3 Comparison with other methods
The previous two subsections focus on the accuracy of type-I error control. Although it is possible to accurately control type-I error for some protein ID methods, this seems not the central focus of all protein ID methods. Many protein ID methods prefer to use the decoy database search results to pragmatically provide statistical significances for retrieval results from the target (organismal) database. When this approach is used, the retrieval results are displayed in terms of a parametric PFD plot: the parameter is some kind of significance score used to prioritize the identifications, the abscissa shows the proportion of false discovery and the ordinate displays the number of identifications found in the target database. In general, a large number of target identifications at a small PFD value indicates a good retrieval, provided that the number of decoy identifications accurately reflects the number of false identifications in the target database. However, one should note that the fulfillment of the aforementioned condition requires accurate type-I error control. Investigating and improving the statistical accuracy of type-I error control of existing protein ID methods is beyond the scope of this paper and we believe that it is best done by developers of individual protein ID software.
To examine how our method compares with others under the pragmatic target-decoy approach,
we analyze two large datasets from E. Coli (SN 27-30) and Homo Sapiens (SN 31-63) using
a variety of protein ID software along with a number of scoring functions. The list of
software is given below (with both software version
and scoring functions, if given, shown inside a pair of parentheses):
RAId_DbS (v. Jan.12.2014; RAId), RAId_aPS (v. Jan.12.2014; XCorr, Kscore, Hyperscore),
Mascot (v. 2.4.0, http://www.matrixscience.com/help.html),
and X!Tandem (v. 2013.06.15; Hyperscore).
The peptide identification software SEQUEST (Eng et al., 1994) (v. 28) is only used in conjunction with
other post-processing protein ID software.
We list below the post-processing software used
(with software version, peptide ID software,
and peptide scoring functions, if given, shown inside a pair of parentheses):
iProphet (v. TPP 4.5; X!Tandem; Kscore),
Proteome Discoverer (v. 1.3, http://www.thermofisher.com
/en/home.html;
SEQUEST, Mascot),
and Scaffold Q+/Q+S (v. 4.0, http://www.proteomesoftware.com; SEQUEST, Mascot).
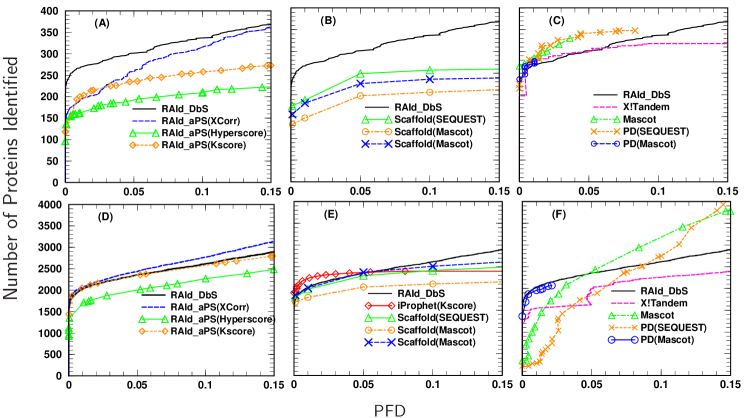
The results are displayed in different panels of Figure 3.
Before delving into the details of the results, we first provide the
information relevant to the generation of the results.
In terms of peptide identification, RAId_DbS, RAId_aPS, Mascot, SEQUEST, and X!Tandem used the same parameters: for Escherichia coli whole cell lysate, SN 27-30, the precursor ion mass error tolerance is 0.033 Da., the product ion mass error tolerance is 0.033 Da., and up to 5 missed cleavages are allowed; for Homo sapiens heart cells, SN 31-63, the precursor ion mass error tolerance is 1.4 Da., the product ion mass error tolerance is 0.4 Da., and up to 2 missed cleavages are allowed.
Both X!Tandem and Mascot have built-in protein ID capability, and the target-decoy approach was directly applied to estimate the protein level PFD. The peptide ID outputs from SEQUEST and Mascot were also further analyzed using Proteome Discoverer for protein identification and the target-decoy approach was applied to estimate PFD. For iProphet, we did not compute the PFD but downloaded the results for data group 4 from PeptideAtlas. Peptide identification in this case was done using X!Tandem (v. 2009.10.01; Kscore).
Whenever the decoy peptide search results are available, Scaffold computes the PFDs using the target-decoy approach; otherwise, it computes the PFDs using a probabilistic method. In Figure 3 three Scaffold PFD curves are displayed, two of which (shown in triangles and circles) are from target-decoy approaches. The protein PFDs under Scaffold were computed by fixing the peptide threshold at 20% PFD with a minimum of 1 evidence peptide per protein. We observed that changing the peptide threshold to lower values had a small effect on the number of proteins identified. We thus used the minimum of 1 peptide per protein to maintain consistency across all methods. For RAId_DbS and RAId_aPS, the PFD estimates do not require user-added target-decoy methods. RAId_DbS and RAId_aPS compute the PFDs using the Sorić formula (Sorić, 1989).
Examinations of different panels of Figure 3 indicates that the retrieval efficacy of the proposed method (shown in RAId_DbS and RAId_aPS PFD curves) is comparable with existing protein ID methods, even though only at the stated values. However, it should be noted that the proposed method does have a few advantages. First, it reports accurate protein -values, providing accurate type-I error control. Second, the PFD curves obtained using this method show stability across different mass resolution requirement and data sets, while some methods seem to exhibit fluctuations of notable amplitudes.
8 Discussion
Our investigation indicates that it is possible to achieve faithful protein -value assignment, hence accurate type-I error control, in protein identifications. Since our approach is founded on a derived mathematical formula that requires accurate peptide -values as input, it is evident that accurate protein -values require accurate statistical significance at the peptide identification level.
The discrepancy between the computed protein -value and the PFD results in our implementation of the method of Spirin et al. (2011) is interesting. Based on the results in Fig. 2, the peptide -values are reasonably accurate albeit exhibiting slightly larger fluctuations than the results from RAId_DbS. In addition to the possibility of accumulating uncertainty of peptides’ -values, the other possibility is that the iterative procedure to choose the combination yielding the most significant Z-score may skew the -values towards the significant side. Investigation of the origin of the PFD and -value discrepancy when using the method of Spirin et al. (2011), however, is beyond the scope of the current study and might be most appropriately done by the authors of (Spirin et al., 2011).
As explained earlier, we allow more than one candidate peptide per spectrum to accommodate the possibility of peptide co-elution. However, readers may ask why do we choose to use DPVs for lower-ranking peptides per spectrum instead of using ordered statistics. The reason is that in this context using ordered statistics beyond the first is not meaningful: the th ordered statistics assumes that for a given query spectrum the best scored peptides are spurious while the rank- peptide is the underlying peptide whose fragmentation yields the query spectrum. This contradicts the general idea of using a scoring function: among candidate peptides of a query spectrum, the better a peptide scores the more likely it is the underlying peptide. On the other hand, when using the DPV for the rank- peptide, we are essentially assuming that the top candidate peptides of the query spectrum are co-eluted underlying peptides and are not considered to be spurious.
The protein identification method proposed in this paper illustrates the possibility of accurate type-I error control, providing a theoretically sound significance assignment method that is also pragmatically simpler than the target-decoy approach. This is particularly important since the number of identified proteins versus PFDs provides trustworthy retrieval results only if the reported PFDs truly reflects the proportion of false discoveries. Evidently, to achieve accurate type-I error control is a task best done by developers of individual software. Only when this is accomplished can a true retrieval comparison among different methods be done.
Since we did not focus on type-II error, there is definite room for improvement in terms of retrieval efficacy. We note that the information of negatives (segments of a candidate protein not covered by the protein’s evidence peptides) is not used. We also believe that, in principle, scoring functions for peptide identification can also be improved to better separate true underlying peptides from false positives. Currently, we are using a flat peptide weight (by the number of proteins a peptide covers). It is perceivable that more sophisticated weighting may be useful in better separating true positive proteins from false positives. It is our plan to investigate these avenues of improvement in the near future.
Acknowledgement
Funding\textcolon
This work was supported by the Intramural Research Program of the National Library of Medicine at the National Institutes of Health.
References
- Alves and Yu (2008) Alves, G. and Yu, Y. K. (2008). Statistical Characterization of a 1D Random Potential Problem - with applications in score statistics of MS-based peptide sequencing. Physica A, 387(26), 6538–6544.
- Alves and Yu (2011) Alves, G. and Yu, Y. K. (2011). Combining independent, weighted P-values: achieving computational stability by a systematic expansion with controllable accuracy. PLoS ONE, 6(8), e22647.
- Alves et al. (2007) Alves, G., Ogurtsov, A. Y., and Yu, Y. K. (2007). RAId_DbS: peptide identification using database searches with realistic statistics. Biol. Direct, 2, 25.
- Alves et al. (2008a) Alves, G., Ogurtsov, A. Y., Kwok, S., Wu, W. W., Wang, G., Shen, R. F., and Yu, Y. K. (2008a). Detection of co-eluted peptides using database search methods. Biol. Direct, 3, 27.
- Alves et al. (2008b) Alves, G., Wu, W. W., Wang, G., Shen, R. F., and Yu, Y. K. (2008b). Enhancing peptide identification confidence by combining search methods. J. Proteome Res., 7(8), 3102–3113.
- Alves et al. (2010) Alves, G., Ogurtsov, A. Y., and Yu, Y. K. (2010). RAId_aPS: MS/MS analysis with multiple scoring functions and spectrum-specific statistics. PLoS ONE, 5(11), e15438.
- Bahrucha-Reid (1960) Bahrucha-Reid, A. (1960). Elements of the Theory of Markov Processes and their Applications. McGraw-Hill.
- Benjamini and Hochberg (1995) Benjamini, Y. and Hochberg, Y. (1995). Controlling the False Discovery Rate: A Practical and Powerful Approach to Multiple Testing. Journal of the Royal Statistical Society. Series B (Methodological), 57(1), 289–300.
- Elias and Gygi (2007) Elias, J. E. and Gygi, S. P. (2007). Target-decoy search strategy for increased confidence in large-scale protein identifications by mass spectrometry. Nat. Methods, 4(3), 207–214.
- Eng et al. (1994) Eng, J. K., McCormack, A. L., and III, J. R. Y. (1994). An approach to correlate tandem mass spectral data of peptides with amino acid sequences in a protein database. Journal of the American Society for Mass Spectrometry, 5(11), 976 – 989.
- Feng et al. (2007) Feng, J., Naiman, D. Q., and Cooper, B. (2007). Probability-based pattern recognition and statistical framework for randomization: modeling tandem mass spectrum/peptide sequence false match frequencies. Bioinformatics, 23(17), 2210–2217.
- Fenyo and Beavis (2003) Fenyo, D. and Beavis, R. C. (2003). A method for assessing the statistical significance of mass spectrometry-based protein identifications using general scoring schemes. Anal. Chem., 75(4), 768–774.
- Fenyo et al. (2010) Fenyo, D., Eriksson, J., and Beavis, R. (2010). Mass spectrometric protein identification using the global proteome machine. Methods Mol. Biol., 673, 189–202.
- Fisher (1932) Fisher, R. A. (1932). Statistical Methods for Research Workers, vol. II. Oliver and Boyd, Edinburgh.
- Good (1955) Good, I. J. (1955). On the weighted combination of significance tests. Journal of the Royal Statistical Society Series B (Methodological), 17, 264–265.
- Gupta et al. (2011) Gupta, N., Bandeira, N., Keich, U., and Pevzner, P. A. (2011). Target-decoy approach and false discovery rate: when things may go wrong. J. Am. Soc. Mass Spectrom., 22(7), 1111–1120.
- Huang et al. (2012) Huang, T., Wang, J., Yu, W., and He, Z. (2012). Protein inference: a review. Briefings in Bioinformatics.
- Li and Radivojac (2012) Li, Y. F. and Radivojac, P. (2012). Computational approaches to protein inference in shotgun proteomics. BMC Bioinformatics, 13 Suppl 16, S4.
- Mathai (1983) Mathai, A. (1983). On linear combinations of independent exponential variables. Communications in Statistics - Theory and Methods, 12(6), 625–632.
- McHugh and Arthur (2008) McHugh, L. and Arthur, J. W. (2008). Computational methods for protein identification from mass spectrometry data. PLoS Comput. Biol., 4(2), e12.
- Nesvizhskii et al. (2003) Nesvizhskii, A. I., Keller, A., Kolker, E., and Aebersold, R. (2003). A statistical model for identifying proteins by tandem mass spectrometry. Anal. Chem., 75(17), 4646–4658.
- Noble and MacCoss (2012) Noble, W. S. and MacCoss, M. J. (2012). Computational and statistical analysis of protein mass spectrometry data. PLoS Comput. Biol., 8(1), e1002296.
- Park et al. (2008) Park, C. Y., Klammer, A. A., Kall, L., MacCoss, M. J., and Noble, W. S. (2008). Rapid and accurate peptide identification from tandem mass spectra. J. Proteome Res., 7(7), 3022–3027.
- Price et al. (2007) Price, T. S., Lucitt, M. B., Wu, W., Austin, D. J., Pizarro, A., Yocum, A. K., Blair, I. A., FitzGerald, G. A., and Grosser, T. (2007). EBP, a program for protein identification using multiple tandem mass spectrometry datasets. Mol. Cell Proteomics, 6(3), 527–536.
- Robinson and Robinson (1991) Robinson, A. B. and Robinson, L. R. (1991). Distribution of glutamine and asparagine residues and their near neighbors in peptides and proteins. Proc. Natl. Acad. Sci. USA, 88, 8880–8884.
- Searle (2010) Searle, B. C. (2010). Scaffold: a bioinformatic tool for validating MS/MS-based proteomic studies. Proteomics, 10(6), 1265–1269.
- Segal (2008) Segal, M. R. (2008). On E-values for tandem MS scoring schemes. Bioinformatics, 24(14), 1652–1653.
- Serang and Noble (2012) Serang, O. and Noble, W. (2012). A review of statistical methods for protein identification using tandem mass spectrometry. Stat Interface, 5(1), 3–20.
- Serang et al. (2013) Serang, O., Paulo, J., Steen, H., and Steen, J. A. (2013). A non-parametric cutout index for robust evaluation of identified proteins. Mol. Cell Proteomics, 12(3), 807–812.
- Shteynberg et al. (2011) Shteynberg, D., Deutsch, E. W., Lam, H., Eng, J. K., Sun, Z., Tasman, N., Mendoza, L., Moritz, R. L., Aebersold, R., and Nesvizhskii, A. I. (2011). iProphet: multi-level integrative analysis of shotgun proteomic data improves peptide and protein identification rates and error estimates. Mol. Cell Proteomics, 10(12), M111.007690.
- Sorić (1989) Sorić, B. (1989). Statistical “discoveries” and effect-size estimation. Journal of the American Statistical Association, 84(406), 608–610.
- Spirin et al. (2011) Spirin, V., Shpunt, A., Seebacher, J., Gentzel, M., Shevchenko, A., Gygi, S., and Sunyaev, S. (2011). Assigning spectrum-specific P-values to protein identifications by mass spectrometry. Bioinformatics, 27(8), 1128–1134.
- Wang et al. (2009) Wang, G., Wu, W. W., Zhang, Z., Masilamani, S., and Shen, R. F. (2009). Decoy methods for assessing false positives and false discovery rates in shotgun proteomics. Anal. Chem., 81(1), 146–159.
- Whitlock (2005) Whitlock, M. C. (2005). Combining probability from independent tests: the weighted Z-method is superior to Fisher’s approach. J. Evol. Biol., 18(5), 1368–1373.
- Yang et al. (2004) Yang, X., Dondeti, V., Dezube, R., Maynard, D. M., Geer, L. Y., Epstein, J., Chen, X., Markey, S. P., and Kowalak, J. A. (2004). DBParser: web-based software for shotgun proteomic data analyses. J. Proteome Res., 3(5), 1002–1008.
- Yu et al. (2006) Yu, Y. K., Gertz, E. M., Agarwala, R., Schaffer, A. A., and Altschul, S. F. (2006). Retrieval accuracy, statistical significance and compositional similarity in protein sequence database searches. Nucleic Acids Res., 34(20), 5966–5973.
- Zhang and Chait (2000) Zhang, W. and Chait, B. T. (2000). ProFound: an expert system for protein identification using mass spectrometric peptide mapping information. Anal. Chem., 72(11), 2482–2489.
- Zhang et al. (2013) Zhang, Y., Fonslow, B. R., Shan, B., Baek, M. C., and Yates, J. R. (2013). Protein analysis by shotgun/bottom-up proteomics. Chem. Rev., 113(4), 2343–2394.
Supplementary Information
Example application of formula (3) of the main text
To illustrate the use of the formula used to compute a protein -value, let us consider the following toy example. Let protein have six peptide evidences that falls into three groups , , and , respectively with weights , , . This means that peptide is a subsequence of protein only, peptides and are subsequences of three proteins ( and two others), and peptides , , and are subsequences of two proteins ( and another one). Let the peptide -values of these six evidence peptides be , all less than one. Under our approximating database -value by -value, this means that the evidence peptides have their respective database -values . From the information above we know that , , , , , , , , , and .
To use formula (3) in the manuscript to compute a protein -value, we first need the quantity given by eq. (1) in the main text. In the current case– , , , and with peptides database -values – the quantity can be written as
And the protein -value is given by
| (6) |
where is given by
Remember that enumerates each set of nonnegative integers that satisfies the -dependent constraint , it is thus possible to replace the in eq. (6) by an -dimensional summation with an explicit constraint. Specifically, we can rewrite the sum over set as
| (7) | |||||
where the Kronecker delta function takes value one if but zero otherwise.
The first product on the right hand side of eq. (7) is equal to
After this overall factor is obtained, the main task is to evaluate the summation over , which ranges from to . For each , we are only interested in the non-negative integral s that satisfy the -dependent constraint . When we have and the constrained summation
only allows one valid {} set, namely, {0,0,0}. For we have and the constrained summation
allows three sets of valid {}, namely, {1,0,0}, {0,1,0} and {0,0,1}. For we have and the constrained summation
allows six sets of valid {}, namely, {1,1,0}, {1,0,1}, {0,1,1}, {2,0,0}, {0,2,0} and {0,0,2}. Each valid set of must be substituted into the summand (inside the pair of curly braces) of eq. (7) to yield its respective contribution for the -value.
Supplementary Tables
| SN | Sample Load | Instrument | CGL(minutes) | File Name | |
|---|---|---|---|---|---|
| 1 | 5 fmol | LTQ Orbitrap | 45 | 1,531 | PSM1027_07FEB15_ABRF_FT_5a.mzXML |
| 2 | 5 fmol | LTQ Orbitrap | 45 | 1,902 | PSM1028_07FEB15_ABRF_FT_5b.mzXML |
| 3 | 5 fmol | LTQ Orbitrap | 45 | 2,014 | PSM1029_07FEB15_ABRF_FT_5c.mzXML |
| 4 | 10 fmol | LTQ Orbitrap | 45 | 2,026 | PSM1027_07FEB15_ABRF_FT_10a.mzXM |
| 5 | 10 fmol | LTQ Orbitrap | 45 | 2,125 | PSM1028_07FEB15_ABRF_FT_10b.mzXML |
| 6 | 10 fmol | LTQ Orbitrap | 45 | 2,253 | PSM1029_07FEB15_ABRF_FT_10c.mzXML |
| 7 | 25 fmol | LTQ Orbitrap | 45 | 2,772 | PSM1027_07FEB15_ABRF_FT_25a.mzXML |
| 8 | 25 fmol | LTQ Orbitrap | 45 | 2,669 | PSM1028_07FEB15_ABRF_FT_25b.mzXML |
| 9 | 25 fmol | LTQ Orbitrap | 45 | 2,504 | PSM1029_07FEB15_ABRF_FT_25c.mzXML |
| 10 | 50 fmol | LTQ Orbitrap | 45 | 3,259 | PSM1027_07FEB15_ABRF_FT_50a.mzXML |
| 11 | 50 fmol | LTQ Orbitrap | 45 | 3,406 | PSM1028_07FEB15_ABRF_FT_50b.mzXML |
| 12 | 50 fmol | LTQ Orbitrap | 45 | 2,993 | PSM1029_07FEB15_ABRF_FT_50c.mzXML |
| 13 | 100 fmol | LTQ Orbitrap | 45 | 3,629 | PSM1027_07FEB15_ABRF_FT_100a.mzXML |
| 14 | 100 fmol | LTQ Orbitrap | 45 | 3,622 | PSM1028_07FEB15_ABRF_FT_100b.mzXML |
| 15 | 100 fmol | LTQ Orbitrap | 45 | 3,592 | PSM1029_07FEB15_ABRF_FT_100c.mzXML |
| SN | Instrument | CGL(minutes) | File Name | |
|---|---|---|---|---|
| 16 | LTQ Orbitrap | 100 | 18,573 | Ecoli432_R1-rr_18Dec09_Falcon_09-09-14.mzXML |
| 17 | LTQ Orbitrap | 100 | 18,585 | Ecoli432_R2_7Dec09_Falcon_09-09-15.mzXML |
| 18 | LTQ Orbitrap | 100 | 18,669 | Ecoli432_R3_7Dec09_Falcon_09-09-16.mzXML |
| 19 | LTQ Orbitrap | 100 | 18,585 | Ecoli432_R4_15Dec09_Falcon_09-09-16.mzXML |
| 20 | LTQ Orbitrap | 100 | 18,650 | Ecoli433_R1_7Dec09_Falcon_09-09-14.mzXML |
| 21 | LTQ Orbitrap | 100 | 18,763 | Ecoli433_R2_7Dec09_Falcon_09-09-15.mzXML |
| 22 | LTQ Orbitrap | 100 | 18,770 | Ecoli433_R4_13Dec09_Falcon_09-09-16.mzXML |
| 23 | LTQ Orbitrap | 100 | 18,488 | Ecoli434_R1_7Dec09_Falcon_09-09-14.mzXML |
| 24 | LTQ Orbitrap | 100 | 18,923 | Ecoli434_R2_7Dec09_Falcon_09-09-15.mzXML |
| 25 | LTQ Orbitrap | 100 | 19,010 | Ecoli434_R3_7Dec09_Falcon_09-09-16.mzXML |
| 26 | LTQ Orbitrap | 100 | 18,737 | Ecoli434_R4_13Dec09_Falcon_09-09-16.mzXML |
| SN | Instrument | CGL(minutes) | File Name | |
|---|---|---|---|---|
| 27 | Orbitrap Elite | 90 | 24,280 | E_L_2.mzML |
| 28 | Orbitrap Elite | 90 | 22,435 | E_M_2.mzML |
| 29 | Orbitrap Elite | 90 | 23,875 | E_H_2.mzML |
| 30 | Orbitrap Elite | 90 | 18,573 | E_S_2.mzML |
| SN | Instrument | CGL(minutes) | File Name | |
|---|---|---|---|---|
| 31-63 | LTQ Orbitrap | 120 | 340,861 | Roche_human_lung_001.mzML - Roche_human_lung_033.mzML |
Supplementary Figures