Parallax diagnostics of radiation source geometric dilution for iron opacity experiments
Abstract
Experimental tests are in progress to evaluate the accuracy of the modeled iron opacity at solar interior conditions [J.E. Bailey et al., Phys. Plasmas 16, 058101 (2009)]. The iron sample is placed on top of the Sandia National Laboratories z-pinch dynamic hohlraum (ZPDH) radiation source. The samples are heated to 150 - 200 eV electron temperatures and 7 - 4 cm-3 electron densities by the ZPDH radiation and backlit at its stagnation [T. Nagayama et al., Phys. Plasmas 21, 056502 (2014)]. The backlighter attenuated by the heated sample plasma is measured by four spectrometers along 9∘ with respect to the z-pinch axis to infer the sample iron opacity. Here we describe measurements of the source-to-sample distance that exploit the parallax of spectrometers that view the half-moon-shaped sample from 9∘. The measured sample temperature decreases with increased source-to-sample distance. This distance must be taken into account for understanding the sample heating.
I Introduction
Opacity quantifies photon absorption in matter and plays a crucial role in many high energy density plasmas, including inertial fusion plasmas and stellar interiorsMihalas (1978). Modeling opacities of ions with multiple bound electrons is very challenging and employs approximations that need to be experimentally validatedPerry et al. (1996); Bailey et al. (2009). Performing reliable opacity experiments is also challenging and must satisfy many criteriaPerry et al. (1996); Bailey et al. (2009). Measuring opacity becomes more difficult at higher temperature because the opacity sample has to be heated to the high temperature without significant gradients and has to be backlit by a bright radiation to minimize the effect of the hot sample plasma emission on the absorption measurement. The Sandia National Laboratories (SNL) Z machine (Z) provides a unique platform to perform opacity experiments at temperatures above 150 eVBailey et al. (2007).
The Z-pinch dynamic hohlraum (ZPDH) is a terawatt x-ray radiation source at Z that makes high-temperature opacity measurements possibleRochau et al. (2014). The opacity sample is located above the ZPDH radiation source and is radiatively heated. Most of the photons have energies above 600 eV. This powerful radiation streams through the sample and heats it without significant gradientsNagayama et al. (2014). The ZPDH also provides a bright backlighter to mitigate the sample self-emission. Recently, we found that the opacity sample can reach higher temperatures and densities using the same radiation source only by changing the target configurationNash et al. (2010); Nagayama et al. (2014). However, it was not clear why the change in the target configuration affects the sample temperature if the sample is heated by the same radiation source. To further optimize this high temperature opacity experimental platform, it is crucial to understand what dictates the sample temperature. In this article, we provide experimental evidence that the source-to-sample distance depends on the sample configuration. This distance controls the source geometric dilution at the sample, thereby affecting the sample temperature.
II SNL Opacity experiments and parallax
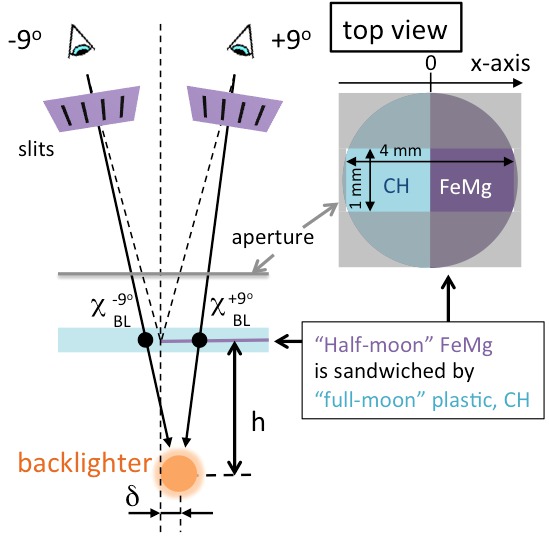
The typical SNL opacity experimental setup is shown in Fig. 1. The target consists of a semi-circular FeMg sample sandwiched by a circular tamping material (e.g., plastic, CH), which we call a “half-moon” target. Mg is mixed in the Fe sample to diagnose the Fe conditions (i.e., electron temperature, , and electron density, ) using Mg K-shell spectroscopyBailey et al. (2008); Nagayama et al. (2014). This target is placed above the ZPDH radiation source, and the ZPDH radiation heats and backlights the sampleRochau et al. (2014); Bailey et al. (2009). The backlighter attenuated through the target is recorded by potassium acid phthalate crystal (KAP) spectrometers fielded along from the z-axisBailey et al. (2008). An aperture above the target limits the spectrometers’ views to a 4 mm 1 mm area. Each spectrometer has 4 - 6 slits, each 50 in width, at the halfway distance to the sample to provide spatial resolution of 0.1 mm along the aperture direction with a magnification of 1. The transmitted backlighter images are recorded on Kodak 2492 x-ray films with spatial and spectral resolution.
Due to the finite source-to-sample distance, , the spectrometer at observes the backlighter bright spot through the FeMg embedded side at , while the one at observes it on the CH-only side at (black dots in Fig. 1). This spectrometer configuration measures the FeMg-attenuated and -unattenuated spectra simultaneously, providing FeMg transmission spectra in a single experiment (shot). However, taking advantage of this parallax, we can also infer the backlighter location with respect to the “half-moon” boundary (i.e., and in Fig. 1) based on and as follows:
| (1) |
assuming that the source-to-detector distance is much larger than - .
To extract and from the data, one has to understand the emergent intensity spatial profiles measured at (Fig. 2). The x-axis is defined such that the “half-moon” boundary is at x=0 and the FeMg-embedded region is at x0. The hypothetical transmission spatial profile at a given wavelength (blue) is systematically lower at x0 due to the FeMg attenuation. The apparent backlighter spatial profiles (green) are centered at different locations with respect to the sample for the spectrometers (i.e., and , respectively). While most of the backlighter spatial profile is attenuated through the FeMg region on the spectrometer, only the backlighter wing is attenuated through FeMg on the spectrometer. As a result, one expects to see a double peak in the emergent spatial profile at , while one expects a skewed single peak at .
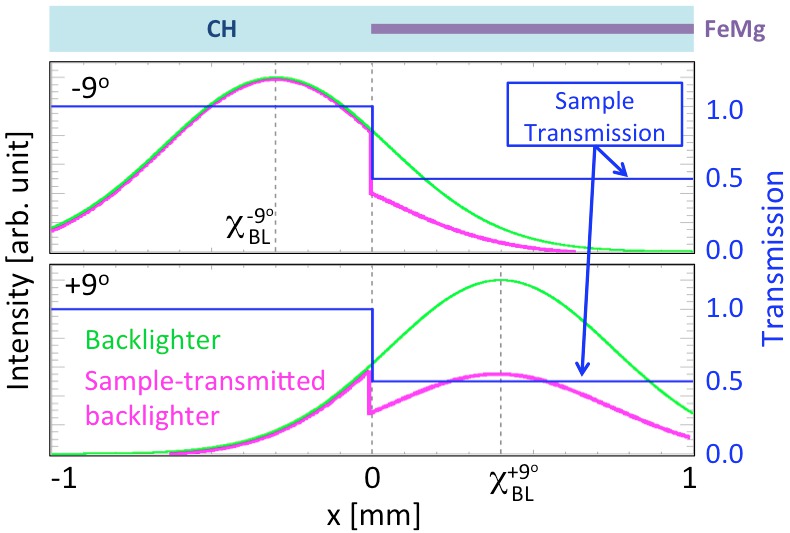
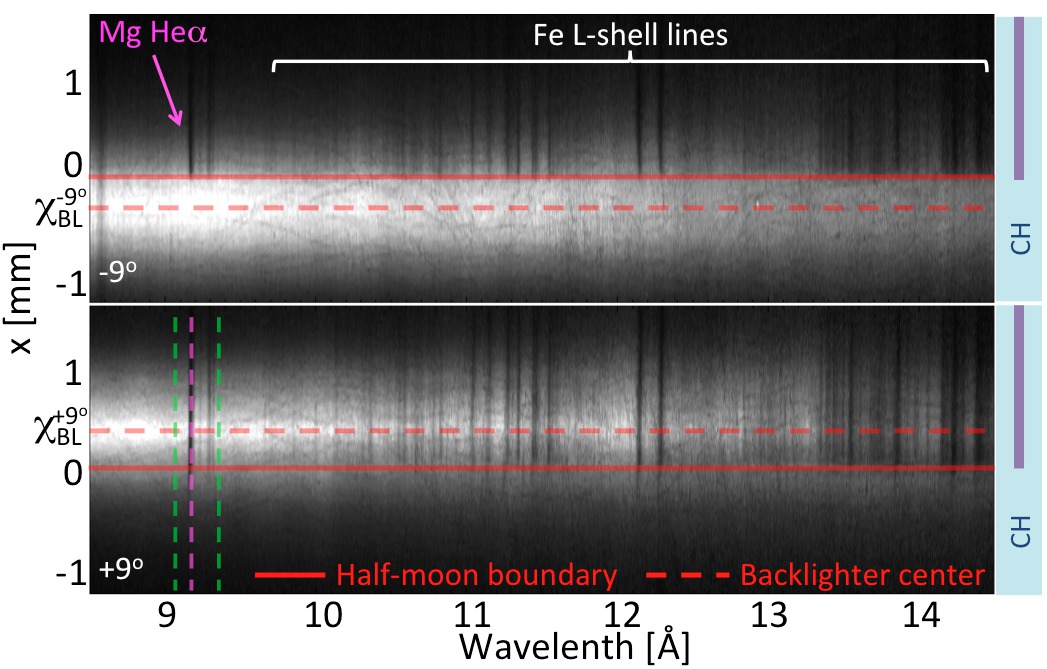
Figure 3 shows the data recorded by the spectrometers at . Each image is the average over four slit images to improve the signal-to-noise ratio and to average out random defects in the individual slit imagesNagayama et al. (2014). The horizontal (spectral) and vertical (spatial) axes are produced by the KAP crystals and the slits, respectively. The dark vertical lines correspond to Fe or Mg bound-bound absorption lines. The image recorded at shows longer Fe and Mg lines than those recorded at due to the apparent backlighter peak locations (Fig. 2).
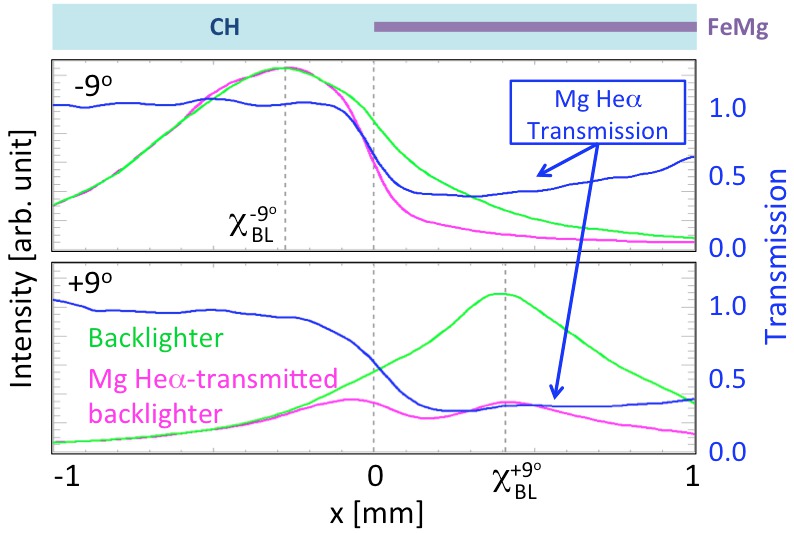
In order to measure and , one has to extract the locations of the “half-moon” boundary and the apparent backlighter peak. To objectively extract them, we take a spatial lineout on a strong bound-bound absorption line. The magenta curves in Fig. 4 show an example for the Mg He line (i.e., absorption due to He-like Mg transition) at 9.17 (lineout =0.02 ). As discussed earlier, the magenta curve at has a double peak, while the one at has a skewed single peak. We approximate the spatial profile in the absence of the Mg He (green curves in Fig. 3) by averaging two spatial lineouts taken on each side of the Mg He line. The lineout locations for the image are indicated by vertical green dashed lines in Fig. 3. The He line transmission is determined from the ratio of the magenta and green curves. The resultant transmission spatial profiles clearly show low-transmission FeMg embedded regions, and the x-axis is defined from its inflection point. We note that the “half-moon” boundary is not as sharp as the one in Fig. 2. This is because of the instrument spatial resolution and the sample hydrodynamics integrated over the backlighter duration. Once and are defined by the apparent backlighter peak locations on the defined x-axis, the backlighter location, and , can be estimated from Eq. 1.
III Results
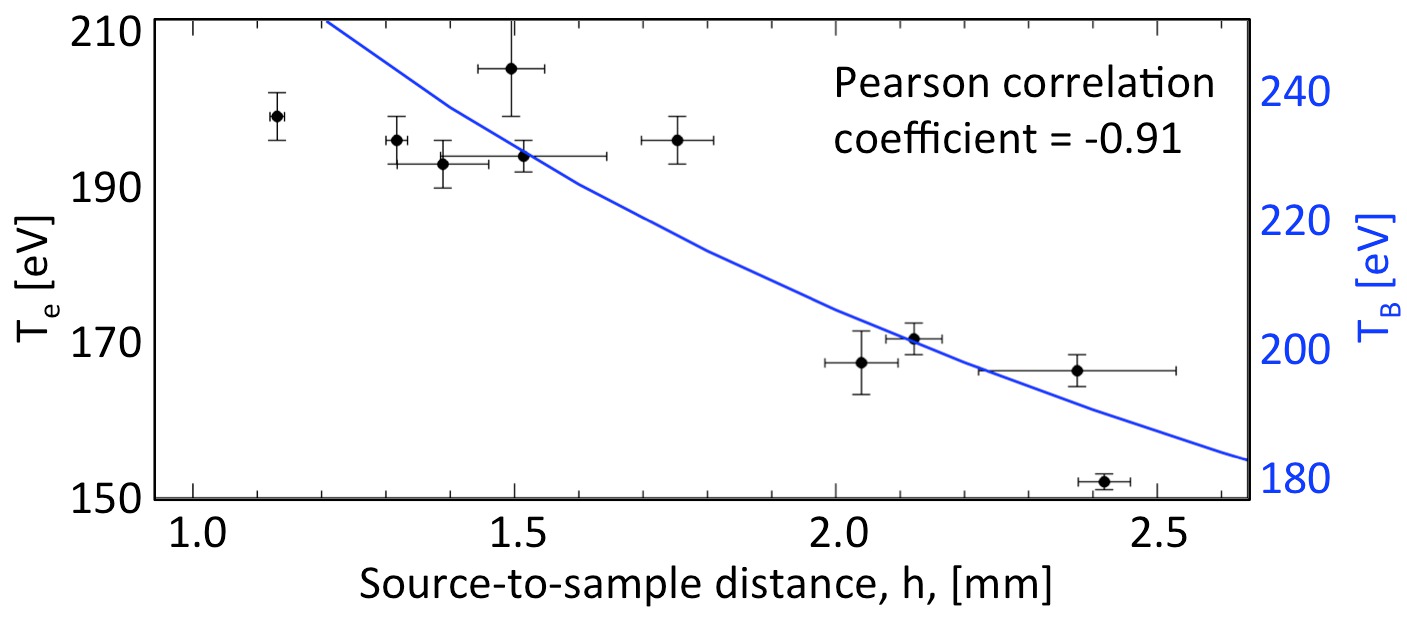
Parallax is systematically applied to ten Fe opacity shots performed under different sample configurations Nagayama et al. (2014). There are three different CH configurations and multiple different Fe thicknesses for each configuration. There is one shot where the sample is raised by 1.5 mm from its nominal location. For each shot, parallax is applied to the available bound-bound lines that are strong enough to define the “half-moon” boundary from their line-transmission spatial profiles. The number of usable lines depends on their areal density, Stark line width, and the spectral range of the spectrometers used. For each shot, the mean h and its standard deviation are computed from parallax results of two to seven Fe and Mg lines. Parallax results from Fe and Mg lines agree with each other. The validity of this uncertainty estimate was also verified from the shots with four spectrometers, two each at and . Figure 5 summarizes the measured as a function of inferred from Mg K-shell spectroscopyNagayama et al. (2014). We confirm a strong anti-correlation between and (Pearson correlation coefficient = -0.91).
To investigate this point synthetically, we use a 3D view factor code VISRADMacFarlane (2003) and a calibrated ZPDH intensity image from one of our experiments to calculate the heating radiation at the sample as a function of the sample distance from the ZPDH radiation source. The details of the calculation will be discussed elsewhere. The blue curve in Fig. 5 shows the resultant radiation brightness temperature, , as a function of . This result suggests that the radiation source heats the sample to different temperatures due to source radiation geometric dilution. The radiation brightness temperature is systematically higher than due to the complex heating mechanism involving radiation transport and hydrodynamics and beyond the scope of this article.
Figure 5 also shows that, for similar , shot-to-shot variation in the inferred is larger than the individual measurement uncertainties due to the 3-D radiation transport effects of the backlighter. While Eq. (1) is derived assuming an instantaneous point backlighter, the actual backlighter emission is a result of the radiation transport through the 3-D ZPDH plasma, which spatially varies over a few ns duration. Thus, the variation in the inferred comes from the irreproducibility in the evolution of 3-D ZPDH plasma and the resultant irreproducibility in the line-of-sight dependent effects on the measurements.
We found that was anti-correlated to and confirmed that the sample reached a different temperature due to the geometric dilution of the radiation source. The parallax results are important i) to better understand our platform and further optimize SNL Z opacity experiments and ii) to better understand the sample heating and accurately evaluate how close our sample is to local thermal equilibrium.
ACKNOWLEDGMENTS
Sandia is a multiprogram laboratory operated by Sandia Corporation, a Lockheed Martin Company, for the (U.S.) Department of Energy under Contract No. DE-AC04-94AL85000.
References
- Mihalas (1978) D. Mihalas, Stellar Atmospheres, A Series of books in astronomy and astrophysics (W. H. Freeman, 1978).
- Perry et al. (1996) T. Perry et al., Phys. Rev. E 54, 5617 (1996).
- Bailey et al. (2009) J. E. Bailey et al., Physics of Plasmas 16, 058101 (2009).
- Bailey et al. (2007) J. Bailey et al., Physical Review Letters 99 (2007).
- Rochau et al. (2014) G. A. Rochau et al., Physics of Plasmas 21, 056308 (2014).
- Nagayama et al. (2014) T. Nagayama et al., Physics of Plasmas 21, 056502 (2014).
- Nash et al. (2010) T. J. Nash et al., Rev. Sci. Instrum. 81, 10E518 (2010).
- Bailey et al. (2008) J. E. Bailey et al., Rev. Sci. Instrum. 79, 113104 (2008).
- MacFarlane (2003) J. J. MacFarlane, Journal of Quantitative Spectroscopy and Radiative Transfer 81, 287 (2003).