Imaging the Inner and Outer Gaps of the Pre-Transitional Disk of HD 169142 at 7 mm
Abstract
We present Very Large Array observations at 7 mm that trace the thermal emission of large dust grains in the HD 169142 protoplanetary disk. Our images show a ring of enhanced emission of radius 25-30 AU, whose inner region is devoid of detectable 7 mm emission. We interpret this ring as tracing the rim of an inner cavity or gap, possibly created by a planet or a substellar companion. The ring appears asymmetric, with the western part significantly brighter than the eastern one. This azimuthal asymmetry is reminiscent of the lopsided structures that are expected to be produced as a consequence of trapping of large dust grains. Our observations also reveal an outer annular gap at radii from 40 to 70 AU. Unlike other sources, the radii of the inner cavity, the ring, and the outer gap observed in the 7 mm images, which trace preferentially the distribution of large (mm/cm sized) dust grains, coincide with those obtained from a previous near-infrared polarimetric image, which traces scattered light from small (micron-sized) dust grains. We model the broad-band spectral energy distribution and the 7 mm images to constrain the disk physical structure. From this modeling we infer the presence of a small (radius 0.6 AU) residual disk inside the central cavity, indicating that the HD 169142 disk is a pre-transitional disk. The distribution of dust in three annuli with gaps in between them suggests that the disk in HD 169142 is being disrupted by at least two planets or substellar objects.
1 Introduction
The early stages of planet formation are expected to be identified by signatures of dust evolution in the protoplanetary disks. An outstanding signature is the large (several tens AU in diameter) central cavities almost devoid of dust that characterize the so-called transitional disks (Calvet et al. 2005). Some of these transitional disks, dubbed pre-transitional disks, show an important near-IR excess that is interpreted as produced by a residual inner disk inside the cavity (Espaillat et al. 2008).
A number of processes have been proposed to explain the origin of these cavities. Photoevaporation and winds can remove material from the inner disk (e.g., Alexander et al. 2006; Suzuki et al. 2010); grain-growth can diminish the dust opacity, decreasing its continuum emission (Dullemond & Dominik 2005); finally, dynamical clearing due to tidal interactions with low-mass companions, either very young brown dwarfs or giant planets on long-period orbits, can produce annular gaps and cavities in the disk (Papaloizou et al. 2007; Zhu et al. 2011). Andrews et al. (2011) favored the last of these mechanisms in their analysis of a sample of 12 such disks. Therefore, transitional and pre-transitional disks are excellent places to search for the youngest planets.
The existence of central cavities (first suggested by Strom et al. 1989) was confirmed from the modeling of the spectral energy distributions (SEDs) and the analysis of Spitzer spectra (e.g., D’Alessio et al. 2006). However, in recent years, it has been possible to image several of these cavities through mm and submm interferometric observations (Brown et al. 2009; Andrews et al. 2011; Isella et al. 2013; Casassus et al. 2013), as well as by high angular resolution polarimetric imaging at infrared wavelengths (e.g., Quanz et al. 2011; Hashimoto et al. 2012; Garufi et al. 2013; Avenhaus et al. 2014).
The disk surrounding the Herbig Ae/Be star HD 169142 (, pc; Manoj et al. 2006 and references therein) is one of the best targets to study the planetary formation process. Near-infrared polarization images as well as millimeter continuum and CO observations reveal that the disk is nearly face-on, extending up to 240 AU (e.g., Kuhn et al. 2001; Raman et al. 2006). Its SED characteristics and its relatively strong 7 mm emission suggest that dust has evolved to form big grains (Dent et al. 2006), a prerequisite to planet formation.
Modeling of the SED of HD 169142 suggested the presence of a disk inner cavity with an estimated radius of 40 AU (Grady et al. 2007) or 20 AU (Meeus et al. 2010; Honda et al. 2012; Maaskant et al. 2013). These results are supported by recent H-band polarized light images obtained with NACO/VLT (Quanz et al. 2013) that reveal a bright emission ring with a radius of 25 AU, which is interpreted as the rim of the inner cavity. Additionally, these images reveal the presence of a 40-70 AU annular gap. However, with these data alone it cannot be unambiguously established whether this gap in polarized emission corresponds to a real gap in surface density, possibly induced by one (or several) forming planet(s), or if it is an illumination effect.
We present Very Large Array (VLA) observations towards HD 169142 that reveal, for the first time, the structure of the dust thermal emission of the disk at radii from 10 to 100 AU.
2 Observations
Observations were carried out with the Karl G. Jansky VLA of the National Radio Astronomy Observatory (NRAO)111The NRAO is a facility of the National Science Foundation operated under cooperative agreement by Associated Universities, Inc.. We observed the continuum emission in the Q (7 mm), C (5.5 cm) and X (3.3 cm) bands in three different array configurations (CnB, A, and B) (see Table 1). Calibration of the complex gain of the antennas was performed by observing J1820-2528 every 2 minutes. We estimate that the uncertainty in the absolute positions in Q band is . The flux scale was set by observing 3C286.
Data were calibrated with the CASA (Common Astronomy Software Applications; version 4.1.0)222https://science.nrao.edu/facilities/vla/data-processing package. For each data set, we ran the VLA Calibration Pipeline provided by the NRAO (version 1.2.0)333https://science.nrao.edu/facilities/vla/data-processing/pipeline. After inspection of the calibrated data, we performed additional data flagging and re-ran the pipeline when needed.
We produced deconvolved images from each configuration data set, as well as an image combining data from all configurations. All images were obtained with the multi-scale, multi-frequency CLEAN algorithm (Rau & Cornwell 2011) and implemented in the task clean of CASA.
3 Results
We did not detect any significant emission at C (5.5 cm) or at X (3.3 cm) bands, with 3- upper limits of 36 and 39 Jy beam-1, respectively (Table 1). By extrapolating the X-band upper limit with a spectral index of +0.6, a value typical of free-free emission from thermal radio jets (e.g., Anglada 1996), we expect a free-free contribution at 7 mm of mJy, of the observed flux density. Thus, the 7 mm emission reliably traces the thermal dust emission of the disk with negligible free-free contamination.
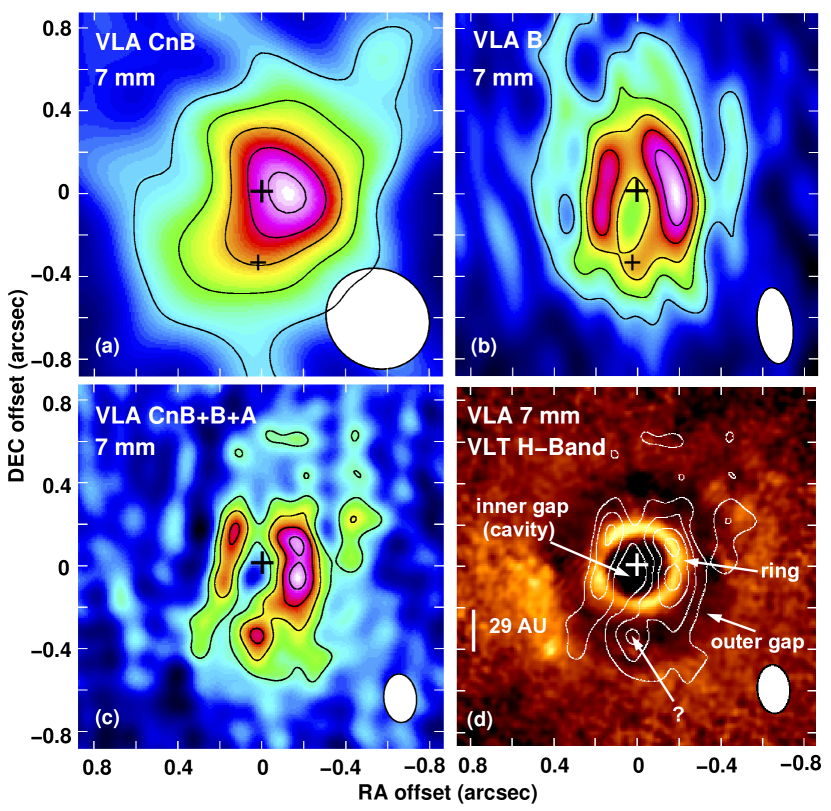
In Figure 1 we show VLA images at 7 mm wavelength of the disk surrounding HD 169142. The source is marginally resolved in the CnB configuration image (Fig. 1a), showing that the emission is asymmetric, with the western side being brighter than the eastern side. The source, with a total flux density of 1.80.3 mJy, is well resolved in the sensitive (8 GHz bandwidth) B configuration image (Fig. 1b) showing a ring of emission of radius - ( 25-30 AU). The width of the ring appears unresolved, even in the E-W direction where the angular resolution is better. The decrease in intensity observed towards the northern and southern edges of the ring is an observational effect, since in these directions the north-south elongated beam intersects a smaller fraction of the ring area.
The center of the emission ring in the B configuration image is located at (J2000) = 18h24m29.776s, (J2000) = 29∘46′49.87′′, which falls 0.04′′ west and 0.03′′ north of the nominal position of the star HD 169142 in the Tycho-2 catalog, after correction for proper motions to the epoch of the observation. Therefore, the VLA observations indirectly provide an accurate position for the star. In the A configuration images, the emission ring is only marginally detected, after setting a maximum uvrange of 1000 k. An image obtained from the CnB and A configuration data is presented in Osorio et al. (2014).
The image in Figure 1c was obtained by combining the interferometric visibilities from the CnB, B, and A configurations. To correct for residual differences in absolute positions due to phase errors and proper motions, the data from the A and B configurations were aligned (within 0.05′′) by matching the centers of the rings fitted to the individual images before being combined. For the CnB data, obtained with a larger beam, a precise alignment was considered unnecessary. The final image shows the same general structure as the one seen with the B-array data alone, but with better detail.
3.1 The Emission Ring and the Inner Cavity/Gap
One of the outstanding features of the HD 169142 disk images is the ring of enhanced emission of radius 25-30 AU. We interpret this ring as the rim of an inner cavity or gap possibly created in the disk by a planet or a substellar companion. Figure 1d shows an overlay of the VLA image from Figure 1c and the H-band polarized light image of Quanz et al. (2013). The cavity is suggested by the decrease of emission near the inner edge of the ring in the IR image, but it cannot be traced towards the center because the central pixels are saturated. Nevertheless, this inner cavity is clearly seen in the 7 mm images (Figs. 1b, c, d), confirming HD 169142 as a transitional or pre-transitional disk. Interestingly, the size of the cavity in the IR image, which traces scattered light from small (micron-sized) dust grains, coincides with that in the 7 mm image, which traces larger (mm/cm-sized) dust grains. This is in contrast with other sources where the size of the cavity changes with the observed wavelength (see Garufi et al. 2013 and references therein).
The 7 mm emission ring appears significantly asymmetric (in the B-configuration image, the flux densities of the western and eastern halves of the ring are 630105 mJy and 36178 mJy, respectively, without overlapping of the quoted 99% confidence intervals). This azimuthal asymmetry is reminiscent of the lopsided rings that are expected to be produced at long wavelengths as a consequence of azimuthal accumulation (trapping) of large dust grains, as predicted by theoretical models (e.g., Birnstiel et al. 2013) and revealed by ALMA observations of more extreme asymmetries in sources such as Oph IRS 48 (van der Marel et al. 2013) and HD 142527 (Casassus et al. 2013). In near-IR scattered light the emission ring of HD 169142 is more symmetric but shows a dip at PA (Quanz et al. 2013), and perhaps a second dip at PA (Fig. 1c), both in the eastern side, where the 7 mm emission is weaker.
3.2 The Outer Annular Gap
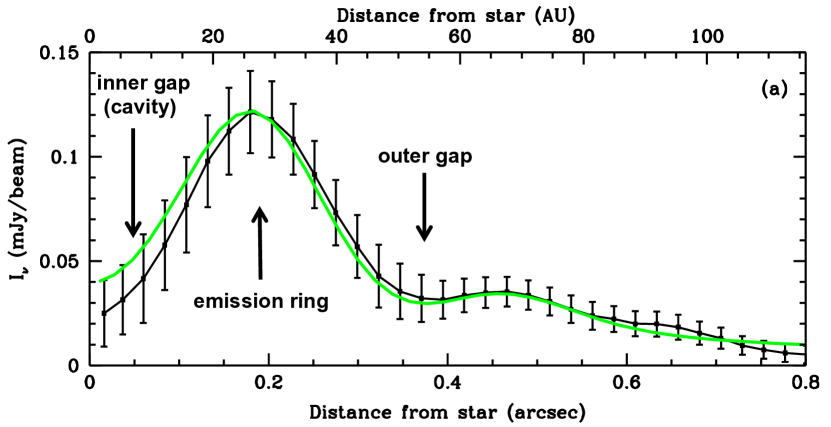
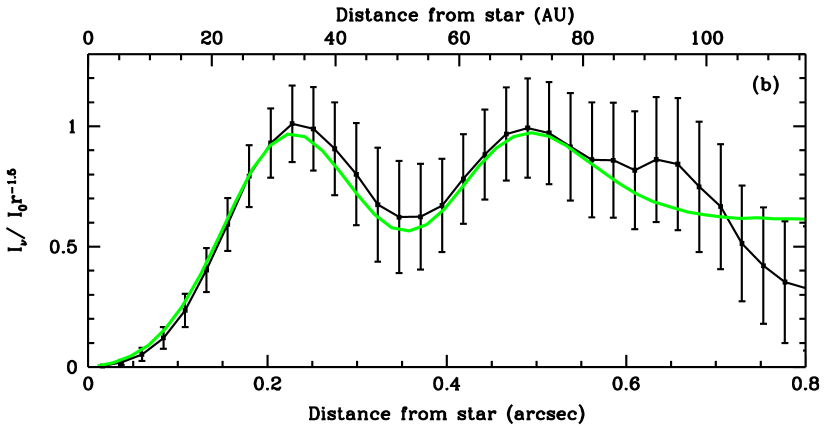
Quanz et al. (2013) reported the presence of an annular gap in the IR polarized light of the disk of HD 169142 in the range of radii 40-70 AU. This gap in scattered light may be due to a real decrease in the disk surface density, which could be induced by a protoplanet, or may be due to shadowing or other illumination effect that decreases the polarized light. Our 7 mm observations, tracing optically thin thermal emission of the large dust grains, could provide a better determination of the real nature of this gap. However, the 7 mm emission is weak at 40 AU from the center. To improve the signal to noise ratio at large radii, we have calculated the radial intensity profile, shown in Figure 2a, averaging the emission over concentric rings in Figure 1c. To highlight the outer gap and its radial location, Figure 2b shows the same profile but normalized by a power-law fit to compensate for the radial intensity decrease. In the azimuthal averaging we have excluded PAs near , where there is a knot of emission that may be an independent component (see below). The radial intensity profile shows that the outer gap, as well as the inner cavity and the bright ring, are found at the same radii as the corresponding features in the IR profile (Fig. 2 in Quanz et al. 2013), suggesting that they represent the true dust distribution.
An additional interesting feature observed in our 7 mm VLA images is the knot of emission located (50 AU) to the south (PA ) of the central star. This emission appears smeared out in the B configuration image (Fig. 1b) but is better defined in the image that combines all configurations (Fig. 1c). This compact source falls in the middle of the outer annular gap, and we speculate that it could trace circumplanetary dust emission associated with the protoplanet responsible for creating this gap. We estimate for this knot a flux density of 100 Jy above the background (5-). Assuming a temperature of 50 K and a 7 mm opacity of 2 cm-2 g-1, as suggested by the SED modeling (section 4), we obtain a total (dust+gas) mass of 0.6 . This mass estimate is uncertain, since in the proximity of gaps the size of dust grains and the dust-to-gas ratio are expected to change with time and planet mass (Pinilla et al. 2012). If the 7 mm source is associated with a protoplanet, its expected orbital period (186 yr) would produce proper motions detectable in a few years, providing an unambiguous way to test this hypothesis.
4 Disk Model
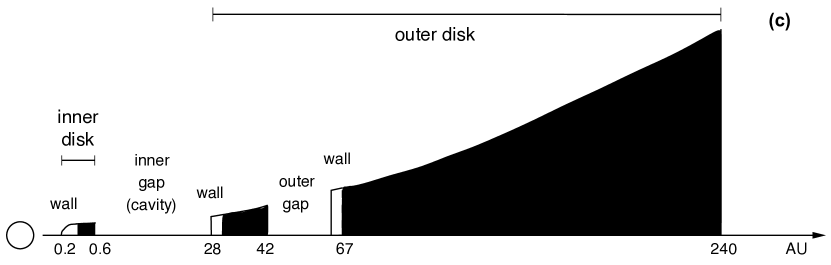
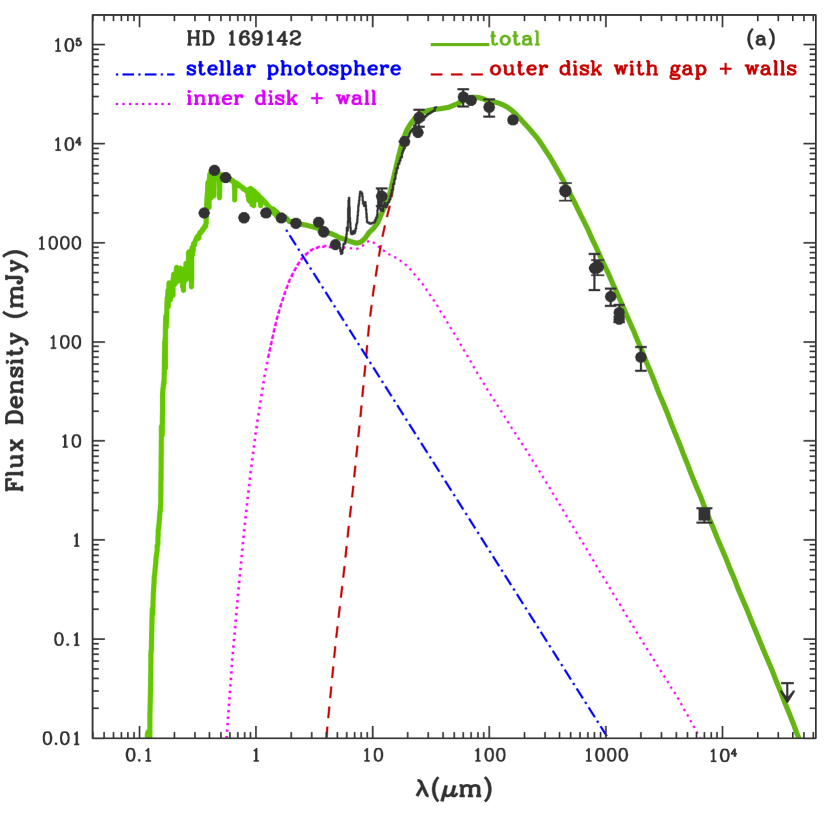
HD 169142 has been observed from ultraviolet to radio wavelengths. Figure 3a shows the photometric data points compiled from the literature and from this paper. Our model includes the contribution of the central star (whose adopted parameters are given in Table 2) and the disk. As suggested by the observations (Quanz et al. 2013; this paper) the disk has a central cavity of radius 30 AU and a gap spanning 40-70 AU. We find that a central hot component is required to fit the 2-10 m range of the SED. A central dust component was also inferred from the modeling of Honda et al. (2012) and Maaskant et al. (2013), who postulate the presence of a central dust halo. However, we find that the emission can be naturally explained by a small residual inner disk and its hot wall (located where dust reaches its sublimation temperature). With this residual inner dust, the disk of HD 169142 should be classified as pre-transitional (as defined by Espaillat et al. 2008), implying that the observed central cavity is actually a gap between the inner and outer parts of the disk (see sketch in Fig. 2c).
The contribution of the disk is obtained using the irradiated -accretion disk models with dust settling developed by D’Alessio et al. (1999, 2001, 2006). In these models, the radial and vertical physical structure of the disk, and the emerging intensity are self-consistently calculated. Since HD 169142 is a very well studied object, most of the parameters of the model are determined by previous observations; other are pretty well constrained, and only small fine-tuning adjustments were required (see Table 2 and references therein). The main free parameters of the model are the viscosity and the dust properties. A low value of the viscosity parameter is required to account for both the low mass accretion rate and the high surface densities (suggested by the relatively strong mm/submm flux densities), as in -disks the viscosity parameter is proportional to the mass accretion rate and inversely proportional to the surface density.
The dust is assumed to consist of two populations of grains (each with an size distribution) that are vertically distributed as a function of the degree of settling of large grains from the upper layers. The grain sizes are constrained mainly by the data at wavelengths 100 m. Grains in the disk upper layers have radii ranging from 0.005 m to 1 m, while the radii of the grains settled in the disk mid-plane range from 5 m to 1 mm. The dust-grain mixture assumed to compute the opacity consists of silicates and graphite, with mass fractional abundances relative to gas of 0.004 and 0.0025, respectively (e.g., McClure et al. 2013).
The inner disk sublimation wall has a curved shape that depends on density and grain settling, and is calculated following Nagel et al. (2013) and D’Alessio et al. (2006). For the gaps and their walls we use a simpler treatment (see, e.g., Jang-Condell & Turner 2012 for a more accurate treatment). The gaps are modeled as annular regions completely devoid of dust with cylindrical walls whose scale height is predicted by the accretion disk model. The wall radii are obtained approximately from the observed images (Quanz et al. 2013; this paper) and refined (within AU) by fitting the SED and the 7 mm intensity profile.
The emission of the outer walls of the gaps is computed as a modified blackbody (D’Alessio et al. 2005), but taking into account the extinction by the disk. Thus, at short wavelengths, just half of the inner face of the wall will be visible, while at 7 mm we will be detecting the whole wall. Walls are assumed to be unresolved in the radial direction, with a width smaller than the pixel scale (1 AU). Because of shadowing, only the upper portion (composed of small dust grains) of these walls is frontally irradiated by the star, and is heated at a temperature close to the equilibrium temperature, which is calculated following Nagel et al. (2013). The contribution of the shadowed portion of the walls (at lower temperatures, defined by the disk structure) is relevant in the 7 mm intensity profile. This emission is dominated by the large dust grains (close to the disk mid-plane) that accumulate near the outer edges of the gaps because of dust filtration. To simulate this effect, in these walls we increased the dust-to-gas ratio by a factor of 3, and the scale height of the large dust grain population up to 60% of the local gas-pressure scale height. These two parameters are determined mainly by fitting the 7 mm intensity profile.
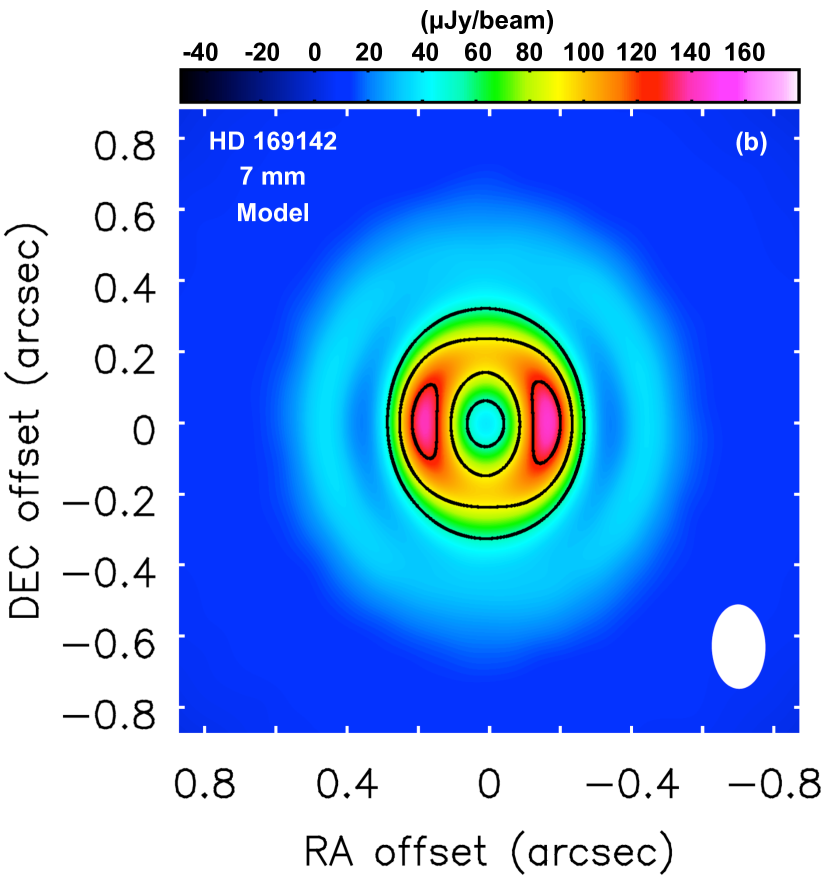
The main parameters of our favored model are given in Table 2. Figure 3a shows that the model reproduces the observed SED satisfactorily. Figure 3b shows a CASA simulated image of the 7 mm model emission that agrees in shape, size, and intensity with the observed image (Fig. 1c). Figures 2a and 2b show a quantitative comparison of the radial intensity profiles of both images, showing that model and observations are in good agreement. The contribution of the hot inner disk and its wall (dominant in the 2-10 m range), remain below the detectability limits at 7 mm, as expected. Very sensitive high angular resolution observations at mm/submm wavelengths are necessary to directly confirm the presence of this disk component.
The simulated model image (Fig. 3b) appears symmetric with respect to the beam axis. Subtraction from the observed one shows a residual emission excess in the western side, indicating that the east-west asymmetry in the observed images (Fig. 1) cannot be attributed to opacity effects and should have a different origin, such as a dust trap.
As noted above, most of the physical structure of the HD 169142 disk is self-consistently modeled and constrained by the observations. However, the gaps and walls arising from the tidal interactions of the disk with companions, and the subsequent radial and azimuthal gradients of the gas-to-dust ratio, are not self-consistently integrated. Model improvements should come from including azimuthal asymmetries and dust migration.
In summary, our observational and model results show that the disk of HD 169142 is a pre-transitional disk with two gaps in the dust distribution, suggesting that it is being disrupted by at least two planets or substellar objects. Actually, Reggiani et al. (2014) have just reported 3.8 m observations revealing the presence of a low-mass companion in the inner gap of the disk, at a separation of 23 AU.
References
- Alexander et al. (2006) Alexander, R. D., Clarke, C. J., & Pringle, J. E. 2006, MNRAS, 369, 216
- Andrews et al. (2011) Andrews, S. M., Wilner, D. J., Espaillat, C., et al. 2011, ApJ, 732, 42
- Anglada (1996) Anglada, G. 1996, Radio Emission from the Stars and the Sun, ASP Conf. Ser., 93, 3
- Avenhaus et al. (2014) Avenhaus, H., Quanz, S. P., Schmid, H. M., et al. 2014, ApJ, 781, 87
- Birnstiel et al. (2013) Birnstiel, T., Dullemond, C. P., & Pinilla, P. 2013, A&A, 550, L8
- Brown et al. (2009) Brown, J. M., Blake, G. A., Qi, C., et al. 2009, ApJ, 704, 496
- Calvet et al. (2005) Calvet, N., D’Alessio, P., Watson, D. M., et al. 2005, ApJ, 630, L185
- Casassus et al. (2013) Casassus, S., van der Plas, G., M, S. P., et al. 2013, Nature, 493, 191
- D’Alessio et al. (2001) D’Alessio, P., Calvet, N., & Hartmann, L. 2001, ApJ, 553, 321
- D’Alessio et al. (2006) D’Alessio, P., Calvet, N., Hartmann, L., Franco-Hernández, R., Servín, H. 2006, ApJ, 638, 314
- D’Alessio et al. (1999) D’Alessio, P., Calvet, N., Hartmann, L., Lizano, S., & Cantó, J. 1999, ApJ, 527, 893
- D’Alessio et al. (2005) D’Alessio, P., Hartmann, L., Calvet, N., et al. 2005, ApJ, 621, 461
- Dempsey et al. (2013) Dempsey, J. T., Friberg, P., Jenness, T., et al. 2013, MNRAS, 430, 2534
- Dent et al. (2006) Dent, W. R. F., Torrelles, J. M., Osorio, M., Calvet, N., & Anglada, G. 2006, MNRAS, 365, 1283
- Dullemond & Dominik (2005) Dullemond, C. P., & Dominik, C. 2005, A&A, 434, 971
- Espaillat et al. (2008) Espaillat, C., Calvet, N., Luhman, K. L., Muzerolle, J., & D’Alessio, P. 2008, ApJ, 682, L125
- Garufi et al. (2013) Garufi, A., Quanz, S. P., Avenhaus, H., et al. 2013, A&A, 560, A105
- Grady et al. (2007) Grady, C. A., Schneider, G., Hamaguchi, K., et al. 2007, ApJ, 665, 1391
- Hashimoto et al. (2012) Hashimoto, J., Dong, R., Kudo, T., et al. 2012, ApJ, 758, L19
- Honda et al. (2012) Honda, M., Maaskant, K., Okamoto, Y. K., et al. 2012, ApJ, 752, 143
- Isella et al. (2013) Isella, A., Pérez, L. M., Carpenter, J. M., et al. 2013, ApJ, 775, 30
- Jang-Condell & Turner (2012) Jang-Condell, H., & Turner, N. J. 2012, ApJ, 749, 153
- Kuhn et al. (2001) Kuhn, J. R., Potter, D., & Parise, B. 2001, ApJ, 553, L189
- Maaskant et al. (2013) Maaskant, K. M., Honda, M., Waters, L. B. F. M., et al. 2013, A&A, 555, A64
- Manoj et al. (2006) Manoj, P., Bhatt, H. C., Maheswar, G., & Muneer, S. 2006, ApJ, 653, 657
- McClure et al. (2013) McClure, M. K., D’Alessio, P., Calvet, N., et al. 2013, ApJ, 775, 114
- Meeus et al. (2010) Meeus, G., Pinte, C., Woitke, P., et al. 2010, A&A, 518, L124
- Nagel et al. (2013) Nagel, E., D’Alessio, P., Calvet, N., Espaillat, C., Trinidad, M.A. 2013, RMAA, 49, 43
- Osorio et al. (2014) Osorio, M., Anglada, G., Carrasco-González, C., et al. 2014, IAU Symposium, 299, 145
- Papaloizou et al. (2007) Papaloizou, J. C. B., Nelson, R. P., Kley, W., Masset, F. S., & Artymowicz, P. 2007, Protostars and Planets V, 655
- Pinilla et al. (2012) Pinilla, P., Benisty, M., & Birnstiel, T. 2012, A&A, 545, A81
- Quanz et al. (2011) Quanz, S. P., Schmid, H. M., Geissler, K., et al. 2011, ApJ, 738, 23
- Quanz et al. (2013) Quanz, S. P., Avenhaus, H., Buenzli, E., et al. 2013, ApJ, 766, L2
- Raman et al. (2006) Raman, A., Lisanti, M., Wilner, D. J., Qi, C., & Hogerheijde, M. 2006, AJ, 131, 2290
- Rau & Cornwell (2011) Rau, U., & Cornwell, T. J. 2011, A&A, 532, A71
- Reggiani et al. (2014) Reggiani, M. et al. 2014, ApJL, submitted
- Sandell et al. (2011) Sandell, G., Weintraub, D. A., & Hamidouche, M. 2011, ApJ, 727, 26
- Strom et al. (1989) Strom, K. M., Strom, S. E., Edwards, S., Cabrit, S., & Skrutskie, M. F. 1989, AJ, 97, 1451
- Suzuki et al. (2010) Suzuki, T. K., Muto, T., & Inutsuka, S.-i. 2010, ApJ, 718, 1289
- van der Marel et al. (2013) van der Marel, N., van Dishoeck, E. F., Bruderer, S., et al. 2013, Science, 340, 1199
- Zhu et al. (2011) Zhu, Z., Nelson, R. P., Hartmann, L., Espaillat, C., & Calvet, N. 2011, ApJ, 729, 47
| Observation | Project | Array | Frequency | Mean | rms | Synthesized BeambbFor naturally weighted maps. | ||
|---|---|---|---|---|---|---|---|---|
| Date | Code | Configuration | Band | Range | Wavelength | NoisebbFor naturally weighted maps. | Size | PA |
| (GHz) | (mm) | (Jy beam-1) | (arcsecarcsec) | (deg) | ||||
| 2012-May-03 | 12A-439 | CnB | Q | 42-44 | 7.0 | 28 | 0.510.47 | 50 |
| 2012-May-03 | 12A-439 | CnB | C | 4.5-6.5 | 55 | 12 | 4.283.76 | 48 |
| 2012-Nov-12 | 12A-439 | A | Q | 42-44 | 7.0 | 25 | 0.110.05 | 4 |
| 2012-Nov-12 | 12A-439 | A | C | 4.5-6.5 | 55 | 12 | 0.850.39 | 1 |
| 2013-Sep-28 | 13B-260 | B | Q | 40-48 | 6.8 | 17 | 0.370.17 | 6 |
| 2013-Sep-28 | 13B-260 | B | X | 8-10 | 33 | 13 | 1.760.77 | 8 |
| Parameter | Value | Notes | Refs. |
|---|---|---|---|
| Stellar Properties | |||
| Distance (pc) | 145 | Adopted | 1 |
| (mag) | 0.5 | Adopted | 2 |
| Age (Myr) | 5.4 | Adopted | 1 |
| Effective Temperature (K) | 8100 | Adopted | 1 |
| Radius ( | 2.2 | Adopted | 1 |
| Mass () | 2 | Adopted | 1 |
| Inner DiskaaThe mass accretion rate, viscosity coefficient, inclination, and grain properties are equal to those of the outer disk. The size is constrained by the 7 mm intensity upper limit towards the center. | |||
| Inner Radius (AU) | 0.5 | Fitted | |
| Outer Radius (AU) | 0.6 | Fitted | |
| Mass (M⊙) | 2.610-5 | Calculated | |
| Wall of the Inner Disk | |||
| Location (AU) | 0.2-0.5 | Calculated | |
| Temperature (K) | 1300-1000 | Calculated | |
| Height (AU) | 0-0.05 | Calculated | |
| Outer Disk | |||
| Inclination Angle (deg) | 13 | Adopted | 3 |
| Position Angle (deg) | 5 | Adopted | 3 |
| Inner Radius (AU) | 28 | Adopted/Refined | 4, 5 |
| Outer Radius (AU) | 240 | Adopted | 3 |
| Gap Inner Radius (AU) | 42 | Adopted/Refined | 4, 5 |
| Gap Outer Radius (AU) | 67 | Adopted/Refined | 4, 5 |
| Mass Accretion Rate ( yr-1) | 310-9 | Adopted/Refined | 6 |
| Viscosity Coefficient | 0.0005 | Fitted | |
| Degree of Settling | 0.5 | Fitted | |
| Mass () | 0.12 | Calculated | |
| Outer Wall of the Inner Gap | |||
| Location (AU) | 28 | Adopted/Refined | 4, 5 |
| Height (AU) | 9 | Calculated | |
| Illuminated Fraction (%) | 66 | Calculated | |
| Temperature of Illuminated Part (K) | 110 | Calculated | |
| Outer Wall of the Outer Gap | |||
| Location (AU) | 67 | Adopted/Refined | 4, 5 |
| Height (AU) | 26 | Calculated | |
| Illuminated Fraction (%) | 10 | Calculated | |
| Temperature of Illuminated Part (K) | 70 | Calculated | |
References. — (1) Manoj et al. 2006; (2) Dent et al. 2006; (3) Raman et al. 2006; (4) Quanz et al. 2013; (5) This paper; (6) Grady et al. 2007.