A Correlation between Hard Gamma-ray Sources and Cosmic Voids Along the Line of Sight
Abstract
We estimate the galaxy density along lines of sight to hard extragalactic gamma-ray sources by correlating source positions on the sky with a void catalog based on the Sloan Digital Sky Survey (SDSS). Extragalactic gamma-ray sources that are detected at very high energy (VHE; GeV) or have been highlighted as VHE-emitting candidates in the Large Area Telescope hard source catalog (together referred to as “VHE-like” sources) are distributed along underdense lines of sight at the 2.4 level. There is also a less suggestive correlation for the hard source population (1.7). A correlation between 10-500 GeV flux and underdense fraction along the line of sight for VHE-like and hard sources is found at and , calculated from the Pearson correlation coefficients of and , respectively. The preference for underdense sight lines is not displayed by gamma-ray emitting galaxies within the second catalog, containing sources detected above 100 MeV, or the SDSS DR7 quasar catalog. We investigate whether this marginal correlation might be a result of lower extragalactic background light (EBL) photon density within the underdense regions and find that, even in the most extreme case of a entirely underdense sight line, the EBL photon density is only 2% less than the nominal EBL density. Translating this into gamma-ray attenuation along the line of sight for a highly attenuated source with opacity , we estimate that the attentuation of gamma-rays decreases no more than 10%. This decrease, although non-neglible, is unable to account for the apparent hard source correlation with underdense lines of sight.
Subject headings:
voids; blazars; gamma rays1. Introduction
The flux from extragalactic very high energy (VHE; 100 GeV) gamma-ray sources is absorbed by extragalactic background light (EBL) photons via pair production in an energy- and distance-dependent manner (Nikishov, 1962; Gould & Shréder, 1967). As a consequence of this absorption, the EBL produces an opacity for VHE photons of observed energy from a source located at redshift . This opacity leads to an exponential flux attenuation .
The EBL consists of all the evolving accumulated and reprocessed light from the UV to the far-IR and is difficult to measure directly due to strong foreground sources (e.g., Hauser & Dwek, 2001). A selection of the currently available models of the EBL photon density include a semi-analytical model (Gilmore et al., 2012), a model based on observations of galaxy spectral energy distribution fractions (Domínguez et al., 2011a), and a fitting, interpolating and multiwavelength backward evolution of cosmological survey data (Franceschini et al., 2008).
These EBL models estimate photon densities at or above the conservative lower limits derived from galaxy counts, and are each below the indirectly set upper limits based on the detection of extragalactic VHE photons from sources at z0.1-0.2 (e.g., Aharonian et al. 2006; Meyer et al. 2012). More recent use of extragalactic gamma-ray sources for indirect studies of the EBL photon density have confirmed an EBL density not much above the observational lower limits and confirmed the “cosmic gamma ray horizon,” defined as (e.g., Ackermann et al., 2012; Abramowski et al., 2013; Domínguez et al., 2013). However, even with a low EBL photon density, a number of distant blazars have recently been detected at energies that probe opacities between (Archambault et al, 2014; Furniss et al., 2013; Becherini et al., 2012; Albert et al., 2008). The most distant of the sources detected above 100 GeV thus far is PKS 1424+240, with the redshift lower limit of (Furniss et al., 2013), which consistently displays a VHE flux of at least (1.020.08) ph cm-2 s-1 above 120 GeV (Archambault et al, 2014). PKS 1424+240 has been detected at gamma-ray opacities of , with the specific value dependent on the EBL model used to estimate the opacity. When the unattenuated gamma ray emission from this distant blazar is reconstructed using current EBL models, the spectrum shows a puzzling flattening or even upturn at the highest energies (Archambault et al, 2014).
Various scenarios have been explored to account for the spectral shape of high energy emission of sources at high opacity values. These possibilities include lower EBL densities, as described in Furniss et al. (2013), the observation of secondary VHE emission resulting from extragalactic ultra-high-energy cosmic-rays (UHECR) interactions along the line of sight (e.g. Essey & Kusenko 2010), the existence of axion-like particles which couple to the high energy gamma rays in the presence of a magnetic field (Domínguez et al., 2011b; Horns & Meyer, 2012; Meyer et al., 2014; Rubtsov & Troitsky, 2014; Chadwick & Harris, 2014; Tavecchio et al., 2014), and the possibility that VHE photons avoid pair production with the EBL through gravitational lensing (Barnacka et al., 2014). Each of the these scenarios, however, share an important underlying assumption about the density of the EBL: they assume that, after accounting for the expected cosmological evolution of the photon field, at any redshift and wavelength the density of the EBL is homogeneous throughout intergalactic space.
We present preliminary examination of this assumption in this work. We perform a simple analysis to investigate a possible relationship between extragalactic VHE-like gamma-ray source directions and the density of matter along the line of sight. In our analysis, VHE-like gamma-ray sources are sources that pass criteria on gamma-ray flux as measured by the Large Area Telescope (LAT; Atwood et al. 2009). See Section 3 for details on the VHE-like gamma-ray source list included in this study. We find an indication that VHE-like gamma-ray emitting galaxies (more specifically, blazars) might lie preferentially along underdense intergalactic lines of sight. We discuss the possibility that VHE-like gamma-ray sources are correlated with directions of lower than average EBL density, as this would result in a path of lower gamma-ray opacity for extragalactic gamma rays.
2. Method
Since the galaxies that are sources of the EBL preferentially trace high-density regions within the cosmic web, the local light production should be proportional to the local matter density. Thus, regions with lower matter density, known as voids, should correlate with regions of lower local light production. We take the void sample from the Public Cosmic Void Catalog111http://www.cosmicvoids.net (Sutter et al., 2012a); specifically the 2014.11.04 release, as the tracer for regions of underdensity within the Universe, and investigate the prevalence of voids along the lines of sight to blazars that lie within the SDSS DR7 survey region.
The voids are identified within four volume-limited subsamples of the SDSS DR7 main sample (Strauss et al., 2002) from redshift to and a single volume-limited subsample from the SDSS LRGs (Eisenstein et al., 2001) from to . These correspond to the dim1, dim2, bright1, bright2, and lrgdim samples, respectively. For this analysis we do not take higher-redshift voids from SDSS DR9 because that survey has a more complicated geometry than the main sample, making the construction of fairly-distributed random points difficult (see below). However, for two particularly distant sources, PKS 1424+240 and PG 1553+113, we utilize this higher redshift void catalog from SDSS DR9. Since the DR9-derived void catalog used in the analysis of these two sources is not used elsewhere, we do not include the results for these sources in the population investigations. When looking at different populations of sources, we utilize all voids within the catalog, including those identified near the survey boundaries, since for our purposes we only wish to estimate the underdensity fraction along a given line of sight, and do not need accurate distributions of void shapes.
Voids in the Public Catalog are identified with the VIDE toolkit (Sutter et al., 2014), which uses ZOBOV (Neyrinck, M. C., 2008) to perform a Voronoi tessellation to estimate the density field from the galaxy population and a watershed transform to merge regional basins into voids. The Voronoi tessellation is a segmentation of the volume by a set of polyhedra such that the polyhedra describe the local volumes of each galaxy. Hence these polyhedra (called Voronoi cells) can be used to estimate the density field of the galaxy population. VIDE ensures that identified voids do not extend outside the survey mask. In the watershed picture, a void is a non-spherical aggregation of Voronoi volumes (Platen et al, 2007) and can in principle have any mean or minimum density. However, they do represent basins in the density field (Sutter et al., 2013), and thus we can use them to estimate the underdense fraction. While the cores of watershed-based voids have densities below 0.2 , at the effective radius (see below), the spherically averaged density inside a void is roughly 0.8 (Sutter et al., 2012a).
VIDE provides two essential definitions used throughout this work. The first is the effective radius of a void,
| (1) |
where is the total volume of all the Voronoi cells that make up the void. The second is the macrocenter, or volume-weighted center of all the Voronoi cells in the void:
| (2) |
where and are the positions and Voronoi volumes of each galaxy , respectively.
The voids have a typical size (median) of Mpc, but range anywhere from to Mpc. For simplicity, we approximate the voids as spheres with and place them on the sky according to their macrocenters.
We parameterize the relative underdensity along the Line of Sight (LoS) to an extragalactic source through the “voidiness” (), which is the fraction of the comoving LoS distance through underdense regions of space (voids) as compared to the total LoS distance to a source. More specifically,
| (3) |
where is the comoving intersectional LoS distance through a single void and is the total comoving LoS distance to the source. A higher corresponds to a LoS that intersects a greater fraction of voids, while a low corresponds to a lower fraction of underdense intersection.
As a cross-check, we calculate in two independent ways. The first is a more simplistic method that associates a source to a void if the radial distance between the source and the void is less than the void radius after projecting the source and the void on the sky. For voids with , the is estimated as , which is the average length of random intersections through a spherical region of radius (Coleman, 1989). We also calculated using an alternative approach that discretized each line connecting the observer to the source into many (1000) points. We then obtained by counting the fraction of line segments that lay within of each void macrocenter. This more careful and more expensive calculation resulted in no significant differences. Here, we present the detailed results utilizing the former method.
3. Source Catalogs
| Catalog | Reference | Number of Sources**Sources within SDSS DR7 Survey Region and having a redshift of . | Energy Range |
|---|---|---|---|
| SDSS Quasars | Schneider et al. (2010) | 3901 | optical |
| 2LAC | Ackermann et al. (2011) | 51 | 100 MeV100 GeV |
| 1FHL | Ackermann et al. (2013) | 28 | GeV |
| VHE-like | Ackermann et al. (2013) | 19 | GeV****Which have gamma-ray properties that pass the following criteria, predetermined within the 1FHL catalog: (1) the flux above 50 GeV being greater than 1 ph cm-2s-1, (2) a spectral index above 10 GeV of less than 3 and (3) a measure of the source significance above 30 and 100 GeV (Sig). See text for details. |
| Randomly Generated | – | – |
The analysis is completed for multiple catalogs of both gamma-ray emitting and non-emitting extragalactic sources. The catalogs included are summarized in Table 1. Our studies are restricted to the catalog sources that are within the SDSS DR7 survey region and have a spectroscopically determined redshift of . The source populations are compared to a random set of points uniformly distributed throughout the SDSS DR7 survey region. We also investigate the lines of sight for the sources within the SDSS quasar catalog, which includes confirmed quasars from the SDSS Seventh data release (Schneider et al., 2010), as well as the second catalog of active galactic nuclei (2LAC; Ackermann et al. 2011).
The catalog of sources detected by the LAT above 10 GeV is referred to as the 1FHL catalog (Ackermann et al., 2013). This catalog is built using analysis which focuses on energies above 10 GeV. The number of 1FHL sources that have associations with VHE emitters detected by imaging atmospheric Cherenkov telescopes (IATCs) is 84. This is a significant portion of the 123 known VHE emitters at the time of 1FHL publication. Notably, the majority of the sources with VHE associations not included in the 1FHL catalog are spatially extended Galactic VHE sources. There are only five point-like VHE sources that are not in 1FHL catalog: the starburst galaxies NGC 253 and M82 and the blazars 1ES 0414+009, 1ES 0229+200, 1ES 1312-423. None of the aforementioned blazars fall within the SDSS DR7 survey region and therefore are not included in this study despite their VHE-detection.
We explicitly choose not to use the VHE catalog222http://tevcat.uchicago.edu/ directly in this study. The ground-based detections of VHE-emitting sources by IACTs are typically obtained through pointed observations triggered by elevated emission of a source, and therefore likely result in a high-state biased population. This bias could be misleading when looking at correlations between and the gamma-ray flux from a source, as done in Section 4. For this reason, we also remove 1ES 0806+524 from this study, the only 1FHL source within the SDSS DR7 survey region noted to display significant variability above 10 GeV.
We calculate the for all 1FHL sources in the SDSS DR7 survey region with . We also pay special attention to sources that pass a subset of cuts on gamma-ray emission properties to highlight candidate VHE sources that had not yet been detected by ground-based IACTs. The cuts were defined within the 1FHL catalog. The 1FHL sources are flagged as good VHE candidates based on three properties: (1) the flux above 50 GeV being greater than 1 ph cm-2s-1, (2) a spectral index above 10 GeV of less than 3 and (3) a measure of the source significance above 30 and 100 GeV (Sig), where TS30-100 and TS100-500 are the test statistic (TS) values333See Mattox et al. (1996) for TS definition, a statistic used in Fermi LAT source analysis. from the 30-100 GeV and 100-500 GeV energy bands.
As this VHE candidacy criteria selects all VHE-detected sources at , we refer to this population as “VHE-like” for the remainder of this work. A full list of all 1FHL sources within the SDSS DR7 survey region and that have spectroscopic redshift is provided in Table 2. Note that VHE-like source list includes both VHE-detected and VHE-candidate sources, denoted with a Y and C in column 5 of Table 2, respectively. Additionally, the 1FHL integral gamma-ray flux () and index () are also included.
| Name | RA | Dec | Redshift | VHE | F | In Void? | ||
|---|---|---|---|---|---|---|---|---|
| Detection? | [ cm-2s-1] | |||||||
| RX J1136.5+6737 | 173.939 | 67.612 | 0.13 | Y | 11.73.3 | 1.980.34 | 0.00 | No |
| PKS 0829+046 | 128.000 | 4.484 | 0.17 | N | 11.9 4.1 | 2.610.57 | 0.00 | No |
| RX J0847.1+1133 | 131.773 | 11.544 | 0.2 | Y | 9.63.6 | 1.450.39 | 0.00 | No |
| RGB J2313+147 | 348.514 | 14.769 | 0.16 | C | 10.63.8 | 1.770.39 | 0.00 | No |
| H 1426+428 | 217.158 | 42.659 | 0.13 | Y | 21.24.8 | 2.010.29 | 0.00 | No |
| PG 1437+398 | 219.835 | 39.555 | 0.35 | N | 5.92.6 | 1.790.49 | 0.02 | No |
| PKS 1509+022 | 228.064 | 2.074 | 0.22 | N | 11.14.1 | 2.980.70 | 0.03 | No |
| 1RXS J115404.9-001008 | 178.525 | -0.169 | 0.25 | N | 11.64.1 | 2.210.54 | 0.03 | No |
| PMN J1256-1146 | 194.110 | -11.77 | 0.06 | C | 11.94.1 | 2.070.44 | 0.05 | No |
| 1ES 1440+122 | 220.737 | 11.982 | 0.16 | Y | 7.83.5 | 1.770.47 | 0.20 | Yes |
| 1ES 0806+534**Removed from analysis as the single source in this study showing a Variability Index of 2, as noted in the 1FHL catalog (Ackermann et al., 2013). | 122.461 | 52.294 | 0.14 | Y | 45.3 6.7 | 2.14 0.20 | 0.21 | No |
| SBS 1200+608 | 180.807 | 60.471 | 0.07 | C | 5.32.4 | 1.630.49 | 0.25 | No |
| RBS 0958 | 169.305 | 20.227 | 0.14 | C | 23.45.4 | 1.940.28 | 0.29 | No |
| OJ 287 | 133.712 | 20.079 | 0.31 | N | 11.13.9 | 2.680.59 | 0.30 | Yes |
| MS 1458.8+2249 | 225.275 | 22.639 | 0.23 | N | 17.24.7 | 1.890.32 | 0.30 | No |
| ON 246 | 187.586 | 25.377 | 0.14 | N | 7.33.1 | 3.290.95 | 0.41 | No |
| RX J1136.8+2551 | 174.267 | 25.893 | 0.16 | C | 7.33.1 | 1.620.44 | 0.49 | Yes |
| MS 1221.8+2452 | 186.146 | 24.628 | 0.22 | C | 7.73.1 | 1.260.38 | 0.49 | No |
| BZB J1417+2543 | 214.659 | 25.658 | 0.24 | N | 8.43.4 | 2.620.70 | 0.53 | No |
| H 1013+498 | 153.773 | 49.427 | 0.21 | Y | 78.78.9 | 2.280.16 | 0.54 | Yes |
| RX J1100.3+4019 | 165.165 | 40.315 | 0.23 | C | 11.23.8 | 2.230.45 | 0.60 | Yes |
| B2 1229+29 | 187.970 | 28.824 | 0.24 | C | 28.35.9 | 2.470.33 | 0.61 | No |
| W Comae | 185.402 | 28.247 | 0.1 | Y | 34.16.4 | 2.180.26 | 0.62 | No |
| GB6 J1053+4930 | 163.403 | 49.521 | 0.14 | C | 7.7 2.9 | 1.490.37 | 0.62 | No |
| TXS 1055+567 | 164.666 | 56.459 | 0.14 | C | 44.46.5 | 2.020.19 | 0.72 | No |
| PG 1218+304 | 185.337 | 30.194 | 0.18 | Y | 57.28.6 | 1.900.18 | 0.78 | No |
| B2 1147+24 | 177.711 | 24.320 | 0.2 | N | 7.23.0 | 4.141.28 | 0.83 | Yes |
| 1ES 1215+303 | 184.460 | 30.104 | 0.13 | Y | 51.68.2 | 2.110.21 | 0.83 | Yes |
4. Results
The restrictions on the spatial location and cosmological distance limits the sources from each catalog included in this study. The number of sources within these restrictions are summarized in Table 1 for each catalog. For the 1FHL sources, Table 2 includes the of each source, as well as information on which sources reside within a void. The sources from each catalog are distributed similarly within the survey volume. More specifically, 7 of the 28 1FHL sources reside within a void (25% of 1FHL sources). Five of the 19 VHE-like sources are within voids (26%). These fractions are consistent with the fraction of SDSS quasars that are found within a void (710 of 3901; 18%). Similarly, the randomly distributed points have a 21% in-void fraction.
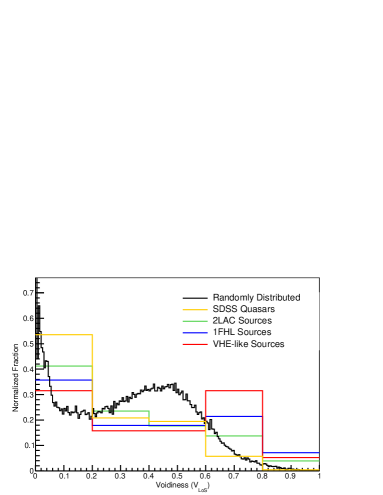
Figure 1 shows the normalized histograms of source for the various catalogs. The of the randomly generated sample of points peaks at low , with the fraction of sources decreasing with greater . Less than 1% of the randomly distributed sources show . The slight peak in the distribution of randomly generated sample points near is due to the underlying redshift distribution of the voids.
The SDSS quasars follow a pattern in the distribution that is similar to the randomly distributed sample of points. The SDSS quasars, however, have a higher fraction of sources at low (55% as compared to 42% for randomly distributed sources). The number of SDSS quasars with is less than 1%, again similar to the randomly distrubted sample of points.
| Random | SDSS | 2LAC | 1FHL | |
|---|---|---|---|---|
| Random | 1 | |||
| SDSS | 1.6(12.5) | 1 | ||
| 2LAC | 0.63 (0.5) | 0.4 (0.9) | 1 | |
| 1FHL | 0.13 (1.5) | 6.2 (1.7) | 0.83 (0.2) | 1 |
| VHE-like | 3.9 (2.1) | 1.8 (2.4) | 0.39 (0.9) | 0.999 (0.0) |
The distributions of the 2LAC sources is similar to the randomly generated and SDSS quasars, although not as steeply peaked at low . However, the 1FHL and VHE-like distributions of are dissimilar to the random distribution in shape: these distributions tend to prefer higher values of . For a more rigorous statistical test of independence between each distribution, we performed a Kolmogorov-Smirnov (KS) test, with the P-values and the corresponding significances summarized in Table 3. The VHE-like distribution is marginally different than the distribution from the randomly distributed points: we can reject the null hypothesis at the 2.1 level that these two samples are drawn from the same distribution. A similar significance holds compared to the SDSS quasars (2.4), while the 2LAC distribution is consistent with both the random and SDSS distributions (at 0.5 and 0.9, respectively). Less significant is the 1FHL distribution independence from the random and SDSS distributions at 1.5 and 1.7, respectively. It is not entirely surprising that there is no significant independence between the 2LAC, 1FHL and VHE-like distributions of as there is significant overlap among these source lists.
The results of the KS tests, and more specifically, the independence of the distributions for the VHE-like sources as compared to the randomly generated and SDSS distributions, suggest that the distribution of the VHE-like gamma-ray sources may be related to the intervening matter density in a different way than the quasar distribution. We investigate whether the level of intervening material might be related to the detection of gamma-ray emission by looking for a correlation between the and the gamma-ray flux above 10 GeV for the VHE-like sources, as shown in Figure 2. A constant fit to the versus F10 results in a of 175 for 17 degrees of freedom, not providing a good representation, especially at the higher values of .
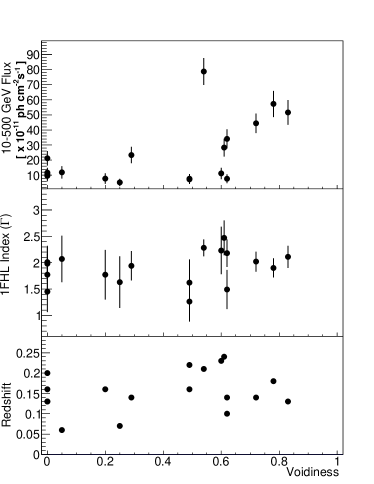
The Pearson correlation coefficient () is a measure of the linear dependence between two variables. This statistical test shows an indication of correlation between and the gamma-ray flux of the VHE-like sources above 10 GeV (F10), while there is no evidence of a correlation between and the source index or redshift. More specifically, for the VHE-like sources is 0.57 (2.4; 18 sources) for versus F10, 0.25 for versus and 0.2 for versus redshift. For the 1FHL sources, there is also a marginal correlation between and the source hard gamma-ray flux with a value of 0.47 (; 28 sources) when testing versus F10. The value is only 0.2 when testing versus and 0.0 when testing versus redshift.
5. Discussion
We present a preliminary investigation on the assumption that the EBL density is homogeneous. The indication that the projected location of extragalactic VHE-like sources is related to the intervening matter density aligns with the hypothesis that the EBL density is spatially inhomogeneous. Only the local contribution to the spatial density of EBL photons is expected to scale with the local number density of galaxies. This local contribution cannot be more than a small fraction of the total EBL, which mostly arises from distant sources. Each spherical shell around any point contributes approximately equally, since the fall-off of light is compensated by the increase in area; contributions from higher redshifts suffer from redshifting and dilution by the expansion of the universe. However, since the opacity is an integral along the entire line of sight from a blazar, even a relatively small decrease in the local EBL density could have a cumulative effect sufficient to affect the total gamma-ray opacity significantly. This could remove the motivation to exploit scenarios that utilize secondary VHE emission produced along the line of sight or hypothetical axion-like particles to describe the VHE spectral flattening of the intrinsic emission from distant VHE gamma-ray sources such as PKS 1424+240.
Motivated by the apparent correlation between VHE-like sources and the fraction of void-space along the line of sight, we use another component of the public void catalog that extends to (derived from the SDSS DR9 survey region) to investigate the of the exceptionally distant VHE-detected sources PKS 1424+240 at and PG 1553+113 at . Both of these sources are within the SDSS DR7 and DR9 survey regions and are noted in the 1FHL catalog as VHE detected sources that display VHE-like gamma-ray flux qualities. Under the assumption that the sources are located at the redshift lower limits, we find the for PKS 1424+240 and PG 1553+113 are 0.74 and 0.63, respectively. Due to the use of an additional void catalog in the calculation of the for these sources, we do not include these sources in the statistical tests performed on the full catalogs, but the relatively high values of for each are consistent with our findings from the DR7 survey region alone.
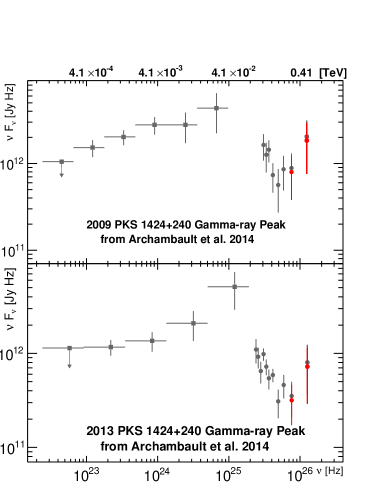
We estimate the change in opacity for extragalactic VHE photons traveling along lines of sight that intersect many voids through the investigation of an extreme case. With the simplifying assumption that a gamma-ray emitting source lies along a sightline surrounded by a 50 Mpc radius tunnel that is devoid of galaxies, we find that the EBL density within this tunnel is only about 2% lower than the nominal EBL density, as predicted indepencdently by both the Gilmore et al. (2012) and Domínguez et al. (2011a) models. The effect on the attenuation of gamma rays will be slightly larger than 2% since the attenuation for gamma rays is derived from the exponent . More specifically, the attenuation decreases by approximately , where represents the percentage decrease in EBL density. For example, for an opacity of , as probed through the detection of PKS 1424+240 at the highest gamma-ray energies, the decrease in attenuation scales by roughly 5 2%=10%. This is not sufficient to account for the marginal spectral hardening which appears in the intrinsically emitted VHE spectrum above GeV. The red symbols in Figure 3 represent the intrinsic spectrum for the decreased attenuation estimated to result from a 2% decrease in EBL density. The results of the calculations suggest that the anisotropic location of VHE-like sources with respect to intervening voids cannot be entirely accounted for by a lower EBL photon density inside a void as compared to outside a void.
An alternative explanation of the distribution of extragalactic VHE-like sources is dependent on the magnitude of the magnetic field within intervening voids. Proposed astrophysical mechanisms for generating large-scale magnetic fields predict little magnetic flux inside void regions (Beck et al., 2013), while primordial generation mechanisms can create arbitrarily large void magnetic fields, though the latter mechanisms are somewhat constrained by CMB polarization observations (see Carilli & Taylor 2002 for a review). With a low intervening magnetic field within voids, the pair cascades resulting from EBL and VHE photon interaction and/or cosmic ray interaction would remain close to the direct line of sight. The pairs will often have sufficient energy to upscatter CMB and EBL photons to gamma-ray energies, as described in Neronov & Vovk (2010). Observation of gamma-ray variability above and below the gamma-ray opacity of 2 can be used to test the feasibility of secondary cascade emission contributing a significant portion of the observed gamma-ray flux.
In summary, this work shows preliminary but intriguing indications for a non-trivial relationship between the properties of VHE-like sources and the line-of-sight void intersection. The investigation of the distribution of sources as related to the fraction of intervening underdense regions hints that VHE-like sources are located preferentially along underdense lines of sight. This same correlation does not appear for randomly distributed points, SDSS quasars or lower-energy gamma-ray AGN. Moreover, the percentage of sources that fall within voids is consistent across the randomly distributed, SDSS quasar, 2LAC, 1FHL and VHE-like populations. In other words, all source types are distributed in a similar fashion within the cosmic web, but only VHE-like sources are correlated on the sky with low-density lines of sight. Expanding this study to include more sources and voids will take years of observational effort but is likely necessary to determine if the marginal correlation found here is a statistical fluctuation. The results presented here, not accounted for by regions of lower EBL density, suggest that VHE-detection of extragalactic sources may not solely depend on the intrinsic VHE emission from a source, but instead depends on a convolution of the source VHE emission and location within the cosmic web.
References
- Abramowski et al. (2013) Abramowski, A., Acero, F. Aharonian, F. et al., 2013, A&A, 550, 4
- Ackermann et al. (2013) Ackermann, M., Ajello, M., Allafort, A. et al. 2013, accepted for publication in AJS, arXiv:1306.6772
- Ackermann et al. (2012) Ackermann, M., Ajello, M., Allafort, A. et al. 2012, Science, 338, 1190
- Ackermann et al. (2011) Ackermann, M., Ajello, M., Allafort, A. et al. 2011, ApJ, 743, 171
- Aharonian et al. (2006) Aharonian, F., Akhperjanian, A. G., Bazer-Bachi, A. R. et al. 2006, Nature, 440, 1018
- Albert et al. (2008) Albert, J., Aliu, E., Anderhub, H. et al. 2008, Science, 320, 1752
- Archambault et al (2014) Archambault, S., Aune, T., Behera, B. et al. 2014, ApJL, 785, 16
- Atwood et al. (2009) Atwood, W. B., et al. 2009, ApJ, 697, 1071
- Barnacka et al. (2014) Barnacka, A., Böttcher, M. & Sushch, I. 2014, arXiv: 1404.4422
- Beck et al. (2013) Beck, A. M., Hanasz, M., Lesch, H., Remus, R.S. & Stasyszyn, F. A. 2013, MNRAS, 429, 60
- Becherini et al. (2012) Becherini, Y., Boisson, C., & Cerruti, M. 2012, AIP Conference Series, 1505, 490
- Chadwick & Harris (2014) Chadwick, P. M. & Harris, J. 2014, arXiv:1405.3227
- Carilli & Taylor (2002) Carilli, C. L., & Taylor, G., B. 2002, ARA&A, 40, 319
- Coleman (1989) Coleman, R., 1989, 17, 27
- Dolag et al. (2009) Dolag, K. et al., 2009, ApJ, 703, 1078
- Domínguez et al. (2011b) Domínguez, A., Sanchez-Conde, M. & Prada, F. 2011b, JCAP, 11, 020
- Domínguez et al. (2011a) Domínguez, A., Primack, J., Rosario, D. J. et al. 2011a, MNRAS, 410, 2556
- Domínguez et al. (2013) Domínguez, A., Finke, J. D., Prada, F., Primack, J. R. et al. 2013, ApJ, 770, 77
- Eisenstein et al. (2001) Eisenstein, D. J. et al. 2001, AJ, 122, 2267
- Essey & Kusenko (2010) Essey, W. & Kusenko, A. 2010, Astropart. Phys. 33, 81
- Franceschini et al. (2008) Franceschini, A., Rodighiero, G. & Vaccari, M. 2008, A&A, 487, 837
- Furniss et al. (2013) Furniss, A., Williams, D. A., Danforth, C. et al. 2013, ApJL, 768, 31
- Gilmore et al. (2012) Gilmore, R., Somerville, R., Primack, J. & Dominguez, A. 2012, MNRAS, 422, 3189
- Gould & Shréder (1967) Gould, R. J. & Shréder, G. 1967, Phys. Rev. 155, 1408
- Hauser & Dwek (2001) Hauser, M. & Dwek, E. 2001, ARA&A, 39, 249
- Horns & Meyer (2012) Horns, D. & Meyer, M. 2012, JCAP, 2, 33
- Kaiser, N. (1984) Kaiser, N. 1984, ApJL, 284, L9
- Mattox et al. (1996) Mattox, J. et al. 1996, ApJ, 461, 396
- Meyer et al. (2012) Meyer, M., Raue, M., Mazin, D. & Horns, D. 2012, A&A, 542, 59
- Meyer et al. (2014) Meyer, M., Montanino, D. & Conrad, J. 2014, arXiv:1406.5972
- Neronov & Vovk (2010) Neronov, A. & Vovk, I. 2010, Science, 328, 73
- Neyrinck, M. C. (2008) Neyrinck, M.C. 2008, MNRAS, 386, 2101
- Nikishov (1962) Nikishov, A. I. 1962, JETP, 14, 393
- Platen et al (2007) Platen, E., van de Wygaert, R. & Jones, B., 2007, MNRAS, 380, 551
- Rubtsov & Troitsky (2014) Rubtsov, G. I. & Troitscky, S.V. 2014, arXiv: 1406.0239
- Schneider et al. (2010) Schneider et al. 2010, AJS, 139, 2360
- Sutter et al. (2012a) Sutter, P. M., Lavaux, G., Wandelt, B. D. & Weinberg, D. H. 2012a, ApJ, 761, 44
- Sutter et al. (2013) Sutter, P. M., Lavaux, G., Wandelt, B. D., Weinberg, D. H., & Warren, M. S. 2013, MNRAS, 438, 3177
- Sutter et al. (2014) Sutter, P. M. et al. 2014, in prep
- Strauss et al. (2002) Strauss, M. A. et al. 2002, AJ, 124, 1810
- Tavecchio et al. (2014) Tavecchio, F., Roncadelli, M. & Galanti, G. 2014, arXiv:1406.2303