THE ENIGMA OF THE OPEN CLUSTER M29 (NGC 6913) SOLVED
Abstract
Determining the distance to the open cluster M29 (NGC 6913) has proven difficult, with distances determined by various authors differing by a factor of two or more. To solve this problem, we have initiated a new photometric investigation of the cluster in the Vilnius seven-color photometric system supplementing it with available data in the BV and JHKs photometric systems, and spectra of the nine brightest stars of spectral classes O and B. Photometric spectral classes and luminosities of 260 stars in a 15 15 area down to = 19 mag are used to investigate the interstellar extinction run with distance and to estimate the distance of the Great Cygnus Rift, 800 pc. The interstellar reddening law in the optical and near-infrared regions is found to be close to normal, with the ratio of extinction to color excess = 2.87. The extinction of cluster members is between 2.5 to 3.8 mag, with a mean value of 2.97 mag or = 1.03. The average distance of eight stars of spectral types O9–B2 is 1.54 0.15 kpc. Two stars from the seven brightest ones are field stars: HDE 229238 is a background B0.5 supergiant and HD 194378 is a foreground F star. In the intrinsic color-magnitude diagram, seven fainter stars of spectral classes B3–B8 are identified as possible members of the cluster. The 15 selected members of the cluster of spectral classes O9–B8 plotted on the vs. diagram, together with the isochrones from the Padova database, give the age of the cluster as 5 1 Myr.
1 INTRODUCTION
Despite its impressive appearance, similar to a tiny Pleiades, the cluster M29 (NGC 6913) is a difficult object to understand. A glance at a deep exposure in blue or red filters shows that it is located in a small more transparent bay of a huge system of dark clouds known as the Great Cygnus Rift. The most prominent in the cluster are seven stars with magnitudes 8.6–10.2, located within 5 arcmin: HD 194378, HDE 229221, HDE 229227, HDE 229234, HDE 229238, HDE 229239 and BD+38 4067. All of them are of O9–B0 spectral classes, except for HD 194378 which is a known foreground F star.
The first evaluations of the cluster members and their distances were quite uncertain due to the low accuracy of photographic photometry, the lack of spectral and luminosity classifications and of insufficient calibration accuracy of the photometric data (Zug, 1933; Becker & Stock, 1948; Tifft, 1958). Tifft concluded that the cluster looked like it consisted of two groups at different distances – 1.6 and 2.1 kpc. The brightest M29 stars were first classified in the MK system by Roman (1951); Morgan et al. (1953, 1955); Morgan & Harris (1956) and Hiltner (1956).
The next study of M29 was done by Hoag et al. (1961) combining photoelectric and photographic UBV photometry. For the distance determination a versus diagram for B-type stars was used (Johnson, 1960). Intrinsic values were found from the reddening-free parameters , thus spectral types were not used. The mean extinction = 3.21 mag and a distance of 1.15 kpc were found by Johnson et al. (1961). However, no explanations were given for how the cluster members were selected, and no mention of the group of the brightest stars of spectral types O9–B0 was given. It seems that these stars were ignored.
A few years later, Hoag & Applequist (1965) and Walker & Hodge (1968) obtained H line photoelectric photometry of the brightest stars of M29 calibrated in absolute magnitudes. The distances to these stars were found to be much smaller than their spectroscopic distances. Crawford et al. (1977) using uvbyH photometry found a similar result: the distances to the brightest stars calculated with the absolute magnitudes , obtained from calibration of H absorption, were half of their spectroscopic distances. All this means that for the brightest M29 stars something was wrong either with their MK luminosity classes, or with the calibration of the hydrogen line strengths in luminosities.
Two subsequent investigations were aimed at increasing the number of stars in the vicinity of M29 with UBV photometry and MK spectral types. Joshi et al. (1983) have observed in UBV 103 stars covering the 40 40 area for which the cluster membership probabilities from proper motions were estimated by Sanders (1973). Later on, most of these stars were classified in the MK system by Wang & Hu (2000) from low-resolution spectra.
The first versus HR diagram of M29 was obtained by Massey et al. (1995). Since the MK types were known only for the five brightest stars, other B and A stars were classified approximately by their parameters. The age of the cluster from the comparison with isochrones, 4–6 Myr, mostly rests on the five brightest stars accepting their distance at 2.2 kpc. Later on, Liu et al. (1989) and Boeche et al. (2004) found that most of these stars are spectroscopic binaries exhibiting periodic variations of radial velocities.
From our review of photometric and spectroscopic investigations of M29 we conclude that the previous selection of cluster members is in question. Looking along the Local spiral arm, the early-type stars can be found at all possible distances, up to the edge of the arm at 4–5 kpc. Thus, the spectral class of a star without additional information about its distance is of little value for membership estimation. The MK typing of stars should be helpful but, unfortunately, discrepancies among luminosity classes of O9–B0 stars are substantial. The reddening-free parameter applied in some studies to identify B-type stars does not give luminosities, thus it is useless in estimating the membership. Also, a B-type star sample, selected in this way, can be contaminated by A and F stars. Proper motions of stars, used in some investigations as the membership criteria, in the direction along the Local spiral arm are too small to be useful at large distances. All these considerations lead to the conclusion that until now the cluster membership is the main problem which prevents determining an accurate distance to M29 and its age.
With the aim to identify more early-type stars in the direction of M29 and to get more confident information about their luminosities and distances, we decided to undertake a new investigation of the cluster in the Vilnius seven-color photometric system which allows classification of most types of stars in spectral class and luminosity in the presence of variable interstellar reddening. Unfortunately, the system is not sufficiently sensitive to luminosities for the stars of spectral classes O–B0, thus we are not able to verify luminosity classes of the brightest stars of M29. Therefore we decided to obtain new medium resolution spectra of these stars in order to verify their luminosity classes.
2 SEVEN-COLOR PHOTOMETRY AND
CLASSIFICATION
The results of CCD photometry in the Vilnius seven-color system, published by Milašius et al. (2013, hereafter Paper I), cover a 1.5 square degree area centered on the cluster at RA (J2000) = 20h 24.0m, DEC (J2000) = +38 30. Magnitudes and colors were determined for 1752 stars down to = 19.5 mag. However, the limiting magnitudes are not uniform in the whole area since three telescopes of different apertures and field sizes were used. The faintest stars have been measured in the central 13 13 area observed with the 1.8 m VATT telescope on Mt. Graham. A larger circular area with a 22 diameter was observed with the 1 m telescope at the USNO Flagstaff Station down to a limiting magnitude of 17 mag. The largest 1.25 square area was observed with the 35/51 cm Maksutov-type telescope of the Molėtai Observatory in Lithuania with a limiting magnitude of 15 mag. The magnitudes and colors of stars observed with the two or three telescopes were averaged. Standard stars used for the present photometry were observed in the Vilnius system photoelectrically by Kazlauskas & Jasevičius (1986).
The photometric data were used to classify about 70 % of stars in spectral and luminosity classes and peculiarity types. The results of the classification are given in Paper I.
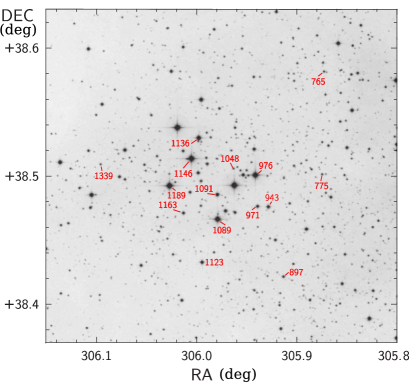
For this investigation of the cluster we used the stars only in the central 15 15 area (Figure 1) which have been measured and classified to the faintest limiting magnitude.
| Paper I | HD, BD | Spectral type [Reference] | kpc | ||
| 943 | – | B2 V, SB [5]; B2 V [6] | 11.77 | 2.83 | 1.34 |
| 976 | 229221 | B0 II:e [1], B0pe [2], Be [3], B0.2 IIIe [4], B0 IIIe [5], B0:pe [6] | 9.22 | 3.41 | 1.45 |
| 1089 | 229227 | B0 III [1], B0 II [2], B0.2 III [3], O9.7 III [4], B0 V [5], O9.7 III(n) [6] | 9.34 | 3.06 | 1.80 |
| 1091 | – | B3 V [6] | 11.41 | 3.10 | 1.52 |
| 1123 | – | B1-1.5 V [6] | 11.91 | 3.83 | 1.64 |
| 1136 | +38 4067 | B0.2 III [3], B0 Ib/II [5], B0.5-0.7 V [6] | 10.20 | 3.00 | 1.55 |
| 1146 | 229234 | O9 II [1], O9.5 III [2], O9 If [3], O9 II [4], O9 Ib, SB [5], O9 III [6] | 8.91 | 3.03 | 1.64 |
| 1173 | 229238 | B0.5 II [1], B0.5 Ib [2], B0 I [3], B0.2 II [4], B0 I/II, SB [5], B0.5 Ia [6] | 8.86 | 3.10 | 3.56 |
| 1189 | 229239 | B0.5 IIe [1], B1 Iab [2], B0.5 IV [3], B0.2 III [4], B0 I, SB [5], B0.2 III [6] | 8.90 | 3.26 | 1.34 |
| References — [1] Roman (1951); [2] Morgan et al. (1953, 1955); [3] Massey et al. (1995); [4] Negueruela (2004); [5] Boeche et al. (2004); [6] This paper. | |||||
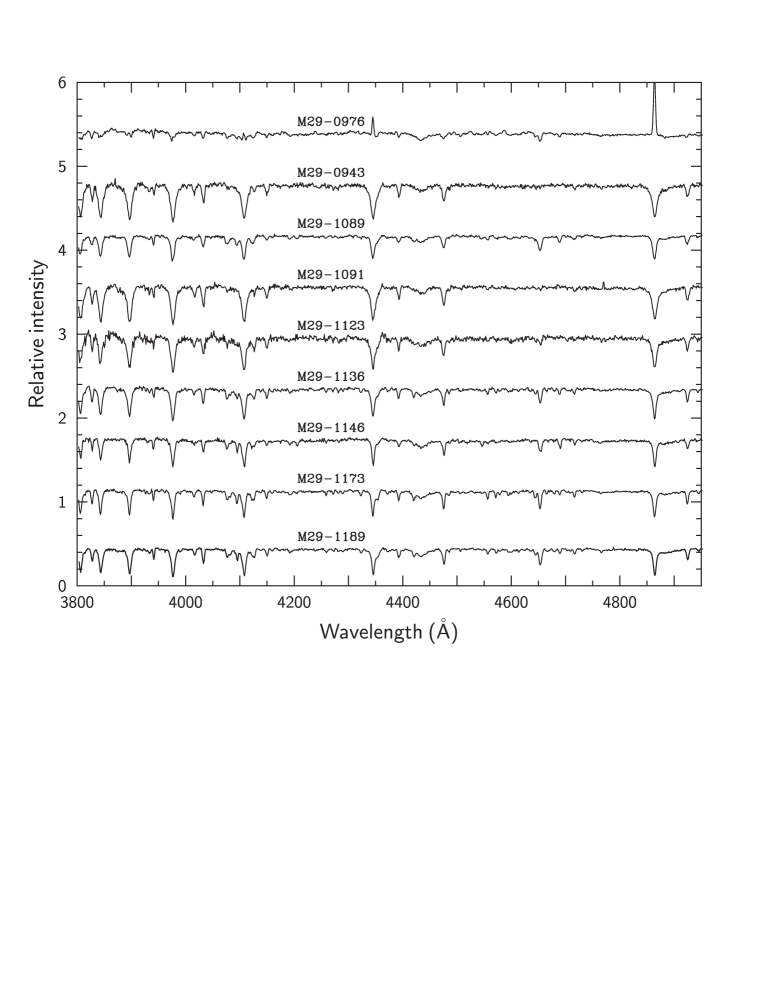
The spectra of the nine brightest stars (Figure 2) were obtained with the 1.22 m telescope at the Asiago Observatory, equipped with a B&C spectrograph and a 600 lines/mm grating providing a dispersion of 1.17 Å/pix and a resolving power of FWHM (PSF) = 2.1 pix. The detector was an ANDOR iDus DU440A CCD with the 2048 512 array and 13.5 m square pixels. The recorded wavelength range covers 3487–5885 Å. The nearby standard HR 8004 was used for the flux calibration. Data reduction in IRAF followed strictly the procedures in Zwitter & Munari (2000), and involved all classical steps of correction for bias, dark, flat, sky background and instrumental response. Spectral classification in the MK system was carried out by one of us (NRW) using the standards from Walborn & Fitzpatrick (1990) and Sota et al. (2011). The classification results with comments are given below and in Table 1 which also gives the results of spectral classifications of other authors, based only on the slit spectra with the resolution comparable or higher than that used for establishing the MK system, 125 Å/mm at H (Morgan et al., 1943).
Star 1089: O9.7 III(n). The ratio He II 4541 / Si III 4552 1 defines the spectral class. The ratio He II 4686 / He I 4713 defines luminosity class, in reasonable agreement with Si IV / He I near H which have broad lines. The 4686 / 4713 ratio 1 would correspond to luminosity class II at this type, whereas it should be larger than it is for luminosity V. This ratio changes very rapidly between spectral classes late O and B0, no doubt contributing to discrepancies in previous classifications. The broadening parameter is approximate, in the absence of standards.
Star 1136: B0.5–0.7 V. The ratio Si IV 4089 Si III 4552 for spectral class. Luminosity class is based on He II 4686 He I 4713 at such a late type. O II and C III would favor a brighter luminosity class, but the helium line at 4686 disallows this. Of course, if composite (a possible interpretation), the classification is a compromise.
Star 1146: O9 III. The ratios He II 4541 He I 4387 and He II 4200 He I 4144 define the spectral class. The ratio He II 4686 / He I 4713 defines luminosity class; the same remarks as for star 1089 above (except for good line quality here).
Star 1173: B0.5 Ia. Good match with Ori in all criteria.
Star 1189: B0.2 III. Criteria the same as above. Again, the fine divisions in spectral class are important, because if they are off, the luminosity class will be wrong since those criteria also evolve with the spectral classes.
The rest of the stars are classified with less confidence:
Star 943: B2 V.
Star 976: B0:pe. The absence of clear 4200 and 4541 eliminates earlier types, while C III 4650 and He II 4686 disfavor later ones. Luminosity classification is not realistic due to emission lines.
Star 1091: B2 V.
Star 1123: B1-1.5 V.
Luminosity classification at late-O and early-B types is difficult, because the luminosity criteria change very rapidly with spectral type, so that small errors (or uncertainties) in the latter entail large errors in the former and in the derived absolute magnitudes. New interpolated spectral types have been introduced to alleviate this problem (Sota et al., 2011, 2014). Also, there are some spectra with discrepancies between the Si IV / He I and He II / He I luminosity criteria, the resolution of which becomes arbitrary. Some of these problems are no doubt related to the endemic multiplicity of massive stars, in terms of both composite spectra and binary evolution. These issues likely contribute to discrepancies among different classifiers. They are extensively discussed by Walborn et al. (2014).
3 INTERSTELLAR REDDENING LAW
For the photometric classification of stars in the Vilnius system by interstellar reddening-free -parameters, the normal interstellar extinction law (see Straižys, 1992) was applied. Since in the literature some authors discuss possible peculiarities of the reddening law in Cygnus, we have decided to verify the law by determining the slope of the interstellar reddening line in the – vs. – diagram of the 2MASS system (Skrutskie et al., 2006) and the ratios of color excesses where are the near-infrared magnitudes , and .
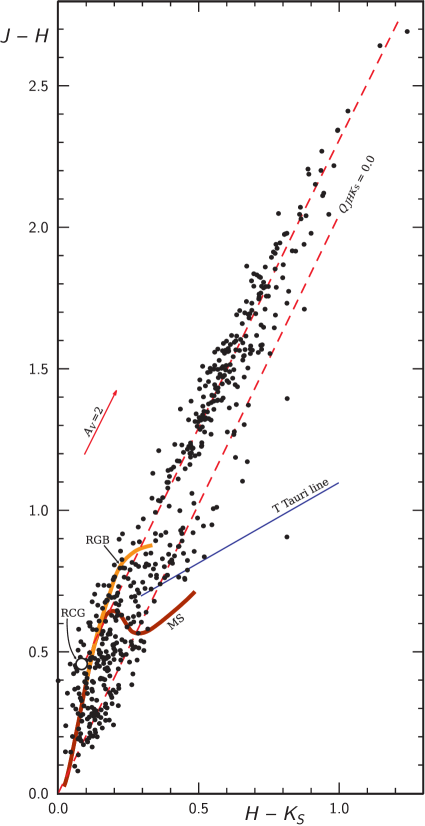
In the 15 15 area centered on M29 we selected 532 stars with , , accuracies of 0.05 mag. In Figure 3 we plot the – versus – colors for these stars, the intrinsic positions of the main sequence, red giant branch and red clump giants (RCGs, central helium-burning stars) from Straižys & Lazauskaitė (2009). Also, the intrinsic line of the classical T Tauri stars from Meyer et al. (1997) and the reddening line for = 0.0 are shown. The classical T Tauri stars usually are located within the angle formed by these two lines. The reddened RCGs, together with normal (hydrogen-burning) red giants of spectral classes G5 to M5, form a common belt with a width of – = 0.15 mag, see Straižys & Laugalys (2009). However, in this belt the RCGs should dominate since they outnumber by a factor of 10 the space density of normal giants (Perryman et al., 1995, 1997; Alves, 2000).
In Figure 3, the reddening line of RCGs (with a certain amount of normal giants) can be drawn through their intrinsic position (the large open circle) and the middle of the belt above – = 1.0 (the broken line). We did not take stars in the belt lower than – = 1.0 since they are contaminated by stars of other luminosities with small reddenings. The slope of this line for 210 stars is = 2.044 0.080. This slope is quite close to the normal value 2.0 found in other galactic longitudes (Straižys et al., 2008; Straižys & Laugalys, 2008). Thus, we will consider that in the direction of M29 the interstellar reddening law in the near infrared wavelengths is close to normal.
Another test of the extinction law in the investigated area is the application of the ratio of color excesses , and with the , and magnitudes from 2MASS. For this aim we used a list of B and A stars identified in the central 15 15 area. Their and – data were taken from Massey et al. (1995) and the AAVSO APASS survey, DR7111 http://www.aavso.org/apass, and the near-infrared magnitudes from 2MASS. The ratios of color excesses were calculated separately for the Massey et al. (1995) and the APASS data and then transformed to the ratios = / with the equations from Fitzpatrick (1999). The average value of is found to be 2.87 0.16, i.e., it is somewhat lower than a normal value of 3.15. This lower value corresponds to = 3.83 in the Vilnius system (the normal value is 4.16).
According to Fitzpatrick & Massa (2007), there is no unique relation between the ratio and the slope of the ultraviolet part of the extinction law. Thus, the lower value of found in the area does not mean that the ratio of ultraviolet to visual color indices (for example ) should be also abnormal. To verify this, for photometric classification of stars in the area with interstellar reddening-free -parameters we have applied the ratios of color excesses corresponding both to the normal and the so-called ‘Cygnus’ law, with a somewhat smaller change of slope near the ‘knee’ of interstellar extinction law at 4350 Å. The classification errors of individual stars were found to be lower in the case of the normal law.
4 INTERSTELLAR EXTINCTION
The 1.5 square degree area investigated in Paper I exhibits a very uneven density distribution of faint background stars since in this direction the line of sight is close to the edge of the Great Cygnus Rift dust clouds. The left side of the area is covered by the Rift clouds, and the right upper (northwestern) part of the area is the most transparent. The central area around the cluster and the lower part of the area exhibit an intermediate (although quite variable) obscuration. In the present paper we investigated the extinction only in the 15 15 area centered on the cluster.
For the stars classified in the MK system, color excesses, extinctions and distances were calculated with the equations
| (1) |
| (2) |
| (3) |
where and are the intrinsic color indices and absolute magnitudes for the corresponding MK types from Straižys (1992), with a correction of –0.1 mag to absolute magnitudes, adjusting their scale to the new distance modulus of the Hyades, = 3.3 (Perryman et al., 1998). To calculate color excesses for O–B3 stars, spectroscopic MK types from the present paper were used (see Table 1 in section 2). For other stars photometric spectral and luminosity classes were applied.
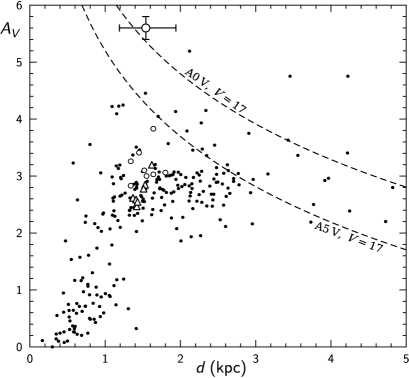
In Figure 4 we show the plot of the extinction vs. distance in kpc for 260 stars in the 15 15 area classified in the Vilnius system. The two curves in the upper right part of the diagram exhibit the limiting magnitude effect for A0 V and A5 V stars at = 17 mag. We accepted this limiting magnitude because for fainter stars the number of stars with two-dimensional classification sharply decreases. These curves explain why the stars with high reddenings at large distances are absent. For example, above the curve corresponding to A0 V stars, only a few luminosity IV stars fainter than = 17 mag have been observed and classified. The maximum (3) error cross is plotted at = 1.54 kpc, the distance to the cluster which will be estimated in the next section. It corresponds to the distance errors for = 0.5 and the extinction errors 0.2 mag.
The distribution of stars in Figure 4 shows a steep increase of extinction at about 500–600 pc to a value of 3.5 mag. No doubt, this jump is related to the cloud system of the Great Cygnus Rift. In reality, the clouds are more distant than this rise of the extinction, because of the negative distance errors of stars and the presence of stars with the unresolved binarity. A typical error of absolute magnitude for B, A and F stars of luminosity classes V–III, corresponding to one luminosity class, is about 0.5, and this makes scatter of the calculated distances of stars to both sides by a factor of 1.26. This means that the distances of reddened stars, located apparently at 500 pc, must be multiplied by 1.26 to get the real distance of the cloud, 630 pc.
Another effect, which causes the shortward scatter of the apparent distances, is the unresolved binarity. If both components of such a binary are of the same luminosity, the real distance of the binary should be larger by a factor of 1.41. This shifts the stars from 500 pc to 705 pc. If the luminosity difference of the components is larger, the expected shift will be smaller. If the unresolved binary has an additional shift shortwards due to the negative luminosity error, the real distance to the front side of the cloud must be increased by a factor of 1.26 1.41 = 1.78. In this case the real distance of the front side of the cloud is 500 1.78 = 890 pc. The conclusion is that the front side of the cloud is somewhere between 700 and 900 pc.
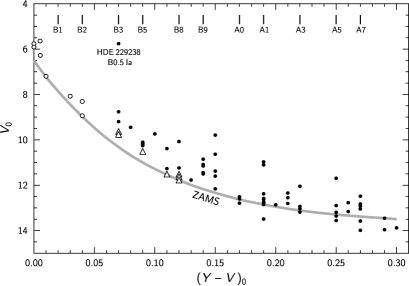
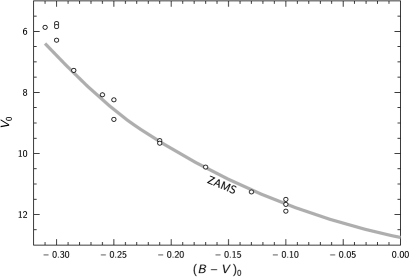
Figure 4 shows that the majority of stars concentrate in a relatively narrow band of between 2.4 and 3.2 mag. This means that behind the clouds of the Great Cygnus Rift, located at about 700–900 pc, the space is more or less free of dust, and this allows seeing stars up to 3 kpc with about the same extinction. The selected 15 cluster members (see Table 2 in Section 6) shown as open circles and triangles are located at apparent distances from 1.35 to 1.80 kpc. The extinction values of these 15 stars are very different (from 2.5 to 3.8 mag), the average value is 2.97 mag, which corresponds to = 1.03.
5 THE INTRINSIC COLOR-MAGNITUDE
DIAGRAM
Since the age of M29 is expected to be of the order of a few million years, its color-magnitude diagram should contain ZAMS stars only in the B star range. The stars of lower masses should be on pre-main-sequence evolutionary tracks. The massive stars of early B subclasses are expected to show evolutionary deviations from the ZAMS.
For the determination of the cluster age, we must know which stars are the cluster members and what is their distance. If the cluster has sufficiently abundant population representing a broad range of color indices, its distance can be easily estimated by fitting the ZAMS line to the lower envelope of the main sequence in the intrinsic (dereddened) color-magnitude diagram. However, the population of M29 is rather poor, and its main sequence in the color-magnitude diagram cannot be well distinguished from the field B–A stars located in the foreground and background.
The most natural way for determining the distance to M29 would be the use of the group of six brightest stars without which the cluster would be hardly recognizable. Unfortunately, as it was mentioned above, these stars are very problematic since their spectral types (especially luminosity classes) determined by different authors show considerable discrepancies, see Table 1.
For further analysis of the cluster, the spectral and luminosity classes determined from our spectra by NRW were adopted. The extinctions and distances for these stars are given in the last two columns of Table 1. The absolute magnitude calibration of MK types was taken from Straižys (1992); the star 943 was considered as a ZAMS star, and for the emission-line star 976 the luminosity class III was accepted. The ratio = / = 3.83, corresponding to = / = 2.87, was applied (see Section 3).
Table 1 shows that almost all early B-stars in M29, except HDE 229238, exhibit similar distances, between 1.34 and 1.80 kpc, their mean value is 1.54 0.15 kpc (standard deviation). The errors of absolute magnitude, mag, at 1.54 kpc give the distance errors –0.32 kpc and +0.40 kpc. Since individual distances of the eight stars are contained within the distance error bars, we will consider them being located at a mean distance of 1.54 kpc which corresponds to the true distance modulus 10.94 mag.
Our next step is directed to estimate if more stars of cooler spectral types, B3–B8, located in the color-magnitude diagram close to the ZAMS, are present in the area within the same distance range (1.22–1.94 kpc). In Figure 5 we plot the intrinsic diagram vs. (–)0 for stars of spectral classes O, B and A in the 15 15 area centered on the cluster. The ZAMS line shown is based on the Kazlauskas et al. (2006) table with small corrections originating from the PARSEC isochrones up to 12 (Bressan et al., 2012). The ZAMS line was extrapolated to larger masses (O8–B1 stars) with the older Padova isochrones (Bertelli et al., 1994; Girardi et al., 2002).
The five brightest stars with between 8.9 and 9.3, defining the visible cluster (after exclusion of the foreground star HD 194378) are located in the left upper corner of the diagram, close to – = 0 and between 5.6 and 7.2 mag. Most of them are slightly above the ZAMS line.
In identifying possible ZAMS stars of the cluster with – 0.03 ( B1) we should be cautious since these stars can be confused with the foreground and background field stars. Among the stars lying within 0.5 mag from the ZAMS and classified as luminosity V or IV-V stars we have identified seven stars: 971 (B3), 1163 (B3), 897 (B5), 1339 (B7), 765 (B8), 775 (B8) and 1048 (B8). These stars (triangles in Figure 5) may also be cluster members, however, some of them can be unresolved binaries deviating upward from their single star positions. Taking their values for ZAMS, we get their distances from 1.37 kpc to 1.62 kpc, which within the errors are in agreement with the above estimated distance of M29 at 1.54 kpc. Luminosity classes of some of these stars from photometric classification have been obtained as V-IV, but this is not an argument against their attribution to ZAMS due to possible errors of colors and -parameters used in the classification. The cluster stars cooler than B8 are not expected to be close to the ZAMS line since for an age of the order of 5 Myr they should be pre-main-sequence objects. Some of them can be field stars.
The results reported above were based on Vilnius seven-color photometry. We have also verified if the same results can follow taking the observational data from the B,V photometric system. Table 2 contains 14 stars measured in UBV by Massey et al. (1995). The missing BV data for the star 1339 were taken from Hoag et al. (1961). Their color excesses were calculated with the intrinsic colors from Straižys (1992). The ratio = 2.87, determined in Section 3, has been applied. The resulting intrinsic color-magnitude diagram vs. (–)0 is shown in Figure 6. Here the ZAMS line is defined by combining the Padova isochrones for 1 and 10 Myr, and accepting the distance modulus – = 10.94. It is evident that the positions of stars in this diagram and the vs. diagram (Figure 5) are very similar. The stars between spectral classes B3 anf B8 lie close to the ZAMS while O9–B2 stars deviate to higher luminosities. Consequently, the two independent photometric datasets confirm that the cluster distance is really close to 1.5 kpc.
6 THE PHYSICAL HR DIAGRAM
No. Sp kpc BC 765 14.18 b8 Vz 0.12 0.68 2.60 11.58 0.90 1.37 -0.55 4.06 1.85 96 775 14.12 b8 Vz 0.12 0.64 2.45 11.67 0.90 1.42 -0.55 4.06 1.82 95 897 13.12 b5 Vz 0.09 0.67 2.57 10.55 -0.20 1.41 -1.30 4.19 2.56 88 95 943 11.77 B2 V, SB 0.04 0.74 2.83 8.94 -1.70 1.34 -2.20 4.36 3.57 95 971 12.21 b3 Vz 0.07 0.66 2.53 9.68 -1.10 1.43 -1.85 4.29 3.13 77 96 976 9.22 B0 IIIe 0.00 0.89 3.41 5.81 -5.00 1.45 -2.95 4.50 5.12 83 97 1048 14.65 b8 Vz 0.12 0.74 2.83 11.82 0.90 1.53 -0.55 4.06 1.76 82 1089 9.34 B0 III, SB 0.00 0.80 3.06 6.28 -4.10 1.80 -2.95 4.50 4.93 79 97 1091 11.41 b2 V 0.04 0.81 3.10 8.31 -2.60 1.52 -2.20 4.36 3.82 42 94 1123 11.91 B1.5 V 0.03 1.00 3.83 8.08 -2.05 1.64 -2.40 4.39 3.99 87 96 1136 10.20 B0.5 V 0.01 0.78 3.00 7.20 -2.80 1.55 -2.95 4.46 4.56 83 96 1146 8.91 O9 III, SB 0.00 0.79 3.03 5.88 -5.20 1.64 -3.15 4.52 5.17 78 97 1163 12.56 b3 Vz 0.07 0.72 2.76 9.80 -1.10 1.51 -1.85 4.29 3.08 88 96 1189 8.90 B0 III, SB 0.00 0.85 3.26 5.64 -5.00 1.34 -2.95 4.50 5.19 72 97 1339 14.73 b7 Vz 0.11 0.83 3.18 11.55 0.50 1.62 -0.80 4.11 1.96 96
The possible members of M29 of spectral classes O9–B8 are listed in Table 2. Figure 7 shows the vs. diagram for these stars considering that they are located at 1.54 kpc ( = 10.94). The isochrones plotted for the ages 1, 5, 6 and 7 Myr are taken from the Padova database of stellar evolutionary tracks and isochrones for the solar metallicity (=0.014, Asplund et al., 2009)222 http://stev.oapd.inaf.it/cgi-bin/cmd. The isochrones and the ZAMS line correspond to the basic set of the Padova isochrones up to the masses 120 (Girardi et al., 2002). Luminosities of stars in solar units were calculated with the equation
where is the apparent magnitude of the star, is its absolute bolometric magnitude, = 4.72 is the bolometric absolute magnitude of the Sun, is the bolometric correction, and is the true distance modulus of the cluster. The extinctions were determined with Eq. (2). The in Figure 7 is taken as 10.94, which corresponds to a distance of 1.54 kpc. The effective temperatures and bolometric corrections were taken according to their spectral types from Straižys (1992). This scale for B-stars is close to those given by Flower (1996); Bessel et al. (1998) and Torres (2010).
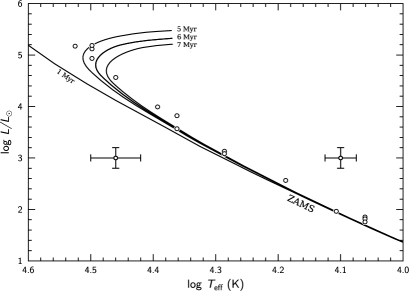
It is evident that at a distance of 1.54 kpc the five most massive members of M29 fit well with the 5 and 6 Myr isochrones. Probably an age of 5 1 Myr can be accepted. The fainter stars deviate from the ZAMS less than = 0.2, which corresponds to 0.5 mag in absolute magnitude, thus their positions within the errors do not contradict cluster membership. Their deviations from the ZAMS can be explained by the errors of (a) spectral or photometric classification, (b) calibration of MK types in terms of temperatures and BCs, (c) distance modulus determination, and (d) the isochrones themselves. Unresolved duplicity also cannot be excluded. Figure 7 shows the error bars for the early and late B-subclasses. The errors in temperatures correspond to 0.5 spectral subclass, and the errors in luminosities correspond to 0.5 mag.
7 DISCUSSION
It seems that our investigation has solved the long standing problem of the distance and age of the cluster M29. The main reason preventing determination of the cluster distance earlier is related to insufficient accuracy of the luminosity classifications of its brightest stars.
The luminosity class errors may originate from different reasons. The simplest source of errors can be the differences in quality and resolving power between the spectra of the program and the comparison stars which can make the list of luminosity criteria inapplicable. The early classifications, in which the photographic method has been used, could suffer from the sensitivity variations across the plates, i.e., insufficient “flat-fielding”. Boeche et al. (2004) point also to a possible effect on the intensities of the compared lines which fall on different Echelle orders.
Therefore it is important to have additional criteria for determination of cluster membership. One such criterion might be the proper motions of stars in the cluster area. At present, proper motions of great numbers of stars are availale in the astrometric catalogs, such as UCAC, PPMXL and others. In the area of M29, proper motions determined by Sanders (1973) are available, however their limiting magnitude is too shallow. As we mentioned in the Introduction, in the direction along the Local spiral arm, proper motions are small, and their errors frequently are larger than the proper motions themselves. However, Table 2 shows that all the selected probable members have high membership probabilities given by Sanders (1973) and by Dias (2013), the latter determined from proper motions given in the UCAC4 catalog. Unfortunately, many stars, which are definitely foreground and background stars, also have the membership probabilities close to 100. This means that proper motions are not sufficient to have trustworthy memberships. Radial velocities are much more informative (see NGC 6819, Tabetha Hole et al., 2009). According to Liu et al. (1989) and Boeche et al. (2004), the heliocentric velocity of M29 is –16.4 and –16.9 km/s, respectively. Boeche et al. find that seven stars from Table 2 (943, 976, 1089, 1123, 1136, 1146 and 1189) are radial velocity members. For the remaining eight stars radial velocities have not been measured.
In the present paper, the cluster members were identified mainly from their visible crowding and from spectroscopic and photometric distances. As the result, 15 member stars of M29 within the 15 15 area centered on the cluster were selected. Many previous investigations have also used spectroscopic and photometric distances, but usually they showed a much larger dispersion and even bimodal distribution, originating from the errors in luminosity classes of the most luminous stars. Also, in most of the previous papers the normal value of the ratio has been applied. We have found that in the direction of M29 the ratio is lower than the standard value, and this resulted in a larger distance of the cluster stars by a factor of about 1.15. The range of the extinctions for cluster members is in a good agreement with the surrounding field stars (Figure 4).
Considering the cluster distance, the decisive factor was the application of the new MK spectral types of the brightest stars determined with the criteria developed by Walborn & Fitzpatrick (1990) and Sota et al. (2011) and applied to classification of O–B stars of M29 by NRW himself. The results are in perfect agreement with the photometric data in the Vilnius and B,V systems and the Padova isochrones.
It may seem that a shortcoming in our distance and age determination is the neglect of spectroscopic binarity of the four O9–B0 stars discovered by Liu et al. (1989) and Boeche et al. (2004). If their components were of the same spectral type, the single stars should be fainter by 0.75 mag and more distant by a factor of 1.41. However, since the spectral lines of the secondaries are not observable, differences in magnitudes between the components should be much larger. In this respect it is interesting to note that the exclusion of the four spectroscopic binaries from the distance determination does not change the mean distance itself – it remains 1.54 kpc. A small vertical shift of the binaries down in the HR diagram also does not change the estimate of the age since isochrones in the range of O9–B1 spectral types run almost vertically.
The intrinsic color-magnitude diagram in Figure 5 shows that there are a number of stars in the B3–A7 range lying above the ZAMS up to 2.5 mag. Some of them can be field stars and others can be binary stars of the cluster. Distances and reddenings of some of these stars with luminosities IV and III allow them to be the evolved cluster members. This could imply that star formation in the cluster began about 50 Myr ago and is still on-going. While this is not impossible, we note the absence of a prestellar dust and gas cloud in the cluster vicinity. Most probably, the main star forming activity in the cluster took place about 5–6 Myr ago, and after that the massive luminous O–B stars dissipated the remains of the parent cloud.
If the low-mass YSOs have been formed at the same time as the massive ones, they should be present in the area of M29. We estimated the apparent magnitudes of possible T Tauri stars of spectral type K in M29 comparing it with the cluster NGC 2264 which is of similar age and contains pre-main-sequence stars both of high and low masses. In this cluster PMS stars of early K subclasses appear at = 13.5 mag (Park et al., 2000). Since the distance to NGC 2264 is 760 pc (Dahm, 2008), the difference of the true distance moduli of both clusters is 1.54 mag. The mean extinctions are 0.2 mag for NGC 2264 and 3 mag for M29. Consequently the difference of the apparent distance moduli of both clusters is about 4.3 mag. The conclusion is that in M29 YSOs of class II and spectral class K are expected to be fainter than about 17.8 mag or about 16.4 mag. This means that in M29 YSOs of Class II should be invisible in 2MASS photometry (see the limiting magnitudes in Skrutskie et al. (2006)) but they should be easily detectable in the UKIDSS survey (Lucas et al., 2008). In the UKIDSS – vs. – diagram of the area tens of sources above the intrinsic T Tauri line are seen, but their identification as YSOs of M29 is problematic. A special study, using the data from the UKIDSS, Spitzer, WISE, IPHAS and other surveys, is essential.
The M29 cluster is usually considered to be a member of the Cyg OB1 association, along with the clusters IC 4996, Berkeley 86 and Berkeley 87; see the recent review by Reipurth & Schneider (2008). Other than the clusters, the association contains tens of O–B3 stars and cooler supergiants scattered in an area of 4 3.5 (Humphreys, 1978; Garmany & Stencel, 1992). The distance to this association is still controversial but is usually considered to be 1.3–1.5 kpc. The distance to the cluster M29 determined in this investigation is close to the largest of these distances. According to Hanson (2003), the massive association Cyg OB2 located 3 north of M29 can be also located at the same distance. In this case the centers of Cyg OB2 and M29 are separated by 80 pc. However, both star groups probably are not physically related since their movements are somewhat different: the heliocentric radial velocity is –10.3 km/s for Cyg OB2 (Kiminki et al., 2007) and –16.9 km/s for M29 (Boeche et al., 2004).
8 RESULTS AND CONCLUSIONS
This investigation is based on the results of seven-color photometry and two-dimensional classification of 260 stars down to 19 mag in a 15 15 area centered on the cluster M29 (NGC 6913), 2MASS JHKs photometry, and the blue spectra for the nine brightest stars of M29 obtained at the Asiago Observatory. The spectra were classified in spectral and luminosity classes with the criteria described by Walborn & Fitzpatrick (1990) and Sota et al. (2011). The following results were obtained:
(1) The ratio of color excesses is found to be = 2.044 0.080. This means that the interstellar extinction law in the near infrared spectral range is close to normal. However, the ratio , found from the ratios for the = , and passbands, is close to 2.87, i.e. somewhat lower than the normal value . In the violet and ultraviolet spectrum down to 300 nm the normal interstellar extinction law is valid again.
(2) The distance to M29, 1.54 0.15 kpc, is determined as the average of distances of eight stars of spectral types O9-B2 classified from the Asiago spectra. Two stars from the seven brightest ones are found to be field stars: HDE 229238 is a background B0.5 supergiant and HD 194378 is a foreground F star.
(3) In the intrinsic color-magnitude diagram of O-B-A stars we selected seven more stars of spectral classes B3–B8 lying close to the ZAMS which may be also considered as the cluster members. The cooler stars were not considered since they should be still in the pre-main-sequence stage of evolution.
(4) The 15 probable members of the cluster of spectral classes O9–B8, plotted on the vs. diagram together with the isochrones from the Padova database, give the age of the cluster 5 1 Myr. The extinction is variable across the cluster (from 2.5 to 3.8 mag), the average value being 2.97 mag, which corresponds to = 1.03.
(5) The distances to the clouds of the Great Cygnus Rift are estimated to be in the range of 700–900 pc.
ACKNOWLEDGMENTS. The use of the Simbad, WEBDA, ADS, SkyView, 2MASS and UKIDSS databases is acknowledged. We are grateful to Wilton S. Dias for membership probabilities in the M29 area presented before publication. The paper is partly supported by the Research Council of Lithuania, grant No. MIP-061/2013.
References
- Alves (2000) Alves, D. R. 2000, ApJ, 539, 732
- Asplund et al. (2009) Asplund, M., Grevesse, N., Sauval, A. J., Scott P. 2009, ARA&A, 47, 481
- Becker & Stock (1948) Becker, W., Stock, J. 1948, Astron. Nachr., 278, 115
- Bertelli et al. (1994) Bertelli, G., Bressan, A., Chiosi, C. et al. 1994, A&AS, 106, 275
- Bessel et al. (1998) Bessell, M. S., Castelli, F., Plez, B. 1998, A&A, 333, 231
- Boeche et al. (2004) Boeche, C., Munari, U., Tomasella, L, Barbon, R. 2004, A&A, 415, 145
- Bressan et al. (2012) Bressan, A., Marigo, P., Girardi, L. et al. 2012, MNRAS, 427, 127
- Crawford et al. (1977) Crawford, D. L., Barnes, J. V., Hill, G. 1977, AJ, 82, 606
- Dahm (2008) Dahm, S. E. 2008, in Handbook of Star Forming Regions, vol. 1, ed. B. Reipurth, ASP, p. 966
- Dias (2013) Dias, W. S. 2013, personal communication
- Fitzpatrick (1999) Fitzpatrick, E. L. 1999, PASP, 111, 63
- Fitzpatrick & Massa (2007) Fitzpatrick, E. L., Massa, D. 2007, ApJ, 663, 320
- Flower (1996) Flower, P. J. 1996, ApJ, 469, 355
- Garmany & Stencel (1992) Garmany, C. D., Stencel, R. E. 1992, A&AS, 94, 211
- Girardi et al. (2002) Girardi, L., Bertelli, G., Bressan, A. et al. 2002, A&A, 391, 195
- Hanson (2003) Hanson, M. M. 2003, ApJ, 597, 957
- Hiltner (1956) Hiltner, W. A. 1956, ApJS, 2, 389
- Hoag & Applequist (1965) Hoag, A. A., Applequist, N. L. 1965, ApJS, 12, 215
- Hoag et al. (1961) Hoag, A. A., Johnson, H. L., Iriarte, B. et al. 1961, Publ. Naval Obs., 17, No. 7, 349
- Humphreys (1978) Humphreys, V R. M. 1978, ApJS, 38, 309
- Johnson (1960) Johnson, H. L. 1960, Lowell Obs. Bull., 5, 17
- Johnson et al. (1961) Johnson, H. L., Hoag, A. A., Iriarte, B. et al. 1961, Lowell Obs. Bull., 5,133
- Joshi et al. (1983) Joshi, U. C., Sanwal, B. B., Sagar, R. 1983, PASJ, 35, 405
- Kazlauskas & Jasevičius (1986) Kazlauskas, A., Jasevičius, V. 1986, Bull. Vilnius Obs., No. 75, 18
- Kazlauskas et al. (2006) Kazlauskas, A., Straižys, V., Bartašiūtė S. et al. 2006, Baltic Astron., 15, 511
- Kiminki et al. (2007) Kiminki, D. C., Kobulnicky, H. A., Kinemuchi, K. et al. 2007, ApJ, 664, 1102
- Liu et al. (1989) Liu, T., Janes, K. A., Bania, T. M. 1989, AJ, 98, 626
- Lucas et al. (2008) Lucas, P. W., Hoare, M. G., Longmore, A. et al. 2008, MNRAS, 391, 136
- Massey et al. (1995) Massey, P., Johnson, K. E., DeGioia-Eastwood, K. 1995, ApJ, 454, 151
- Meyer et al. (1997) Meyer, M. R., Calvert, N., Hillenbrand, L. A. 1997, AJ, 114, 288
- Milašius et al. (2013) Milašius, K., Boyle, R. P., Vrba F. J. et al. 2013, Baltic Astron., 22, 181 (Paper I)
- Morgan et al. (1955) Morgan, W. W., Code, A. D., Whitford, A. E. 1955, ApJS, 2, 41
- Morgan & Harris (1956) Morgan, W. W., Harris, D. L. 1956, Vistas in Astronomy, 2, 1124
- Morgan et al. (1943) Morgan, W. W., Keenan, P. C., Kellman, E. 1943, An Atlas of Stellar Spectra, University of Chicago Press
- Morgan et al. (1953) Morgan, W. W., Whitford, A. E., Code, A. D. 1953, ApJ, 118, 318
- Negueruela (2004) Negueruela, I. 2004, Astron. Nachr., 325, 380
- Park et al. (2000) Park, B.-G., Sung, H., Bessell, M. S., Kang, Y. H. 2000, AJ, 120, 894
- Perryman et al. (1995) Perryman, M. A. C., Lindegren, L., Kovalevsky, J. et al. 1995, A&A, 304, 69
- Perryman et al. (1997) Perryman, M. A. C., Lindegren, L., Kovalevsky, J. et al. 1997, A&A, 323, L49
- Perryman et al. (1998) Perryman, M. A. C., Brown, A. G. A., Lebreton Y. et al. 1998, A&A, 331, 81
- Reipurth & Schneider (2008) Reipurth, B., Schneider, N. 2008, in Handbook of Star Forming Regions, vol. 1, ed. B. Reipurth, ASP, p. 36
- Roman (1951) Roman, N. G. 1951, ApJ, 114, 492
- Sanders (1973) Sanders, W. L. 1973, A&AS, 9, 221
- Skrutskie et al. (2006) Skrutskie, M. F., Cutri, R. M., Stiening, R. et al. 2006, AJ, 131,1163
- Sota et al. (2011) Sota, A., Maíz, Apellániz, J, Walborn N. R. et al. 2011, ApJS, 193, 24
- Sota et al. (2014) Sota, A., Maíz Apellániz, J., Morrell N. I. et al. 2014, ApJS, 211, 10
- Straižys (1992) Straižys, V. 1992, Multicolor Stellar Photometry, Pachart Publishing House, Tucson, Arizona; available in pdf format from http://www.itpa.lt/MulticolorStellarPhotometry/
- Straižys & Laugalys (2008) Straižys, V., Laugalys, V. 2008, Baltic Astron., 17, 253
- Straižys et al. (2008) Straižys, V., Corbally, C. J., Laugalys, V. 2008, Baltic Astron., 17, 125
- Straižys & Laugalys (2009) Straižys, V., Laugalys, V. 2009, Baltic Astron., 18, 141
- Straižys & Lazauskaitė (2009) Straižys, V., Lazauskaitė, R. 2009, Baltic Astron., 18, 19
- Tabetha Hole et al. (2009) Tabetha Hole, K., Geller, A. M., Mathieu, R. D. et al. 2009, AJ, 138, 159
- Tifft (1958) Tifft, W. G. 1958, AJ, 63, 127
- Torres (2010) Torres, G. 2010, AJ, 140, 1158
- Walborn & Fitzpatrick (1990) Walborn, N. R., Fitzpatrick, E. L. 1990, PASP, 102, 379
- Walborn et al. (2014) Walborn, N. R., Sana, H., Simón-Díaz, S. et al. 2014, A&A, in press; http://arxiv.org/abs/1402.6969
- Walker & Hodge (1968) Walker, G. A. H., Hodge, S. M. 1968, PASP, 80, 290
- Wang & Hu (2000) Wang, J.-J., Hu, J.-Y. 2000, A&A, 356, 118
- Zug (1933) Zug, R. S. 1933, Lick Obs. Bull., 16, 119 (No. 454)
- Zwitter & Munari (2000) Zwitter, T., Munari, U. 2000, An Introduction to Analysis of Single Dispersion Spectra with IRAF, Asiago Monografie, vol. 1, Padova