11email: koester@astrophysik.uni-kiel.de 22institutetext: Department of Physics and Astronomy, University of Delaware, Newark DE 19716, USA 33institutetext: Department of Physics, University of Warwick, Coventry CV4 7AL, UK
Atmospheric parameters and carbon abundance for hot DB white dwarfs
Abstract
Context. Atmospheric parameters for hot DB (helium atmosphere) white dwarfs near effective temperatures of 25 000 K are extremely difficult to determine from optical spectroscopy. The neutral He lines reach a maximum in this range and change very little with effective temperature and surface gravity. Moreover, an often unknown amount of hydrogen contamination can change the resulting parameters significantly. This is particularly unfortunate because this is the range of variable DBV or V777 Her stars. Accurate atmospheric parameters are needed to help or confirm the asteroseismic analysis of these objects. Another important aspect is the new class of white dwarfs – the hot DQ – whose spectra are dominated by carbon lines. The analysis shows that their atmospheres are pure carbon. The origin of these stars is not yet understood, but they may have an evolutionary link with the hotter DBs, as studied here.
Aims. Our aim is to determine accurate atmospheric parameters and element abundances and study the implications for the evolution of white dwarfs of spectral classes DB and hot DQ.
Methods. High-resolution UV spectra of five DBs were studied with model atmospheres. We determined stellar parameters and abundances or upper limits of C and Si. These objects were compared with cooler DBs below 20 000 K.
Results. We find photospheric C and no other heavy elements – with extremely high limits on the C/Si ratio – in two of the five hot DBs. We compare various explanations for this unusual composition that have been proposed in the literature: accretion of interstellar or circumstellar matter, radiative levitation, carbon dredge-up from the deeper interior below the helium layer, and a residual stellar wind. None of these explanations is completely satisfactory, and the problem of the origin of the hot DQ remains an open question.
Key Words.:
white dwarfs – convection – stars:abundances1 Introduction
DB white dwarfs have helium-dominated atmospheres, with occasional minor pollution by hydrogen (DBA), heavy metals (DBZ), or carbon (DQ). Recent large-scale studies of optical spectra were reported by Voss et al. (2007) and Bergeron et al. (2011). The latter work gives an excellent account of the past two decades of literature as well as a summary of open questions: the DB gap, the amount and origin of the hydrogen contamination, the mass distribution, and average masses of DBs versus those of the DAs (hydrogen-dominated atmospheres).
In our current study, the emphasis is on accurately determining atmospheric parameters, effective temperatures, and surface gravities. The fitting of optical DB spectra near 25 000 K with theoretical models is extremely difficult. With mixing-length parameters ML2/1.25 (see, e.g., Fontaine et al., 1981; Tassoul et al., 1990, for the notation) – the preferred choice by the Montreal group – the maximum strength of the neutral helium lines is reached in this range, and a broad plateau is formed, where the overall line strength is practically constant, with only very subtle changes in the profiles. Additionally, there is the problem of a possible hydrogen contamination if no hydrogen lines are visible (see, e.g., Bergeron et al., 2011, for a detailed discussion). This temperature region is important because the variable DB or V777 Her stars are found around 25 000 K. Accurate parameters are needed to locate the instability strip for this class and to determine whether it is “pure”, that is, whether all stars in this strip are pulsators. Spectroscopic temperatures and masses are important for comparisons with asteroseismic results, or to help chose the best asteroseismic models if many more pulsation frequencies are predicted than observed.
Another important aspect for the hot DBs is the new class of white dwarfs detected by Dufour et al. (2007), whose spectra are dominated by C i and C ii lines. At first sight, they resembled G 35-26 and G 227-5 at the hot end of the DQ spectral class around 12 500 K (Thejll et al., 1990; Wegner & Koester, 1985), but a detailed first analysis showed that their atmospheres are dominated by carbon instead of helium (Dufour et al., 2008). These are the first objects in the “normal” white dwarf range below = 100 000 K, where the main element in the atmosphere is not hydrogen or helium. Among the pre-white dwarfs at higher temperatures, the PG 1159 star H 1504+65 is the only object that does not show any trace of H or He in its spectrum (Werner et al., 2004).
The hot DQs appear on the cooling track of white dwarfs around 24 000 K, which makes it very plausible that they are transformed from another type, most likely the DBs (Bergeron et al., 2011). It is generally accepted that the cool DQ white dwarfs are formed by carbon dredge-up, when the helium convection zone increases in depth into the transition zone between helium and the underlying carbon (Koester et al., 1982; Pelletier et al., 1986; Dufour et al., 2005; Koester & Knist, 2006). It is therefore tempting to assume a similar process for the hot DQs. The progenitors could be stars like H 1504+65, if they have retained a tiny amount of helium in their outer layers – a fraction 10-15 of the total stellar mass would be sufficient. In the subsequent cooling evolution this small amount of helium would float to the top, transforming the star into a helium-atmosphere white dwarf (DB) somewhere between 40 000–30 000 K. At 30 000 K a convection zone develops, which deepens with decreasing effective temperature. If the He layer mass is in the range of – of the total mass, the convection zone would reach into the He/C transition zone and rapidly transform the star into a hot DQ. One aim of our study is therefore to search for signs of such a transition in the hot DBs.
2 Observations
Our sample of five pulsating helium-atmosphere white dwarfs was chosen with the goal of improving determinations. Our targets were observed with the Cosmic Origins Spectrograph (COS) onboard the Hubble Space Telescope (HST) (Green et al., 2012; Osterman et al., 2011). Spectra were obtained in TIME-TAG mode, using the primary science aperture and the G130M and G160M gratings, with central wavelengths of 1291 and 1611 Å, respectively. Each exposure used multiple FP-POS positions to improve the limiting signal-to-noise ratio (S/N) and minimize fixed-pattern noise. The total exposure times were chosen to reach the desired S/N of 20, except for the faint object WD J1929+4447. In this case, we limited the target S/N to 10. The effective wavelength range of 1132-1789 Å ensured that the spectral coverage included Lyman , O i 1302 Å, C ii 1335 Å, and He ii 1640 Å. The wavelength resolution of 0.1 Å allows the clear separation of interstellar and photospheric line components. Each data set was reduced with the COS calibration pipeline, which includes corrections for flats, deadtime, geometric and thermal distortion, and orbital and heliocentric Doppler effects. The journal of observations is given in Table 1.
| target | date | exposure [s] | aperture | grating | central | opt |
|---|---|---|---|---|---|---|
| EC 20058-5234 | 2011-11-19 | 1100.64 | PSA | G130M | 1283.307 | 15.58 (V) |
| 2011-11-19 | 3423.58 | PSA | G160M | 1604.309 | ||
| WD J1929+4447 | 2012-11-09 | 5182.72 | PSA | G130M | 1283.080 | 18.21 (V) |
| 2012-11-09 | 5882.67 | PSA | G160M | 1604.282 | ||
| EC 04207-4748 | 2012-10-24 | 1419.14 | PSA | G130M | 1283.264 | 15.30 (V) |
| 2012-10-24 | 2193.25 | PSA | G160M | 1604.418 | ||
| PG 1115+158 | 2013-02-01 | 1734.05 | PSA | G130M | 1283.322 | 16.61 (g) |
| 2013-02-01 | 5246.78 | PSA | G160M | 1604.271 | ||
| WD 1654+160 | 2013-07-04 | 1409.08 | PSA | G130M | 1283.307 | 16.62 (g) |
| 2013-07-04 | 2403.42 | PSA | G160M | 1609.345 |
In addition, we used available optical spectra to redetermine the atmospheric parameters. Spectra from the Supernova Progenitor Survey (SPY, Voss et al. (2007)) were available for EC 04207-4748, WD 1654+160, and PG 1115+158. WD 1654+160, and PG 1115+158 were also recently analyzed by Bergeron et al. (2011). For WD J1929+4447 we used the excellent blue optical spectrum analyzed in Østensen et al. (2011), which does not cover H, however. The same is true for the high S/N Magellan 6.5m telescope spectrum of EC 20058-5234 discussed in Sullivan et al. (2007).
As a complementary sample of cooler, non-variable DBs we used seven objects from the recent snapshot survey of white dwarfs, which covered the temperature range of 17 000–27 000 K (Gänsicke et al., 2012; Koester et al., 2014). This survey had DA white dwarfs as primary targets, but included a few DBs for comparison (Farihi et al., 2013). The HST/COS spectra were similar, but were observed only with the G130M grating centered on 1291 Å, and therefore extended only to 1450 Å. All these objects had been analyzed using optical spectra by Bergeron et al. (2011). We used their parameters for our theoretical model and determined metal abundances in the photosphere.
3 Analysis of individual objects
PG 1115+158 has a measured determination of (henceforth abbreviated as [H/He]) (Bergeron et al., 2011). The other objects with H covered typically have limits of , those with only H covered in the optical spectrum of (WD J1929+4447, EC 20058-5234).
With a limit of [H/He] there is already an influence on the spectra from the blanketing effect of the hydrogen Balmer and Lyman jumps and L. In the optical range this is almost invisible to the eye, but leads to significant changes in the position of the minimum solution. Moreover, the surface becomes very complicated, with two or even more local minima. The solution found by the fitting code then depends on the starting conditions (we always used 23 000 and 28 000 K, which bracket the region of maximum line strengths, and sometimes additional values as starting points) and very minor details of the fitting procedure. The minimum values are often identical, and at an S/N below 30 the fits cannot be distinguished.
It is therefore desirable to use additional information beyond the optical spectra. Trigonometric parallaxes are not available, but we have the absolutely calibrated HST/COS spectra in the range 1140 – 1770 Å. The slope of these spectra mostly depends on the effective temperature, which is even more true for the slope from the visual to the UV. To give an example, at = 25 000 K a change of , or of the hydrogen content [H/He] from -4 to -5 change the flux at 1400 Å by 1%, whereas a change of 1000 K changes the flux by 9%.
We therefore used the following steps in our analysis:
-
•
optical spectra (described below) are fitted with a grid of helium-rich models and [H/He] of -5, using a minimizing technique. The best solution is used as a starting point for the following steps:
-
•
the best-fit model is compared with the observed UV spectrum and the interstellar hydrogen column density (HI) is determined from L. This is easily possible because in all objects this line is either much stronger than predicted by the photospheric determination or limit, or clearly on the interstellar and not photospheric wavelength scale. From this column density we determine the optical extinction using the relation (Bohlin et al., 1978; Gudennavar et al., 2012)
(1) (2) All derived values are lower than the highest values in the dust maps of Schlegel et al. (1998). The dust extinction in the UV is modeled simply as linear in
(3) which is an excellent fit for small (Zagury, 2013).
-
•
theoretical colors (, , ) are calculated for the best-fit models and compared with available photometry, corrected for extinction. From this comparison follows the solid angle of the star.
-
•
the theoretical UV spectrum is multiplied with the solid angle and compared with the observed spectrum, regarding the slope in the UV region, and the absolute values (i.e., the slope UV - ). If the fit is not satisfactory, is changed, a new is found by spectroscopic fitting with fixed, and the iteration is continued with the second entry of this list.
We used the [H/He] = -5 grid and verified that results using a grid with [H/He] = -4 do not differ by more than a small fraction of the errors. This is a big advantage of our method because four of the five objects have only upper limits on the order of [H/He] .
After the parameters effective temperatures and surface gravities were fixed, the lines in the UV spectra were identified and abundances determined. The results are presented in Table 2.
| object | [K] | [C/He] | [Si/He] | (HI) [cm-2] | distance [pc] | |
|---|---|---|---|---|---|---|
| WD J1929+4447 | 30000 (1000) | 7.89 (0.15) | 20.4 (0.1) | 395 | ||
| WD 1654+160 | 29410 (500) | 7.97 (0.08) | 20.4 (0.1) | 170 | ||
| EC 04207-4748 | 25970 (500) | 7.79 (0.08) | -5.6 (0.2) | 18.9 (0.1) | 108 | |
| EC 20058-5234 | 25500 (500) | 8.01 (0.05) | -5.3 (0.2) | 19.1 (0.1) | 104 | |
| PG 1115+158 | 25000 (500) | 7.91 (0.07) | -5.6 (0.2) | -6.3 (0.2) | 19.8 (0.1) | 192 |
| WD 0100-068 | 19800 | 8.07 | ||||
| WD 0435+410 | 16810 | 8.19 | ||||
| WD 0840+262 | 17770 | 8.30 | ||||
| WD 1557+192 | 19570 | 8.15 | ||||
| WD 1822+410 | 16230 | 8.01 | ||||
| WD 1940+374 | 16630 | 8.07 | ||||
| WD 2144-079 | 16340 | 8.18 |
3.1 Notes on individual objects
WD J1929+4447: the best fit using only the blue optical spectrum is 24 950 K, = 8.029, similar to the results given in Østensen et al. (2011). The reddening derived from the HI column density is 0.052, consistent with the value 0.05 used in that paper in the fit for the optical spectrum. However, the USNO-A2.0 catalog (Monet, 1998) has the photographic magnitudes = 17.4 and = 18.8. Using the relation from Eric Mamajek (2010) 222http://www.pas.rochester.edu/~emamajek/memo_USNO-A2.0.html
| (4) |
we derive = 18.21. The relation has significant scatter (), the value is therefore quite uncertain. If we nevertheless use it to derive a solid angle from the comparison with theoretical models, we need a much higher effective temperature of 30 000 K to reproduce the slope of the UV spectrum, which is independent of the optical photometry. The absolute scale (UV-) is 10% too high and would be best fitted around 28500 K. Because of the large uncertainty in the magnitude, we prefer the higher temperature. The HeII 1640 Å line is also fitted well, and the optical fit is not noticeably worse than at the lower . We note that the pulsational properties also argue for a position of this object at the blue edge of the instability strip near 29 200 K (Bischoff-Kim & Østensen, 2011).
Only lines of the interstellar medium (ISM) are visible in the UV. The upper limit on hydrogen from H is [H/He] = -3.5 (the spectrum does not extend to H), but even this abundance is far too small to explain L. This line clearly is on the ISM wavelength scale and dominated by interstellar absorption.
WD 1654+160: We have two SPY spectra of relatively low quality. The optical fits result in low values (23 000 K) with very high uncertainty. We prefer to use the much higher result (see Table 2) from Bergeron et al. (2011) (with [H/He] -3.98), which is based on much better spectra. This model, with = 16.55 (Farihi et al., 2005) and an extinction calculated from the hydrogen column density, predicts the correct UV slope. The absolute value of the UV flux (or the UV- slope) is slightly too low, but compatible within the errors. WD 1654+160 also has photometry from the SDSS survey (Aihara et al., 2011); the value of (16.16 after dereddening) results in an excellent fit of the UV spectrum. The He ii 1640 Å line agrees with this model. In the UV spectrum only ISM lines are visible. [H/He] = -4, the limit from the optical spectra, is far too low for L, which must be dominated by the ISM absorption.
EC 04207-4748: We used two SPY spectra of high S/N (40 and 30), with a well-defined spectroscopic fit at = 25 970, = 7.790, and [H/He] = -5.0. The UV spectrum has an artificial jump near 1400 Å, which makes the comparison difficult. With = 15.3 (Kilkenny et al., 2009), the average UV- slope is best fitted at 26 500 K, but then the slope below 1400 Å in the UV is too steep. We keep the spectroscopic solution in this case.
The UV spectrum shows interstellar lines of several elements and photospheric lines only of carbon. C ii 1323 Å is a highly excited line and must be photospheric. On this wavelength scale C ii 1335 Å and the C iii lines near 1175 Å are also excellent fits. There are obviously two blue ISM components to C ii 1334 Å. These two components are also visible in the Si ii 1260 Å and the S ii lines. The C iii/C ii ionization ratio is well reproduced at this temperature. A hydrogen abundance of [H/He] = would fit L and is consistent with an upper limit of from the optical H. However, L is shifted on the ISM wavelength scale, and the photospheric abundance is certainly lower.
EC 20058-5234 (QU Tel): We used a high-quality spectrum taken at the Magellan 6.5m telescope and discussed in Sullivan et al. (2007). With the new model grid we find the best spectroscopic solution at 25 000 K, = 8.01 and [H/He] = -5.0, although local minima also exist at higher temperatures. Using = 15.58 from Koen et al. (1995), the UV- slope is reproduced correctly, but the UV slope is slightly too flat. It agrees with a model at 26 000 K, but then the UV- slope is too steep. We therefore use the compromise of 25 500 K and include both solutions within the error. The He ii 1640 Å line is stronger than predicted.
In addition to many interstellar lines, there clearly is photospheric carbon, with lines from exited states of C ii and C iii. The C iii/C ii ratio points to a slightly lower temperature. The upper limit from L is [H/He] = -4, which would fit the observations in strength, but is clearly shifted exactly as the other ISM lines.
Petitclerc et al. (2005) studied Far Ultraviolet Spectral Explorer (FUSE) spectra of EC 20058-5234. The only heavy element they found is carbon, their abundance (-5.50) agrees with our result within the errors. They also determined an upper limit for the Si/C ratio, which is very low, but a factor of two higher than our determination from COS spectra of superior quality.
PG 1115+158 (DT Leo): In this case we also preferred the result from Bergeron et al. (2011) ( = 23 7701632 K, = 7.910.07,[H/He] =-3.84). However, using the accurate SDSS magnitude = 16.61 (0.02), the predicted flux and slope in the UV are significantly too low. Since the effective temperature in this case has a very large error, we have kept the surface gravity value and iteratively increased . With 25 000 K the UV slope as well as the UV- slope are accurately matched. The He ii 1640 Å line is still predicted too weak, however.
In the UV, ISM lines of several elements are present and clearly separated from photospheric lines, which include S and Al in addition to C and Si. The C iii/C ii and Si iii/Si ii ratios confirm the temperature. The hydrogen abundance from the optical determination is not nearly enough to fit the L line, which is also shifted to the ISM wavelength scale and therefore must be dominated by interstellar absorption.
3.2 General discussion of observations
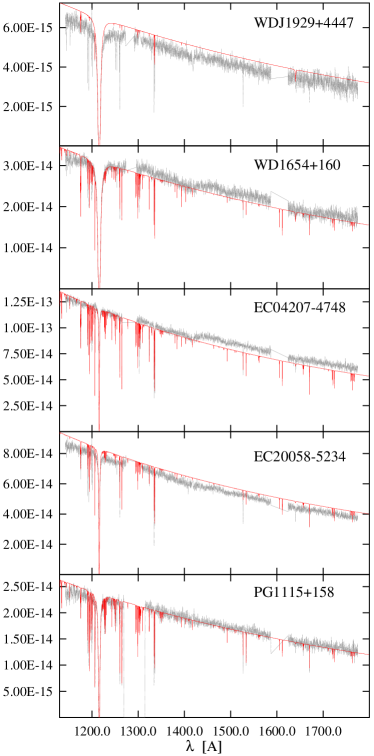
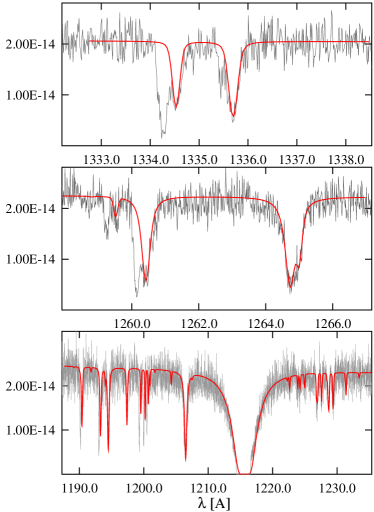
The adopted stellar parameters and abundances for C and Si are summarized in Table 2. The UV spectra of the five variable DBs are shown in Fig. 1 together with the theoretical models for the parameters derived above. The model spectra are corrected for interstellar extinction determined from the hydrogen column density (HI) and multiplied with the solid angle determined from the optical photometry, compared with theoretical magnitudes for the stellar parameters. We emphasize that the models were not fitted to the UV observations, but represent the best compromise between fits to optical spectra, UV spectral slope, and the UV- slope. The models show more spectral lines than observed in the stars, and also of elements other than C and Si (O, S, N, Fe). These lines were included as wavelength references for the comparison with interstellar lines, and to determine the photospheric nature of carbon. A more detailed example for the photospheric and interstellar lines of C and Si is shown in Fig. 2.
We recall that all these stars are nonradial g-mode pulsators with multiple modes of oscillations, which can experience temperature excursions of 3000 K during a pulsation cycle. Our UV spectra are time-averaged spectra that cover multiple pulsation cycles. How well our static models can fit the time-averaged observations depends somewhat on periods, amplitudes, phases, and perhaps inclination. For example, the large-amplitude pulsators EC 04207-4748 and WD 1654+160 present significantly nonlinear light curves with sharp maxima generated by localized high-temperature variations (Montgomery et al., 2010). In particular the He ii 1640 Å line could potentially show strong effects. A theoretical nonpulsating model with = 25 000 K will show an extremely weak (undetectable) line. However, the strength of the line rapidly increases at higher temperatures, but is still 0 below 25 000 K. Thus a pulsating model can show a detectable line in the time-averaged spectrum with time-averaged = 25000 K, if the amplitude is large enough. At the hot end near 29 000 K the change is much more symmetric between positive and negative temperature variations and the time-averaged spectrum will resemble the nonpulsating star more closely. The observations were taken in TIME-TAG mode, and we are currently working on extracting time-resolved spectra to analyze the change during the pulsation cycle.
4 Origin of the photospheric metals
The widely accepted explanation for the metal pollution in white dwarf photospheres is accretion from a debris disk, a remnant of a former planetary system, with rocky material resembling the composition of our own system (e.g., Zuckerman et al., 2007; Dufour et al., 2012; Gänsicke et al., 2012) . In a comprehensive study of HST/COS spectra of a homogenous sample of DA white dwarfs with between 17 000 and 27 000 K, Koester et al. (2014) found that 48 out of 85 objects showed photospheric metals, in all cases including silicon. In about half of them, the presence of Si and sometimes C could be explained by radiative levitation and no current accretion is necessary. However, 23 objects must be currently accreting because the abundances are too high to be supported by radiative levitation. The diffusion timescales in these DAs are extremely short, from days to a few years at most. It can therefore be safely assumed that the accretion is now ongoing in a stationary state, which allows the direct determination of the abundance ratios in the accreted matter from those observed in the photosphere.
Only a few of the DAs with photospheric silicon also show carbon, and the highest C/Si ratio for the accreting matter is 10 for WD 0710+471. This star is a known post-common-envelope binary (PCEB, see Marsh & Duck, 1996), which accretes solar-like material from the wind of its red companion. In all other cases the C/Si ratio is at most around 1 and in most cases much below this, which is typical for rocky material in our solar system. There is no single object among the 48 with metals that shows carbon and not silicon.
A similar situation is seen in the seven cooler DBs below 20 000 K that were included as comparison objects in the HST/COS study. Their parameters are also given in Table 2. Three of the objects show no photospheric lines, two have a C/Si ratio of 1, and the other two have a ratio much lower than 1. Differently from the DAs, this sample is strongly biased: the four DBs with metals were known before our study to be polluted with metals, and were selected for that reason. However, there was no bias in the selection concerning the C/Si ratio. The origin of these metals is very likely accretion, as in the DA sample.
4.1 Accretion and diffusion in the hot DB
A stunning difference is seen in the hotter DBs, with very high C abundances and an observed photospheric C/Si number ratio in EC 04207-4748 and in EC 20058-5234 (the ratios by mass are 270 and 1076). These objects add to the growing number of hot DB stars that show only carbon as heavy element, such as BPM 17088, GD 190 (Petitclerc et al., 2005), and PG0112+104 (Dufour et al., 2010), with similar carbon abundances and low silicon limits. GD 358 might be another example; it also shows carbon. The GHRS (Goddard High Resolution Spectrograph) spectrum shows separated ISM and photospheric C ii lines (Dufour et al., 2002), but does not cover the wavelength regions of strong Si lines. The STIS (Space Telescope Imaging Spectrograph) spectrum we have (Nitta et al., 2012) shows carbon and also the Si 1260/1264 Å feature, but the resolution is not high enough to clearly separate ISM and photospheric contributions.
Differently from the DAs in this temperature range between 20 000–30 000 K, the DBs develop a convection zone. Since the convection zones are always homogeneously mixed, diffusion starts only from the bottom of this zone, leading to longer diffusion times. Table 3 summarizes the data on the convection zones and diffusion timescales. Assuming that the metal pollution is caused by accretion in a steady state with diffusion, we can derive the diffusion fluxes or upper limits for C and Si, and thus the abundances in the accreted matter. The derived C/Si mass ratios are compared with the ratios in different objects of our own solar system, showing the extraordinary discrepancy with those ratios in EC 04207-4748 and EC 20058-5234.
The diffusion timescales range between 10 and 200 years. This is still not very long, but one might argue that accretion is not in a steady state, but has already stopped. Silicon, with shorter diffusion timescales, could have already disappeared, while carbon is still observable. A simple test calculation for EC 04207-4748 shows that this leads to rather extreme conclusions. The abundance ratio C/Si changes with time in years as
| (5) |
Assuming a starting ratio of 1, it would take 1271 years to reach the observed lower limit. The starting abundance would have been [C/He] = -2.23, with an accretion flow of g/s of carbon alone. Objects with such high accretion rates have never been observed, and we consider this scenario as highly unlikely.
Before the accretion of planetary debris was commonly accepted as the source of pollution in white dwarfs, accretion from comets was another option discussed. The oxygen-to-carbon ratio in comets is close to the solar value, [O/C] = 0.26. In EC 04207-4748 the oxygen lines are strongly perturbed by the geocoronal emission, but in EC 20058-5234 we can set an upper limit [O/C]-0.8, that is, about one tenth of the solar value.
The maximum hydrogen content in the convection zone of EC 20058-5234 – assuming [H/He] – is g. Scaling the carbon diffusion flux, using solar mass ratios, the hydrogen accretion would be g/yr; the abundance change would be visible within a few months. These arguments rule out comets as the source of the accretion.
| object | (C) [yrs] | (Si) [yrs] | (C) [g/s] | C/Si | ||
| WDJ1929+4447 | -12.661 | -10.962 | 31.05 | 11.91 | ||
| WD1654+160 | -12.466 | -10.721 | 36.23 | 15.14 | ||
| EC20058-5234 | -11.656 | -10.178 | 114.89 | 55.77 | 137.5 | |
| EC04207-4748 | -11.592 | -10.045 | 179.67 | 85.29 | 512.0 | |
| PG1115+158 | -11.373 | -9.822 | 204.64 | 103.40 | 0.11 | |
| WD0100-068 | -8.419 | -6.062 | 0.52 | |||
| WD0435+410 | -6.676 | -3.627 | ||||
| WD0840+262 | -7.263 | -4.437 | ||||
| WD1557+192 | -8.184 | -5.681 | ||||
| WD1822+410 | -6.130 | -3.644 | ||||
| WD1940+374 | -6.393 | -3.499 | ||||
| WD2144-079 | -6.482 | -3.686 | ||||
| Sun | 3.56 | |||||
| bulk Earth | 0.0099 - 0.0228 | |||||
| CI | 0.325 |
4.2 Radiative levitation
Radiative levitation for C and Si has recently been shown to be important for DA white dwarfs around = 20 000 K (Chayer & Dupuis, 2010; Dupuis et al., 2010; Chayer, 2014). Similar calculations do not yet exist for DB white dwarfs, but useful data can be found in Chayer et al. (1995), although the emphasis there is more on the hotter white dwarfs. In their Fig. 16 the authors present the equilibrium abundance in the envelope of DO/DB white dwarfs (with = 7.5) for many elements, including C and Si, for temperatures from 100 000 to 20 000 K. At a fractional depth between and , significant abundances of many elements can be supported by radiative levitation, at least at higher temperature. Upon cooling below 30 000 K, the developing convection zones could reach into these “metal clouds”, mixing it homogenously even up into the photosphere. For C, however, the abundances at 30 000 K are already off the scale of the figure, below [C/He] = -10. At the higher surface gravities of our objects (¿7.5), the abundances would be even lower. Equally important, many other elements show similar behavior, and in particular silicon would be supported at a significantly larger abundance than carbon. We conclude that dredge-up from such radiatively supported metal clouds cannot explain the observed C/Si ratios.
4.3 Carbon dredge-up
Another process that in principle can pollute a helium atmosphere with carbon is dredge-up from the tail of the C-He transition region formed after the end of helium-burning. This has been the standard and well-understood explanation of the cool DQ stars below 12 000 K (Koester et al., 1982; Pelletier et al., 1986; Dufour et al., 2005; Koester & Knist, 2006). It was an obvious idea that such a dredge-up could also explain the hot DQs, and this has been speculated among others by Bergeron et al. (2011). The problem is that the helium layer in at least some DB stars needs to be much thinner than the standard of about 1/100 of the total mass predicted by stellar evolution calculations, and no indication for that has been found so far. Nevertheless, in the absence of a generally accepted origin for the hot DQs, we investigate below necessary conditions for carbon dredge-up in the two objects, and the consequences.
Vennes et al. (1988) derived the equations (their Eqs. 11-22) governing the diffusion equilibrium between hydrogen and helium in a general way, which can be directly applied in our case for the helium-to-carbon transition as well. With and as average charges of the two ions, and and the atomic weights, the equations we need are
| (6) | |||||
| (7) | |||||
| (8) | |||||
| (9) | |||||
| (10) | |||||
| (11) | |||||
| (12) |
Here is the number ratio , the pressure. The nonlinear equation for is integrated from the known starting values at the bottom of the convection zone to a specified value, for example, 1.0. The fractional mass at that depth can easily be obtained from an integration of the hydrostatic equation assuming a constant surface gravity – a good approximation in the outer layers
| (13) |
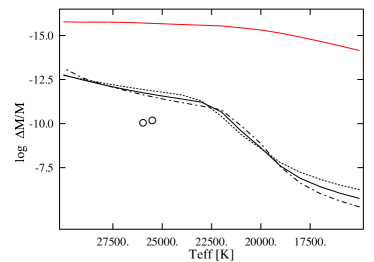
The results of these calculations are also shown in Table 3, where the third column gives the mass depth at which the number ratio is 1.0, or with our logarithmic variable [He/C] = 0. In all cases, where no photospheric carbon is observed, or were accretion has occurred possibly in addition to dredge-up, these numbers are lower limits, and the helium layer might have the canonical thickness predicted by stellar evolution theory. However, for EC 20058-5234 and EC 04207-4748 – if the dredge-up scenario is correct – a very thin helium layer is predicted. This will have inevitable consequences for the further evolution. Figure 3 shows the change of the depth of the convection zone with decreasing effective temperature. At first more gradually, but below 22 500 K rather rapidly, the bottom of this zone reaches increasingly deeper layers. The two circles show the predicted transition layer for the two objects with the extreme carbon abundance; it is plausible that with further cooling near 22 000 K they will become extremely carbon-rich, that is, hot DQs.
While at first sight this appears to be a plausible explanation for the abundant carbon pollution and the hot DQs, there are severe problems that make accepting this hypothesis difficult.The most severe is the number statistics: finding two out of five DBs near 25 000 K in this study, as well as at least three more in the literature (see above) as possible hot DQ progenitors is clearly at odds with the fact that these stars seem to be extremely rare. Dufour et al. (2007) estimated that only one out of 2850 white dwarfs belongs to this class. The real comparison must be made with the number of DBs in the narrow range were the DQs exist, which is much lower, but a 40% incidence seems impossible to explain. Another problem is presented by the masses. Although still preliminary, fits to spectroscopic observations suggest a high mass with surface gravities near 8.75 (Dufour et al., 2011); recent parallax measurements confirm this for two objects (private communication from the referee P. Dufour).
4.4 Residual stellar wind
Historically, the first hypothesis for the carbon pollution of DB white dwarfs was proposed by Fontaine & Brassard (2005) and Brassard et al. (2007) even before the hot DQs were discovered. These authors assumed a PG1159-DO-DB-DQ evolutionary sequence and a stellar wind that decreases from high effective temperatures linearly with age and dies at 20000 K. They stated themselves that this is an ad hoc assumption without physical basis, and cannot be seen as a continuation of the stellar winds at much higher discussed by Unglaub & Bues (2000). To our knowledge, there is no observational evidence for such winds from white dwarfs. The standard assumption of Fontaine & Brassard (2005) corresponds to a mass loss of M⊙/yr for a DB at 25000 K, but calculations are also performed with the wind increased by factors 2.5 and 5. This wind would slow down the gravitational settling of carbon, thus explaining the carbon in DBs above 20000 K. Judging from their Fig. 1, the mass loss to explain the carbon abundance in our two objects would have to be M⊙/yr. This model did not attempt to explain the hot DQs, which were not known at the time.
Apart from the unknown physical mechanism and missing observational evidence, there are two other problems with this hypothesis. The mass loss should be higher at higher temperatures, yet the two hottest objects of our sample show no carbon, with upper limits significantly lower than the abundances observed in the cooler objects. And second, PG 1115+158, with photospheric Si, S, and Al detected, obviously is accreting. The proposed mass loss in the residual-wind scenario amounts to g/s, compared with a total accretion flow scaled from the Si mass flow with bulk Earth abundances of g/s. It seems impossible that accretion could occur under such circumstances. If accretion is not occurring now, it must have occurred fairly recently because of the short diffusion timescales. But then the mass loss was even stronger because it decreases proportional to age in the Fontaine & Brassard (2005) scenario.
5 Discussion and conclusions
We have presented improved stellar parameters for five hot DB stars, using optical photometry and absolutely calibrated HST/COS spectra in addition to optical spectra. Abundance patterns for Si and C in four of the seven DBs below 20000 K are typical for accretion from circumstellar material, while no photospheric heavy elements are found in the other three. Of the hot DBs, only one shows photospheric lines of C, Si, S, and Al, which are very likely due to accretion. The two hottest objects do not show any photospheric lines. The remaining two objects, EC 20058-5234 and EC 04207-4748, both near 26000 K, show high carbon abundances and an extremely high C/Si ratio, joining at least three other DBs in the same temperature range with similar properties. We discussed possible hypotheses about the origin of this carbon and excluded accretion and radiative levitation.
Carbon dredge-up is the only hypothesis that provides a single explanation for the carbon abundances in the hot DBs and the formation of the hot DQs. This seems more natural than assuming two unrelated explanations. We acknowledge that this is not a new idea: Bergeron et al. (2011) explicitely stated that the immediate progenitors of the hot DQs must be among the hot DBs. It is clear that this can only occur for thin helium layers. Dredge-up also provides a natural explanation for the absence (or lower C abundances) in the two hot objects near 30000 K (the shallower He convection zone), although a thicker helium layer would have the same effect. It is compatible with the appearance of other heavy elements in one of the three objects at 25000 K, which could be due to accretion. The most severe argument against the connection with the hot DQs is currently the number statistics: there are too many possible progenitors for the rare hot DQs. Time-dependent calculations of the evolution of the convection zone during the mixing process will be necessary to determine whether all hot DBs with carbon traces really have to evolve into hot DQs, or if this perhaps occurs only for the most massive objects.
A residual stellar wind could explain the carbon pollution, but requires an unrelated mechanism for the hot DQs. It also faces difficult problems: an unknown physical mechanism, no observational confirmation, absence of carbon in some objects, even in the hottest two of the sample, where the wind should be strongest, or apparent accretion in spite of much larger mass loss. This means that both the carbon pollution of hot DBs and the origin of the hot DQs unfortunately currently remain unexplained.
Acknowledgements.
Based on observations made with the NASA/ESA Hubble Space Telescope, obtained at the Space Telescope Science Institute, which is operated by the Association of Universities for Research in Astronomy, Inc., under NASA contract NAS 5-26555. These observations are associated with program #12929 and #12474. The research leading to these results has received funding from the European Research Council under the European Union’s Seventh Framework Programme (FP/2007-2013) / ERC Grant Agreement n. 320964 (WDTracer). D.K. thanks S.O.Kepler of UFRGS (Porto Alegre, Brazil) for stimulating discussions and kind hospitality during his stay at UFRGS, and the program “Science without Borders” from the Ministério da Ciência, Tecnologia e Inovação (MCTI) and Ministério da Educação (MEC), Brazil for generous financial support.References
- Aihara et al. (2011) Aihara, H., Allende Prieto, C., An, D., et al. 2011, ApJS, 193, 29
- Allègre et al. (2001) Allègre, C., Manhès, G., & Lewin, É. 2001, Earth and Planetary Science Letters, 185, 49
- Asplund et al. (2009) Asplund, M., Grevesse, N., Sauval, A. J., & Scott, P. 2009, ARA&A, 47, 481
- Bergeron et al. (2011) Bergeron, P., Wesemael, F., Dufour, P., et al. 2011, ApJ, 737, 28
- Bischoff-Kim & Østensen (2011) Bischoff-Kim, A. & Østensen, R. H. 2011, ApJ, 742, L16
- Bohlin et al. (1978) Bohlin, R. C., Savage, B. D., & Drake, J. F. 1978, ApJ, 224, 132
- Brassard et al. (2007) Brassard, P., Fontaine, G., Dufour, P., & Bergeron, P. 2007, in Astronomical Society of the Pacific Conference Series, Vol. 372, 15th European Workshop on White Dwarfs, ed. R. Napiwotzki & M. R. Burleigh, 19
- Chayer (2014) Chayer, P. 2014, MNRAS, 437, L95
- Chayer & Dupuis (2010) Chayer, P. & Dupuis, J. 2010, in American Institute of Physics Conference Series, Vol. 1273, American Institute of Physics Conference Series, ed. K. Werner & T. Rauch, 394–399
- Chayer et al. (1995) Chayer, P., Fontaine, G., & Wesemael, F. 1995, ApJS, 99, 189
- Dufour et al. (2011) Dufour, P., Ben Nessib, N., Sahal-Bréchot, S., & Dimitrijević, M. S. 2011, Baltic Astronomy, 20, 511
- Dufour et al. (2005) Dufour, P., Bergeron, P., & Fontaine, G. 2005, ApJ, 627, 404
- Dufour et al. (2010) Dufour, P., Desharnais, S., Wesemael, F., et al. 2010, ApJ, 718, 647
- Dufour et al. (2008) Dufour, P., Fontaine, G., Liebert, J., Schmidt, G. D., & Behara, N. 2008, ApJ, 683, 978
- Dufour et al. (2012) Dufour, P., Kilic, M., Fontaine, G., et al. 2012, ApJ, 749, 6
- Dufour et al. (2007) Dufour, P., Liebert, J., Fontaine, G., & Behara, N. 2007, Nature, 450, 522
- Dufour et al. (2002) Dufour, P., Wesemael, F., & Bergeron, P. 2002, ApJ, 575, 1025
- Dupuis et al. (2010) Dupuis, J., Chayer, P., & Hénault-Brunet, V. 2010, in American Institute of Physics Conference Series, Vol. 1273, American Institute of Physics Conference Series, ed. K. Werner & T. Rauch, 412–417
- Farihi et al. (2005) Farihi, J., Becklin, E. E., & Zuckerman, B. 2005, ApJS, 161, 394
- Farihi et al. (2013) Farihi, J., Gänsicke, B. T., & Koester, D. 2013, Science, 342, 218
- Fontaine & Brassard (2005) Fontaine, G. & Brassard, P. 2005, in ASP Conf. Ser. 334: 14th European Workshop on White Dwarfs, ed. D. Koester & S. Moehler, 49
- Fontaine et al. (1981) Fontaine, G., Villeneuve, B., & Wilson, J. 1981, ApJ, 243, 550
- Gänsicke et al. (2012) Gänsicke, B. T., Koester, D., Farihi, J., et al. 2012, MNRAS, 424, 333
- Green et al. (2012) Green, J. C., Froning, C. S., Osterman, S., et al. 2012, ApJ, 744, 60
- Gudennavar et al. (2012) Gudennavar, S. B., Bubbly, S. G., Preethi, K., & Murthy, J. 2012, ApJS, 199, 8
- Kilkenny et al. (2009) Kilkenny, D., O’Donoghue, D., Crause, L. A., Hambly, N., & MacGillivray, H. 2009, MNRAS, 397, 453
- Koen et al. (1995) Koen, C., O’Donoghue, D., Stobie, R. S., Kilkenny, D., & Ashley, R. 1995, MNRAS, 277, 913
- Koester et al. (2014) Koester, D., Gänsicke, B. T., & Farihi, J. 2014, A&A, 566, A34
- Koester & Knist (2006) Koester, D. & Knist, S. 2006, A&A, 454, 951
- Koester et al. (1982) Koester, D., Weidemann, V., & Zeidler-KT, E. M. 1982, A&A, 116, 147
- Lodders et al. (2009) Lodders, K., Palme, H., & Gail, H.-P. 2009, Landolt Börnstein, 44
- Marsh & Duck (1996) Marsh, T. R. & Duck, S. R. 1996, MNRAS, 278, 565
- Monet (1998) Monet, D. 1998, USNO-A2.0 (United States Naval Observatory c1998)
- Montgomery et al. (2010) Montgomery, M. H., Provencal, J. L., Kanaan, A., et al. 2010, ApJ, 716, 84
- Nitta et al. (2012) Nitta, A., Koester, D., Chu, D., et al. 2012, in Astronomical Society of the Pacific Conference Series, Vol. 462, Progress in Solar/Stellar Physics with Helio- and Asteroseismology, ed. H. Shibahashi, M. Takata, & A. E. Lynas-Gray, 171
- Østensen et al. (2011) Østensen, R. H., Bloemen, S., Vučković, M., et al. 2011, ApJ, 736, L39
- Osterman et al. (2011) Osterman, S., Green, J., Froning, C., et al. 2011, Ap&SS, 335, 257
- Pelletier et al. (1986) Pelletier, C., Fontaine, G., Wesemael, F., Michaud, G., & Wegner, G. 1986, ApJ, 307, 242
- Petitclerc et al. (2005) Petitclerc, N., Wesemael, F., Kruk, J. W., Chayer, P., & Billères, M. 2005, ApJ, 624, 317
- Schlegel et al. (1998) Schlegel, D. J., Finkbeiner, D. P., & Davis, M. 1998, ApJ, 500, 525
- Sullivan et al. (2007) Sullivan, D. J., Metcalfe, T. S., O’Donoghue, D., et al. 2007, in Astronomical Society of the Pacific Conference Series, Vol. 372, 15th European Workshop on White Dwarfs, ed. R. Napiwotzki & M. R. Burleigh, 629
- Tassoul et al. (1990) Tassoul, M., Fontaine, G., & Winget, D. E. 1990, ApJS, 72, 335
- Thejll et al. (1990) Thejll, P., Shipman, H. L., MacDonald, J., & Macfarland, W. M. 1990, ApJ, 361, 197
- Unglaub & Bues (2000) Unglaub, K. & Bues, I. 2000, A&A, 359, 1042
- Vennes et al. (1988) Vennes, S., Pelletier, C., Fontaine, G., & Wesemael, F. 1988, ApJ, 331, 876
- Voss et al. (2007) Voss, B., Koester, D., Napiwotzki, R., Christlieb, N., & Reimers, D. 2007, A&A, 470, 1079
- Wegner & Koester (1985) Wegner, G. & Koester, D. 1985, ApJ, 288, 746
- Werner et al. (2004) Werner, K., Rauch, T., Barstow, M. A., & Kruk, J. W. 2004, A&A, 421, 1169
- Zagury (2013) Zagury, F. 2013, Astronomische Nachrichten, 334, 1107
- Zuckerman et al. (2007) Zuckerman, B., Koester, D., Melis, C., Hansen, B. M., & Jura, M. 2007, ApJ, 671, 872