Initiation of CME event observed on November 3, 2010: Multi-wavelength Perspective
Abstract
One of the major unsolved problems in Solar Physics is that of CME initiation. In this paper, we have studied the initiation of a flare associated CME which occurred on 2010 November 03 using multi-wavelength observations recorded by Atmospheric Imaging Assembly (AIA) on board Solar Dynamics Observatory (SDO) and Reuven Ramaty High Energy Solar Spectroscopic Imager (RHESSI). We report an observation of an inflow structure initially in 304 Å and in 1600 Å images, a few seconds later. This inflow strucure was detected as one of the legs of the CME. We also observed a non-thermal compact source concurrent and near co-spatial with the brightening and movement of the inflow structure. The appearance of this compact non-thermal source, brightening and movement of the inflow structure and the subsequent outward movement of the CME structure in the corona led us to conclude that the CME initiation was caused by magnetic reconnection.
1 Introduction
Coronal Mass Ejections (CMEs) are the most energetic Solar Events. These are considered to be the direct consequence of dynamics of the solar atmosphere. CMEs are one of the fundamental processes responsible for transfer of mass and energy from the Sun into the heliosphere. They represent potential threats to the space weather and geo-space climate. In spite of considerable advancement in the quality of the observational data and numerical simulations, the initiation of CMEs is still a matter of strong debate. For reviews see e.g., Schwenn et al. (2006); Gopalswamy et al. (2006); Webb and Howard (2012).
Observationally, the evolution of CMEs have been found to have mainly three different stages, namely - initiation, acceleration and propagation. The initiation phase, also called as the slow rise phase, often found to be associated with the pre-flare phase of the associated Soft X-ray flaring emission (e.g., Chifor et al., 2006). While the acceleration phase of the CME often corresponds to magneto-hydrodynamic instability and main phase or impulsive phase of the flare and the propagation phase of the CME corresponds to the decay phase of the flare (see e.g. Zhang and Dere, 2006; Chifor et al., 2006, 2007; Tripathi et al., 2013, and references therein).
Magnetic reconnection (Parker, 1963; Petscheck, 1964) has been considered to play an important role in the initiation of almost all the dynamic and eruptive solar events such CMEs (Sterling and Moore, 2005; Chifor et al., 2006, 2007), flares (see e.g., Sweet, 1958; Shibata, 1996; Priest and Forbes, 2002; Tripathi et al., 2004; Su et al., 2013), partial eruption of prominences (Gibson and Fan, 2006; Tripathi et al., 2006a, b, 2009, 2013) coronal jets (Shibata et al., 1992, 1994; Shibata, 2008; Chifor et al., 2008), etc observed in the solar atmosphere. There have been numerous indirect evidences for the reconnection phenomena such as reconnection inflow (Yokoyama et al., 2001; Savage et al., 2012; Takasao et al., 2012) and reconnection outflow (McKenzie and Hudson, 1999, 2001; Tripathi et al., 2006b, 2007; Savage et al., 2010), non-thermal hard X-ray sources associated with initiation of CMEs Chifor et al. (2006). However, these different signatures have been observed individually in separate dynamic events. Coronal mass ejections are almost always associated with solar flares, for which reconnection is a very important concept (Benz et al., 2008).

A flare associated CME was observed on 2010 November 03 originating from the partially occulted active region AR 11121. This event was well observed by Atmospheric Imaging Assembly (AIA) on board Solar Dynamics Observatory (SDO), Reuven Ramaty High Energy Solar Spectroscopic Imager (RHESSI) and radio instruments. Number of papers have been published addressing various issues associated with flares and CMEs. For example, the evolution phase of the CME and associated flare is studied by Reeves and Golub (2011); Savage et al. (2012); Kumar and Innes (2013); Foullon et al. (2011); Cheng et al. (2011); Hannah and Kontar (2013); Glesener et al. (2013) including the relationship between flares and CMEs. The associated decimetric/metric type II radio burst is analysed by Bain et al. (2012); Zimovets et al. (2012). Moreover, this event showed the first evidence of magnetic Kelvin-Helmholtz instability in the solar corona which were reported by Foullon et al. (2011, 2013). However, none of the above papers studied the near-limb region of the event nor considered the initiation phase of the CME.
The main aim of this paper is to study the initiation of this flare-CME event by making use of the multi-wavelength observations recorded by AIA/SDO and RHESSI. By combining these observations, we find that magnetic reconnection is the cause for the initiation of this CME event. AIA images taken at 304 Å and 1600 Å show signature of inflow structure consistent with the time and location of Hard X-ray emission imaged by RHESSI. Rest of the paper is structured as follows. In section 2 we report the observations. In section 3 we describe our data analysis and results followed by the discussion and conclusion in section 4.
2 Observations
In the current analysis, we have focussed on AIA and RHESSI data obtained during the early rise phase of the CME initiation. The Atmospheric Imaging Assembly (AIA; Lemen et al., 2012) onboard Solar Dynamic Observatory (SDO) provides continuous full disk observations of the solar atmosphere in 10 different UV/EUV passbands with a high spatial resolution (pixel size of 0.6), a temporal resolution of 12 seconds and a field of view covering up to 1.3 solar radii. we have concentrated only on three AIA channels, namely 1600 Å dominated by C IV emission (transition region temperature and the continuum emission from the photosphere), 304 Å dominated by chromospheric He II at quiet conditions and 131 Å dominated by coronal Fe VIII, Fe XX, Fe XXIII. The readers are referred to O’Dwyer et al. (2010), for detailed description of EUV filters in AIA and their temperature response. The observations recorded using other wavelength channels have been extensively analysed by previous authors. The features studied in the current paper have not been observed in other wavelength channels. All the data are reduced and prepared using the standard procedures available in the solarsoft libraries.
The RHESSI mission (Lin et al., 2002) provides high-resolution spectra and images in hard X-rays, from 3 keV to 17 MeV. It has nine sub-collimators, all with different spatial resolutions and each sub-collimator does not modulate flux from sources larger than its resolution (Hurford et al., 2002). In this work, we have used only sub-collimators 3–5 which have resolutions from 7 to 20 arcseconds.
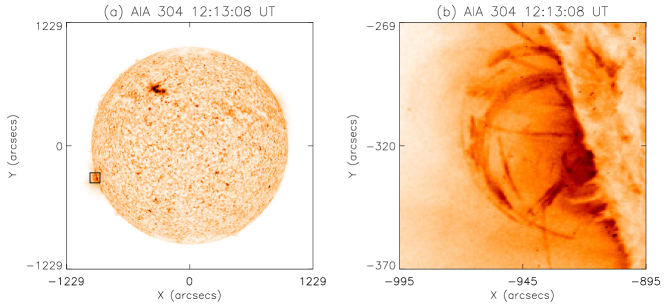
On 03 November 2010, AIA observed an event originating from the East limb at around 12:13 UT. The source region was located 5-7 degree behind the optical limb Glesener et al. (2013). The source region appeared on the visible disk on 05 November 2010 and was named as AR11121. The left panel of Figure 1 displays the full disk image of the Sun taken using 304 Å filter. The small over-plotted box on the East limb represents the 100 X 100 area of interest.The right panel shows the close-up of the region shown via box in the left panel. Figure 2 shows three seconds averaged soft X-ray flux of the associated C4.9 class flare between 1–8 Å obtained using GOES 14 satellite. The profile suggest that the flare started at around 12:07 UT with a peak at around 12:21 UT. A pre-flare bump is also noticeable before the main phase of the flare.
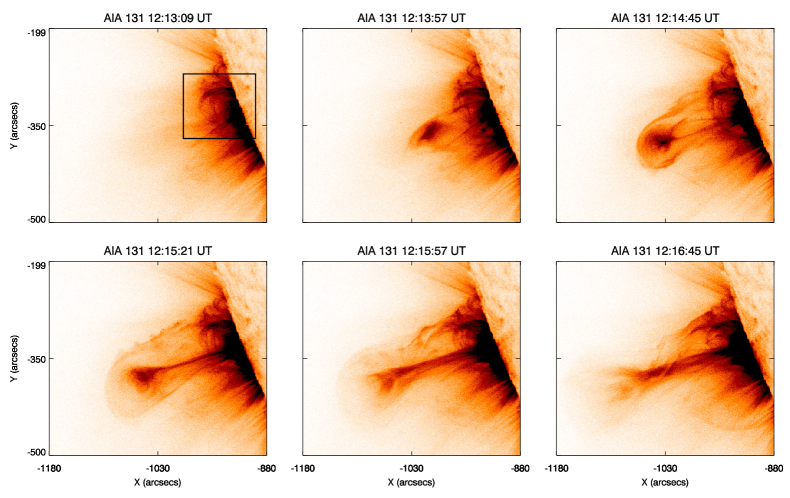
Figure 3 displays the complete evolution of the flare-CME event. A bright loop like structure emanates from the source region at 12:13:09 UT, which later became a CME. With passing time, the structure evolves and shows a fully formed flux rope with a current sheet underneath and overlying loop structure. The over plotted box shows the region which we analyse in detail.
3 Data Analysis and Results
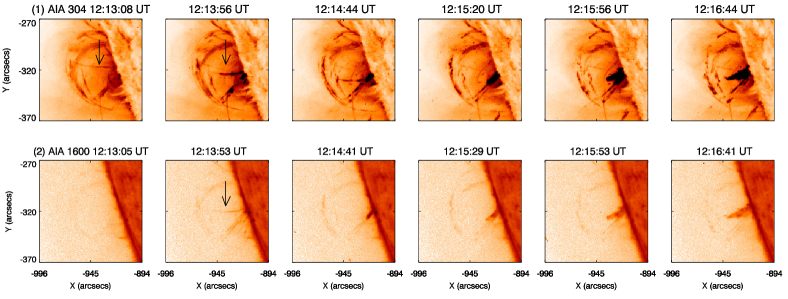
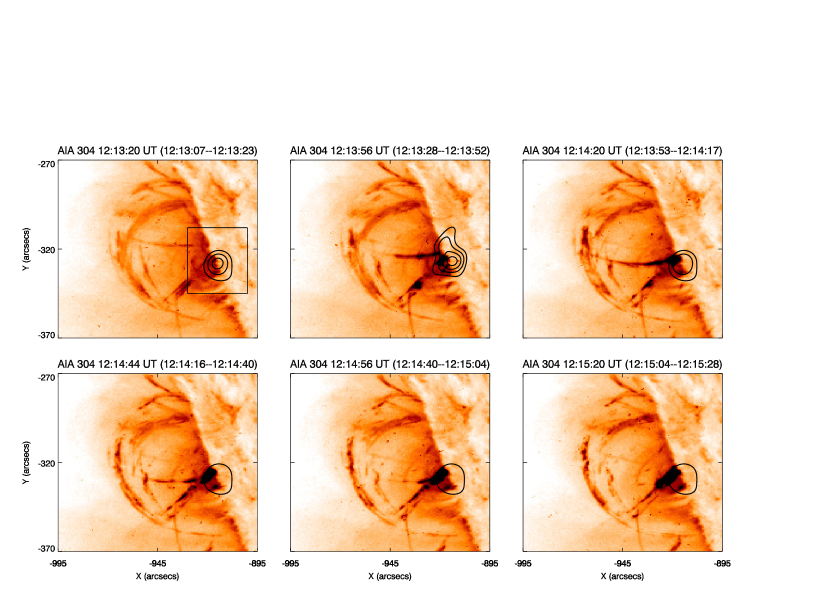
Figure 4 show observations of the source region taken with 304 Å (top row) and 1600 Å (bottom row) filters between 12:13 to 12:17 UT, which corresponds to the rise phase during the CME initiation and the impulsive phase of the associated flare (see Fig. 2). The field of view of these images corresponds to the boxes shown in Fig 1 and Fig 3. The images in both the wavelengths show loop like structures and other filamentary structures. A close analysis of images taken in 304 Å (top row) reveals a pre-existing vertical structure (with respect to the limb; marked with arrows in the first and second panels of Fig. 4), that moves southward as seen in the subsequent images. We refer to this structure as ”inflow structure” hereafter. The vertical inflow structure first brightens up in 304 Å image at 12:12:56 UT. With passing time, as it moves southwards, it becomes brighter and finally disappears at 12:15:20 UT. By tracking a point on the inflow structure at different instances of time until it disappears, we determined the speed which was 105 km s-1.
This inflow structure remains invisible in the 1600 Å images until the structure starts moving in 304 Å images. Once the inflow structure starts to move southwards and gets brightened in 304 Å, it becomes visible in the 1600 Å images at about 12:13:28 UT (structure is shown by an arrow in the second panel of the bottom row in Fig 4). This structure is, however, seen until 12:14:17 UT in 1600 Å images and disappears completely, which coincides with the fading of this structure in 304 Å images. A jet like outward moving structure, similar to that is seen in 304 Å images, is also observed. Absence of this structure in 1700 Å images, confirms that the 1600 Å emission comes mainly from the C IV, i.e. the emitted plasma is at the transition region temperature.
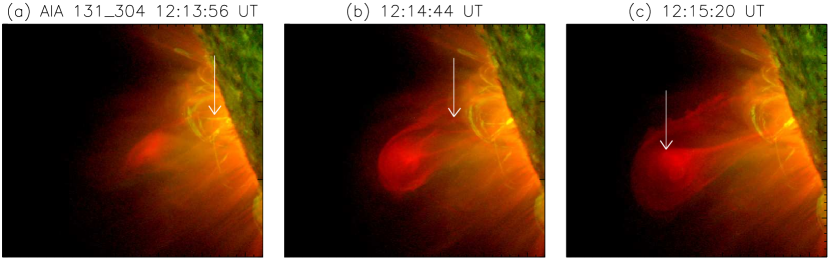
Figure 5 shows three snapshots of composite images near simultaneously recorded using 304 Å (green) and 131 Å (red). The arrow in the left panel image locates the inflow structure seen in 304 Å images (discussed earlier). The middle panel shows the inflow structure seen in 304 Å is connected to the northern leg of the blob seen in 131 Å, as marked by an arrow. The arrow in the right panel shows the fully formed flux rope like structure. The associated animation composite_movie_131_304.mpg reveals the evolution of the CME seen in 131 Å and the inflow structure seen in 304 Å. The composite movie shows a large scale faint disturbance which occurs in close association with the first brightening of the inflow structure in 304 Å images. A diffuse blob-like structure appears and starts to move outwards in concurrence with the inflow structure sweeping in towards the south. The composite images taken at 12:14:20 UT shows a blob like structure with two legs emanating from the location where the inflow structure merge with another pre-existing structure. By 12:14:44 UT, the blob like structure takes a shape of a fully formed flux-rope with an overlying loops. We interpret this inflow structure to be reconnection inflow, which moves southward to reconnection location at which it merges with other magnetic structure and disappears.

Distinct Hard X-ray (HXR) emission regions were observed by RHESSI (see Figure 3 in Glesener et al., 2013). Using 18-40 keV RHESSI observations with two step CLEAN method (Krucker et al., 2011), they observed two distinct HXR sources: a compact source near the limb and a coronal extended diffuse source. The later was co-spatial and co-temporal to the main phase of the flares and associated erupting CME as observed in AIA 131 Å images. However, the compact source appeared about 30 seconds prior to the coronal extended diffuse source. The delay could not be explained by the difference in electron densities due to much shorter time for thermalisation of the accelerated electrons. An explanation could be there were two different reconnection events, one occurring closer to the limb and other at higher altitude in the corona. The start timing and location of the compact source near the limb matches with the brightening and movement of the inflow structure observed in 304 Å images shown in Fig. 4. In this paper we have, therefore, focused on this particular source.
Figure 6 shows GOES Soft X-ray flux profile integrated between 1-8 Å (top panel) and Hard X-ray (HXR) light curve integrated between 18-40 keV (bottom panel). Right at the beginning of the impulsive phase of the flare, an enhancement in HXR source is seen. First appearance of this HXR emission is at 12:12:56 UT. This also marks the onset of the rise phase of CME initiation and the brightening and movement of 304 Å inflow structure. Moreover, the HXR light curve shows two peaks (bottom panel of Fig. 6). The first peak corresponds to the very early times of the impulsive phase of the flare and the intensity is about 20% larger than the second peak. The two vertical lines mark the time interval which corresponds to the brightening, movement and disappearance of the inflow structure seen in 304 Å. In order to probe the spatial relation between location of the near limb compact HXR source and the inflow structure observed in 304 Å images, we have created HXR images with CLEAN algorithm (Hurford et al., 2002). Figure 7 shows the sequence of (reverse colored) images observed during the course of this event in 304 Å over-plotted with RHESSI contours. The contours in each frame correspond to the ratios of the HXR fluxes observed in that particular frame with respect to the peak flux. The top-middle panel corresponds to the peak timing of the HXR light curve. Hence, it shows a range of contours corresponding to 30%, 50%, 70% and 90% of the peak flux, respectively. The box over-plotted in the top-left panel shows the field of view that is used to generate the light curve of the near limb compact hard X-ray source shown in Figure 6. As can be seen from the Figures 6 and 7, the HXR emission in 18-40 keV is co-temporal with the inflow motion and co-spatial with the base of the inflow structure, suggesting that this inflow is indeed the reconnection inflow that energizes the flare. One puzzling point in this interpretation is the brightening of the inflow seen in 304 Å Figure 7, because the inflow should be pre-heated plasma. One possibility is that the inflow is heated by the leakage of the heat from the reconnection region by thermal conduction, as suggested by Yokoyama and Shibata (1997) and Chen et al (1999).
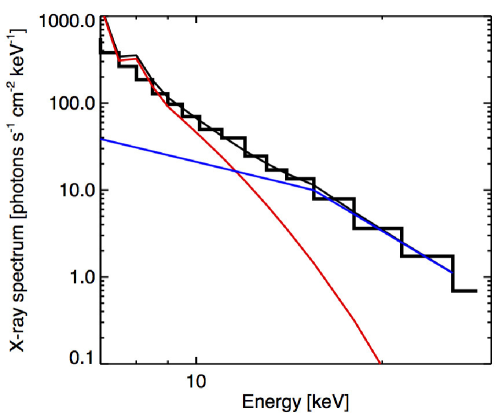
We have also performed the spectral analysis of the near-limb HXR source during the time interval 12:12:56 - 12:13:50 UT. The images were individually checked to ensure that Clean components were not found high in the corona, to verify that the images are not contaminated by flux from the high-coronal source. A photon spectrum was fit to the fluxes of these Clean images for this time interval and is shown in Figure 8; fit components included a thermal distribution (T= 21.7 MK) and a broken power-law with spectral index 4.2. The existence of a power law component above 20 keV confirms a population of flare-accelerated electrons in the near-limb source. This analysis suggests that non-thermal nature of the source, demonstrating magnetic reconnection processes in action, which in turn leads to the movement of the inflow structure seen in 304 Å observations and initiation of the CME event.
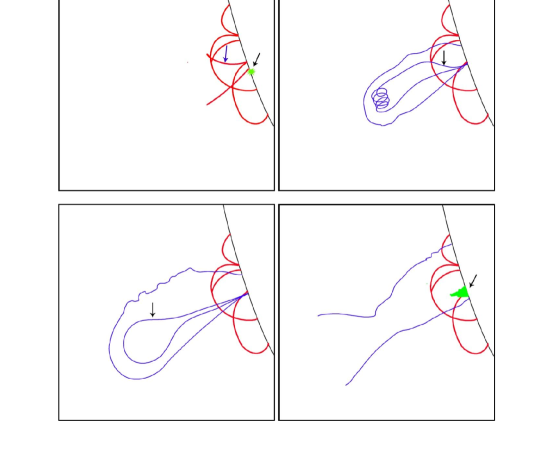
Figure 9 depicts the complete evolution of initiation phase of the event. The top left panel shows the structures in the source region (shown in red) including the inflow structure (marked with a blue arrow) seen in 304 Å image before the CME eruption. The structure depicted by blue line indicates flux rope structure as observed in 131 Å. The inflow structure in the top left panel brightens up with the occurrence of non-thermal bright compact HXR source (18-40 keV) shown in green and marked with a black arrow, observed at 12:12:56 UT. Top right panel shows the inflow structure as it appears in 304 Å and is connected to the northern leg of the blob seen in 131 Å, as marked by an arrow. The fully formed flux rope structure shown in bottom left panel and marked with an arrow later erupts as a CME. The Bottom right panel shows the evolution of jet material (shown in green) that appears concurrent with the pinching of the inflow structure. The appearance of this compact non-thermal source, brightening and movement of the inflow structure and the subsequent outward movement of the CME structure in the corona led us to conclude that the magnetic reconnection is the cause for the CME initiation. Based on the location of the HXR source followed by moving inflow structure and subsequent UV brightening associated with jet, we infer that the reconnection region is located at even lower altitude than that was reported by Savage et al. (2012).
4 Summary and Conclusions
The problem of CME initiation is one of the major unsolved problems in Solar Physics. This has profound impact on space weather forecasting. In this paper, we have probed the initiation phase of a well observed flare associated CME event which occurred on November 03, 2010 using multi-wavelength observations recorded using AIA onboard SDO and RHESSI. The later evolution phase of the CME and associated flare event has been studied in detail by various authors (e.g., Reeves and Golub, 2011; Savage et al., 2012; Kumar and Innes, 2013; Foullon et al., 2011; Cheng et al., 2011; Bain et al., 2012; Zimovets et al., 2012; Hannah and Kontar, 2013; Glesener et al., 2013). However, no one has studied the initiation phase of the CME, which is the aim of this paper.
The results are summarised below:
-
•
An inflow structure was observed in 304 Å images. The same inflow structure appeared after about few seconds in 1600 Å images, suggesting heating of the inflow structure, which is also demonstrated by the increase in the brightening of the inflow structure in 304 Å observations.
-
•
A bubble like structure, which later became a flux rope like structure and erupted as CME, started to rise in 131 Å images exactly at the time when the inflow structure was first seen.
-
•
A compact HXR source was seen over the limb at about 12:12:56 UT, exactly at the time of the first brightening in the inflow structure followed by its movement. The start of the movement of the inflow structure and appearance of the HXR compact source matched with the time of the rising blob which later manifested as a CME. The light curve of this source unveils that the HXR fluxes increase, until it peaks at about 12:13:30 UT and then fades to a minimum by 12:14:20 UT. The spectral analysis of the source suggests the non-thermal nature of the source, demonstrating the magnetic reconnection processes to be responsible for the HXR emission.
These observations suggest that the initiation of the CME is triggered by magnetic reconnection taking place in the source region. This is demonstrated by brightening of the inflow structures co-temporal with the non-thermal compact HXR source in the source region and outward movement of the blob-like structure which later manifests itself as a CME.
A plausible interpretation could be the following. As it is revealed by the images obtained at 131 Å, there is a blob like structure pre-existing in the corona with the inflow structure 304 Å as one of the legs. This structure is in stable configuration under the Lorentz force balance. Due to the evolution of the magnetic field in the source region, magnetic reconnection takes place producing the compact non-thermal HXR. This could also be produced by magnetic reconnection between emerging flux with pre-existing flux (Chen and Shibata, 2000; Feynman and Martin, 1995; Chifor et al., 2007). The magnetic reconnection would intern change the force balance by reducing the pressure at the reconnection location. Due to this reduced pressure the inflow structure, which is seen as one of the legs of the CME, starts to move southwards towards the reconnection region and eventually also reconnects and disappears. Later on a jet like structure emanates from the location where the inflow structure reconnects. The jet like structure is clearly observed in 304 Å and 1600 Å images. The detection of the HXR source, the southward movement of the inflow structure and rise of the CME structure in the corona is closely related to each other.
In the beginning of the event, the CME structure appears as blob-like, which later revealed a helical structure with a overlying structure. Therefore, the current observation also signifies that the formation of the flux rope that is likely to be a consequence of the reconnection. Moreover, for the first time we observe signature of magnetic reconnection in lines like 304 Å and 1600 Å. Such observations may have potential to provide information on reconnection processes occurring in partially ionised plasmas.
References
- Bain et al. (2012) Bain, H. M. and Krucker, S. and Glesener, L. and Lin, R. P. 2012, ApJ, 750, 44B
- Benz et al. (2008) Benz, A. O. 2008, Living Reviews in Solar Physics, 5, 1
- Carmichael (1964) Carmichael, H. 1964, in proceedings of the AAS-NASA Symposium held 28-30 October, 1963 at the Goddard Space Flight Center, Greenbelt, MD. Edited by Wilmot N. Hess. Washington, DC: National Aeronautics and Space Administration, Science and Technical Information Division, 1964., p.451
- Chen et al (1999) Chen, P.F., FANG C., TANG Y.H. and DING M. D. 1999, ApJ, 513, 516
- Chen and Shibata (2000) Chen, P. F. and Shibata, K. 2000, ApJ, 545, 524
- Cheng et al. (2011) Cheng, X. and Zhang, J. and Liu, Y. and Ding, M. D. 2011, ApJ, 732L, 25C
- Cheng et al. (2012) Cheng, X. and Zhang, J. and Saar, S. H. and Ding, M. D. 2012, ApJ, 761, 62C
- Chifor et al. (2006) Chifor, C., Mason, H. E., Tripathi, D., Isobe, H., and Asai, A. 2006, A&A, 458, 965
- Chifor et al. (2007) Chifor, C., Tripathi, D., Mason, H. E. and Dennis, B. R. 2007, A&A, 472, 967
- Chifor et al. (2008) Chifor, C., Young, P. R., Isobe, H. et al. 2008, 481, 57
- Del Zanna et al (2011) Del Zanna, G., O’Dwyer, B., and Mason, H. E. 2011, 535, 46
- Feynman and Martin (1995) Feynman, J. and Martin, S. F. 1995, J. Geophys. Res., 100, 3355
- Foullon et al. (2011) Foullon, C. and Verwichte, E. and Nakariakov, V. M. and Nykyri, K. and Farrugia, C. J. 2011, ApJ, 729L, 8F
- Foullon et al. (2013) Foullon, C. and Verwichte, E. and Nykyri, K. and Aschwanden, M. and Hannah, I. 2011, ApJ, 767, 170
- Gibson and Fan (2006) Gibson, S. E. and Fan, Y. 2006, ApJ, 637, 65
- Glesener et al. (2013) Glesener, L., Krucker, S., Bain, H. M. and Lin, R. P. 2013, ApJ, 779, 29
- Gopalswamy et al. (2006) Gopalswamy, N., Mikić, Z., Maia, D. et al. 2006, Space Sci. Rev., 123, 303
- Green and Kliem (2009) Green, L. M. and Kliem, B. 2009, ApJ, 700, 83
- Hannah and Kontar (2013) Hannah, I. G. and Kontar, E. P. 2013, A&A, 553A, 10H
- Hirayama (1974) Hirayama, T. 1974, Sol. Phys., 34, 323H
- Huang et al. (2008) Huang, G. and Ji, H. and Wu, G. 2008, ApJ, 672L, 131H
- Hurford et al. (2002) Hurford, G. J., Schmahl, E. J., Schwartz, R. A., et al. 2002, Sol. Phys., 210, 61
- Isobe et al. (2005) Isobe, H. Takasaki, H. and Shibata, K. 2005, ApJ, 632, 1184
- Kopp and Pneuman (1976) Kopp, R. A. and Pneuman, G. W. 1976, Sol. Phys., 50, 85K
- Kumar and Innes (2013) Kumar, P. and Innes, D. E. 2013, Sol. Phys., 288, Issue 1, 255
- Krucker et al. (2011) Krucker, S., Kontar, E. P., Christe, S., Glesener, L., & Lin, R. P. 2011, ApJ, 742, 82
- Lemen et al. (2012) Lemen, J. R. and Title, A. M. and Akin, et al. 2012, Sol. Phys., 275, 17L
- Lin et al. (2001) Lin, J. and Forbes, T. G. and Isenberg, P. A. 2001, J. Geophys. Res., 10625053L
- Lin et al. (2002) Lin, R. P., Dennis, B. R., Hurford, G. J., et al. 2002, Sol. Phys., 210, 3
- Lin et al. (2005) Lin, J. and Ko, Y.-K. and Sui, L. and Raymond, J. C. and Stenborg, G. A. and Jiang, Y. and Zhao, S. and Mancuso, S. 2005, ApJ, 622, 1251L
- Liu et al. (2010) Liu, R. and Lee, J. and Wang, T. and Stenborg, G. and Liu, C. and Wang, H. 2010, ApJ, 723L, 28L
- McKenzie and Hudson (1999) McKenzie, D. E. and Hudson, H. S. 1999, 194th AAS Meeting, 101.08; Bulletin of the American Astronomical Society, Vol. 31, p.999
- McKenzie and Hudson (1999) McKenzie, D. E. and Hudson, H. S. 1999, ApJ, 519, 93M
- McKenzie and Hudson (2001) McKenzie, D. E. and Hudson, H. S. 2001, Earth, Planets and Space, 53, 577M
- Narukage and Shibata (2006) Narukage, N. and Shibata, K. 2006, ApJ, 637, 1122N
- O’Dwyer et al. (2010) O’Dwyer, B., Del Zanna, G., Mason, H. E., Weber, M. A. and Tripathi, D. 2010, A&A, 521, 210
- Parker (1963) Parker, E. N. 1963, ApJS, 8, 177P
- Patsourakos et al. (2010) Patsourakos, S. and Vourlidas, A. and Stenborg, G. 2010, ApJ, 724L, 188P
- Petscheck (1964) Petschek, H. E. 1964, in proceedings of the AAS-NASA Symposium held 28-30 October, 1963 at the Goddard Space Flight Center, Greenbelt, MD. Edited by Wilmot N. Hess. Washington, DC: National Aeronautics and Space Administration, Science and Technical Information Division, 1964., p.425
- Priest and Forbes (2002) Priest, E. R. and Forbes, T. G. 2002, A&A Rev., 10, 313P
- Reeves and Golub (2011) Reeves, K. K. and Golub, L. 2011, ApJ, 727L, 52R
- Savage et al. (2010) Savage, S. L. and McKenzie, D. E. and Reeves, K. K. and Forbes, T. G. and Longcope, D. W. 2010, ApJ, 722, 329S
- Savage et al. (2012) Savage, S. L. and Holman, G. and Reeves, K. K. and Seaton, D. B. and McKenzie, D. E. and Su, Y. 2012, ApJ, 754, 13S
- Schwenn et al. (2006) Schwenn, R., Raymond, J. C., Alexander, D. et al. 2006, Space Sci. Rev., 123, 127
- Shibata et al. (1992) Shibata, K. and Ishido, Y. and Acton, L. W. et al. 1992, PASJ, 44L, 173S
- Shibata et al. (1994) Shibata, K. and Nitta, N. and Strong, K. T. and Matsumoto, R. and Yokoyama, T. and Hirayama, T. and Hudson, H. and Ogawara, Y. 1994, ApJ, 431L, 51S
- Shibata (1996) Shibata, K. 1996, Advances in Space Research, 17, 9S
- Shibata (2008) Shibata, K. 2008, cosper, 37, 2858S
- Sterling and Moore (2005) Sterling, A. C. and Moore, R. L. 2005, ApJ, 613, 1221
- Sturrock and Coppi (1966) Sturrock, P. A. and Coppi, B. 1966, ApJ, 143, 3S
- Su et al. (2013) Su, Y., Veronig, A. M., Holman, B. R. et al. 2013, Nature Physics, 9, 489
- Sweet (1958) Sweet, P. A. 1958, in proceedings from IAU Symposium no. 6. Edited by Bo Lehnert. International Astronomical Union. Symposium no. 6, Cambridge University Press, p.123
- Takasao et al. (2012) Takasao, S. and Asai, A. and Isobe, H. and Shibata, K. 2012, ApJ, 745L, 6T
- Temmer et al. (2010) Temmer, M. and Veronig, A. M. and Kontar, E. P. and Krucker, S. and Vršnak, B. 2010, ApJ, 712, 1410T
- Temmer et al. (2008) Temmer, M. and Veronig, A. M. and Vrśnak, B. and Rybák, J. and Gömöry, P. and Stoiser, S. and Maričić, D. 2008, ApJ, 673L, 95T
- Tripathi et al. (2004) Tripathi, D., Bothmer, V. and Cremades, H. 2004, A&A, 422, 337
- Tripathi et al. (2006a) Tripathi, D. and Isobe, H. and Mason, H. E. 2006, A&A, 453, 1111
- Tripathi et al. (2006b) Tripathi, D. and Solanki, S. K. and Schwenn, R. and Bothmer, V. and Mierla, M. and Stenborg, G. 2006, A&A, 449, 369
- Tripathi et al. (2007) Tripathi, D. and Solanki, S. K. and Mason, H. E. and Webb, D. F. 2007, A&A, 472 633T
- Tripathi et al. (2009) Tripathi, D., Gibson, S. E., Qiu, J. et al. 2009, A&A, 498, 295
- Tripathi et al. (2009b) Tripathi, D., Kliem, B., Mason, H. E. et al. 2009, apj, 698, 27
- Tripathi et al. (2013) Tripathi, D., Reeves, K., Gibson, S. E., Srivastava, A. K., Joshi, N. C. 2013, 778, 142
- Webb and Howard (2012) Wedd, D. F. and Howard, T. A. 2012, Living reviews in solar physics, 9, 3
- White et al. (2012) White, R.S. and Verwichte, E. and Foullon, C. 2012, A&A, 545, A129
- White and Verwichte (2012) White, R.S. and Verwichte, E. 2012, A&A, 537, A49
- Williams et al. (2005) Williams, D. R., Török, T., Démoulin, P. et al. 2005, ApJ, 628, 163
- Yokoyama and Shibata (1997) Yokoyama, T. and Shibata, K. 1997, ApJ, 474, L61
- Yokoyama et al. (2001) Yokoyama, T. and Akita, K. and Morimoto, T. and Inoue, K. and Newmark, J. 2001, ApJ, 546L, 69Y
- Zhang and Dere (2006) Zhang, J. and Dere, K. P. 2006, ApJ, 649, 1100
- Zimovets et al. (2012) Zimovets, I. and Vilmer, N. and Chian, A.C.-L. and Sharykin, I. and Struminsky, A. 2012, A&A, 547, A6